Physical Address
304 North Cardinal St.
Dorchester Center, MA 02124
Physical Address
304 North Cardinal St.
Dorchester Center, MA 02124
Yo! What’s up, Chart Commandos and Future Market Rockstars! Ready to upgrade your TA skills again? This time, we’re not diving into complex indicators, but rather breaking down two classic, super practical Price Action patterns specifically designed to help you spot trend reversals – the 1-2-3 Rule and the 2B Pattern!
Always find it tough calling tops and bottoms? Wondering when a trend is really turning? These two rules offer a relatively objective set of criteria to judge when a trend might be exhausted and a reversal opportunity could be emerging! Think of them like the market’s “traffic lights” , signaling when it might be time to stop “going straight” and consider a “U-turn”!
Wanna know how to count the 1-2-3? What the heck is the 2B setup? What’s the logic behind them? How to use them in real trading to find sweet entry spots? Which rule suits you better? Okay! Let’s dive deep and thoroughly master these two classic Price Action reversal techniques! Let’s master the reversals!
These two rules aren’t specific indicators but rather pattern rules derived from observing price action structure and market psychology.
Roots of the 1-2-3 Rule: Dow Theory Connection
Yep! The core logic of the 1-2-3 rule is essentially the visualized and codified definition of a trend reversal according to Dow Theory!
What does Dow Theory say about reversals? An uptrend = Higher Highs (HH) + Higher Lows (HL). The first sign of reversal is the failure to make a new HH (potentially forming a Lower High, LH), and the crucial confirmation is breaking below the previous HL!
The 1-2-3 rule simply marks these three key steps of “structure break,” making it easier to identify and apply. It’s arguably one of the most fundamental and widely accepted definitions of a trend reversal.
Promoter of the 2B Pattern: Victor Sperandeo (“Trader Vic”)
The 2B pattern (sometimes called the Sperandeo Pattern) was significantly highlighted and popularized by the famous trader Victor Sperandeo in his book Trader Vic: Methods of a Wall Street Master.
His core idea revolves around observing the market’s “failure” behavior after testing a prior high or low. He believed that when price attempts to break a key high/low but fails and quickly reverses back through a key level, it’s often a powerful reversal signal because many breakout traders get trapped.
Purpose: Providing Objective Reversal Entry/Exit Rules – Whether it’s the 1-2-3 or the 2B, their goal is to give traders a relatively less subjective method for determining when a trend might be ending and provide potential reversal trading opportunities (or warn you that your with-trend position might need managing).
So, both rules are based on observing changes in price structure and shifts in market forces, making them common weapons in the Price Action trader’s arsenal.
【The 1-2-3 Reversal Rule】
Design Principle: Marks the three key steps of a “trend structure break” as defined by Dow Theory.
Rules (Example: Catching an Uptrend Reversing to Downtrend):
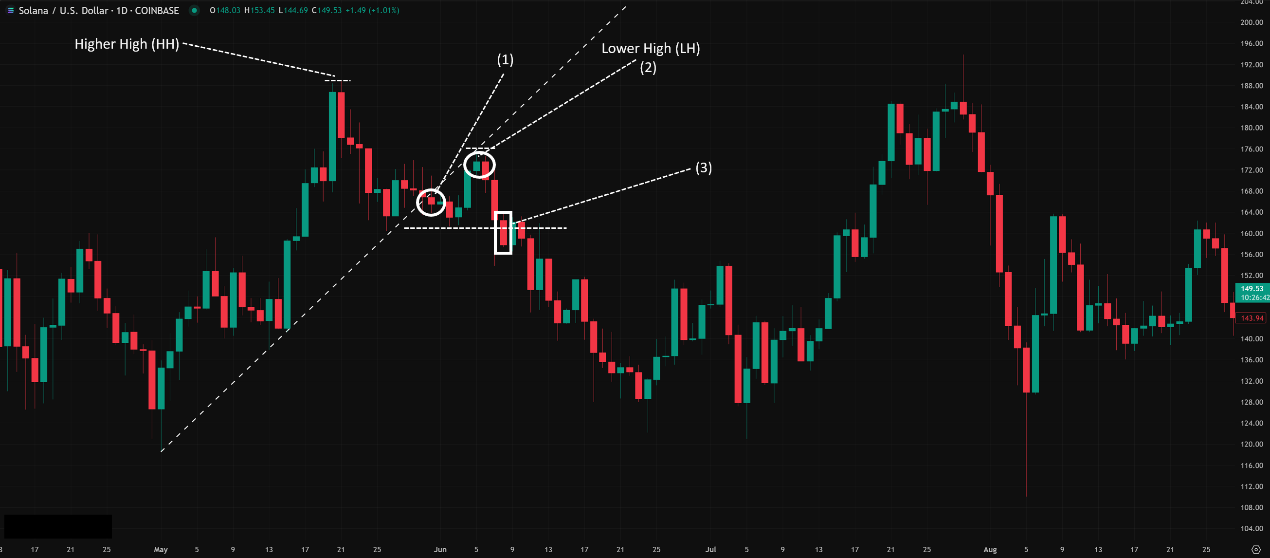
Trendline Break: First, a clear ascending trendline must be validly broken (price closes below the trendline). This is the first warning sign; upward momentum might be fading.
Failure to Make New High / Lower High Forms: After breaking the trendline, price rallies but fails to exceed the previous swing high (the peak formed before point 1). Instead, it forms a Lower High (LH). This is the second warning, confirming buyers couldn’t push to new highs. (This LH is “Point 2” in the 1-2-3).
Break Below Previous Low: Price falls from Point 2 and breaks below the short-term swing low that was formed after the trendline break but before the rally to Point 2. (This short-term low is “Point 1” in the 1-2-3 setup. The high before the trendline break can be considered “Point 0”, but discussion usually focuses on points 1-2-3). Breaking below Point 1 is the final confirmation signal! It signifies the market structure has officially shifted from HH+HL to LH+LL (Lower Low, because Point 1 was broken).
Catching a Downtrend Reversing to Uptrend: Rules are the exact opposite.
Break above descending trendline.
Pullback fails to make new low, forms Higher Low (HL).
Break above previous high (Point 1). Breaking Point 1 confirms!
「1-2-3 Rule Explained (Uptrend Reversal)」

【The 2B Reversal Pattern / Failure Test】
Design Principle: Captures the market’s failure to sustain a trend continuation attempt (breakout of prior high/low) followed by a swift reversal. This often signifies exhaustion of the original trend’s force or strong opposing pressure, trapping breakout traders.
Rules (Example: Catching a “Top 2B”):
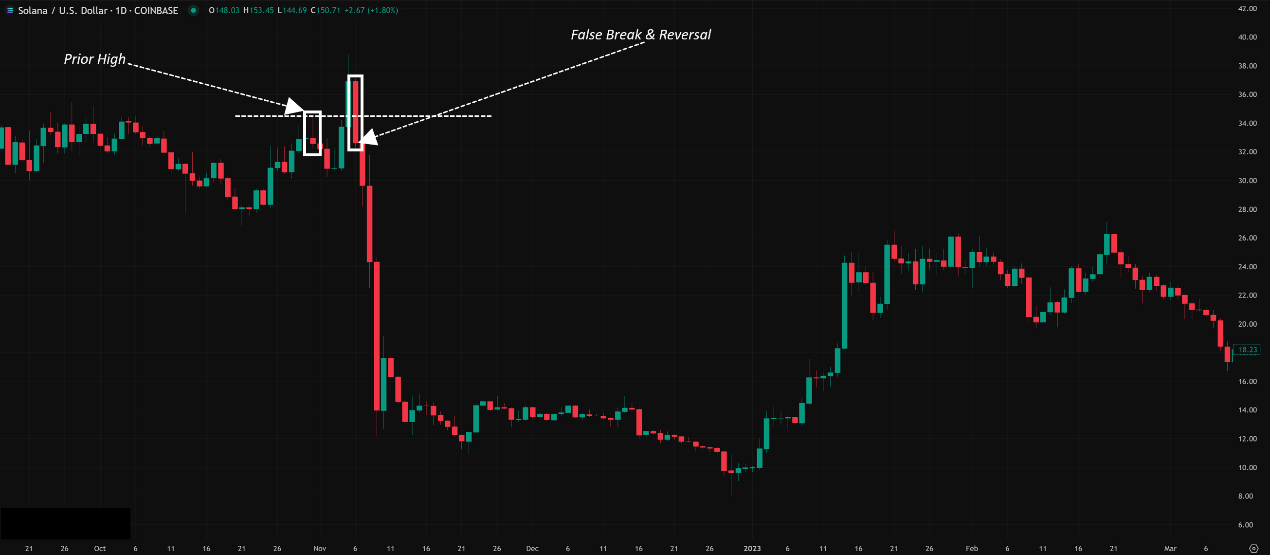
Test of Prior High: Price rallies and touches or slightly exceeds a previous significant swing high.
Failure & Reversal: Price fails to hold above the prior high and quickly reverses downwards, closing below the level of that prior high. This “false breakout” is key!
⚡️ Confirmation (Optional but Better): Price continues lower and breaks below the short-term swing low that led to the test of the high. (This confirmation condition makes it resemble 1-2-3, but the core of 2B is the false break in steps 1&2).
Catching a “Bottom 2B”: Rules are the exact opposite.
Test of Prior Low.
Failure & Reversal (Close above prior low).
⚡️ (Better Confirmation) Break above the short-term high formed before the test.
「 2B Pattern Explained (Top 2B)」
Recognized the patterns? Now, how to use them effectively in the heat of battle?
Level 1: Basic Usage – Recognizing Reversal Signals
1-2-3 Rule = Trend Structure Break Confirmation:
When you see all three steps of the 1-2-3 complete (especially the Step 3 confirmation break), it provides a relatively objective signal that the previous trend might be over.
Basic Use:
Bearish 1-2-3 appears in an uptrend -> Consider closing long positions, maybe explore short setups.
Bullish 1-2-3 appears in a downtrend -> Consider closing short positions, maybe explore long setups.
2B Pattern = False Breakout Reversal Signal:
When you see price fail its attempt to break a significant high/low and reverse quickly, it’s an earlier potential reversal signal.
Basic Use:
Top 2B occurs -> Consider shorting after the reversal candle confirms, stop loss slightly above the false breakout high.
Bottom 2B occurs -> Consider buying after the reversal candle confirms, stop loss slightly below the false breakout low.
「The False Reversal Trap of the 2B Rule」
How to increase the odds of these rules working?
A. Context is EVERYTHING!
Location! Location! Location! Just like candlestick patterns, WHERE the 1-2-3 or 2B pattern forms dramatically impacts its reliability!
High Probability Locations:
Major S/R Levels: Bullish 1-2-3 or Bottom 2B at long-term support; Bearish 1-2-3 or Top 2B at long-term resistance.
Key MA Lines: Reversal pattern forming near the 200 MA.
Key Fibo Retracement Levels: Reversal pattern appearing near the 61.8% Fibo level.
Overbought/Oversold Zones (with Indicators): Bearish patterns in RSI/Stochastics extreme overbought; Bullish patterns in oversold zones.
Low Probability Locations: Patterns forming in the middle of a range or far from any significant S/R level are less reliable.
B. Confirmation Adds Confidence!
Don’t jump the gun just because you see the shape! Wait for more evidence!
Candlestick Patterns: Are Point 2 / Point 1 of the 1-2-3, or the reversal point of the 2B, formed by strong reversal candles (e.g., Engulfing, Pin Bar)?
Volume:
1-2-3: Does the Step 3 breakout (below Point 1 / above Point 1) happen on increasing volume? Volume confirms the break!
2B: Volume might increase during the test of the high/low (luring breakout traders), but does volume pick up even more on the reversal itself? (Shows force behind the reversal).
Indicator Confirmation: As the reversal pattern forms, are oscillators like RSI/MACD also showing divergence or generating crossover signals?
Structure Confirmation: After a 1-2-3 completes, does price start forming the new trend structure (HH/HL or LH/LL)?
C. 1-2-3 vs. 2B – Which to Use?
1-2-3:
Pros: More aligned with strict Dow Theory definition, provides more structural confirmation of a reversal.
Cons: Signal is more lagging because you wait for the Point 1 break. Might miss the best entry point.
Best For: More conservative traders needing stronger confirmation, or confirming major trend shifts.
2B:
Pros: Signal is relatively earlier, potentially catching tops/bottoms closer to the extreme after the false breakout.
Cons: Less structurally complete than 1-2-3, potentially more “false” 2B signals (false breaks that don’t lead to sustained reversals).
Best For: More aggressive traders, top/bottom pickers, or those skilled at identifying false breakouts.
Use Together? Yes! For example, spot a 2B signal, then wait for the subsequent break of Point 1 (from a potential 1-2-3 setup) as a more conservative entry or add-on point.
D. Parameter Settings & Time Intervals (The Truth About Parameters!)
Do 1-2-3 and 2B Rules Have Parameters? NO! They are pattern rules based on price action, not calculated indicators!
Where are the “Parameters”?
How YOU define a “significant” Swing High/Low? How do you identify Point 0, 1, 2 for the 1-2-3 or the “prior high/low” for the 2B? This could be:
Subjective visual assessment.
Using helper indicators that have parameters, like Zig Zag (Parameter = Deviation/Depth) or Fractals (Parameter = Periods Left/Right). Different parameters on these tools will lead you to identify different highs/lows, thus affecting the 1-2-3/2B patterns you see.
How YOU define a “valid trendline break”? (For Step 1 of 1-2-3)
How YOU define “confirmation signals”?
Timeframe:
Crucial! 1-2-3 and 2B patterns appear on all timeframes.
Patterns on Higher Timeframes (H4, D1, W1) are generally MUCH more reliable and signify larger potential reversals!
Patterns on Lower Timeframes (M15, M5) might just be short-term noise and fail quickly.
Consistency: Use patterns on your primary trading timeframe for decisions, potentially referencing higher timeframe patterns for overall context.
How Global Traders Play It?
Many traders use Zig Zag (e.g., 5% Deviation) or Fractals (standard 2-2) to help objectively identify the key pivot points for 1-2-3 or 2B analysis.
Timeframe Choices:
Day Traders: Might look for 1-2-3 or 2B on M15/H1 but confirm with H4/D1 S/R levels.
Swing Traders: Primarily look for patterns on H4/D1, using W1 trend for context.
E. Which Combos Are “Hot” & Effective? (Hottest & Effective Setups)
No magic combo, as they are rules, not indicators. Effectiveness comes from application.
Effective Combo 1: Key S/R + 1-2-3 Confirmation + Volume
Execution: Price reaches long-term support -> Bullish 1-2-3 forms in the downtrend -> Step 3 breakout above Point 1 occurs on significant volume increase -> High probability buy setup. Reverse for bearish 1-2-3 at resistance.
Effectiveness: Combines location, structure, and volume for a very robust reversal strategy.
Effective Combo 2: Key S/R + 2B False Break + Reversal Candle + (Optional Structure Break Confirmation)
Execution: Price tests long-term resistance -> Top 2B pattern forms (false break + quick reversal) -> Reversal candle is a strong bearish pattern (e.g., Bearish Engulfing / Pin Bar) -> (Optional) Wait for break below the short-term low preceding the 2B test.
Effectiveness: Captures quick reversals after failed breakouts.
Effective Combo 3: Multi-Timeframe Confirmation
Execution: Bearish 1-2-3 forms on Daily chart -> H1 chart also shows a bearish 1-2-3 or breaks key support -> Signal strength is significantly amplified.
Effectiveness: High and low timeframe signals aligning increases reversal probability.
F. Best Parameter Combos? (Optimal Settings – It’s About the Rules!)
The Rules Themselves: No parameters.
Helper Indicator Parameters (e.g., Zig Zag):
No single best! Needs testing based on your goal (what size swings?) and asset.
Common Starting Points: Zig Zag (Deviation 5%-10%), Fractals (2-2).
Timeframe:
Higher is Better (H4, D1, W1) for primary signal generation.
Lower timeframes can be used for precise entry timing.
Conclusion: The power of 1-2-3 and 2B lies in your understanding of the rules, your judgment of market structure, and how you combine them with context and confirmation signals, NOT in finding magic helper indicator parameters.
The 1-2-3 Rule and 2B Pattern are two classic and highly practical trend reversal identification tools in Price Action trading. They provide relatively objective rules for judging when a trend might be ending.
1-2-3 Rule: Focuses on the step-by-step breakdown of trend structure (trendline -> failed high/low -> break of prior low/high). Signals are more lagging but more structurally confirmed.
2B Pattern: Focuses on the failure at testing extremes (false breakout followed by quick reversal). Signals are relatively earlier but potentially less robust.
Learning them helps you:
More objectively assess the probability of a trend reversal.
Identify potential high-probability reversal entry points.
Capitalize on failed breakout opportunities (2B).
Provide rationale for exiting positions or adjusting exposure.
For all young traders wanting to catch turning points and improve their trading odds in volatile markets, adding the 1-2-3 and 2B rules to your arsenal will definitely level up your Price Action game!
Remember:
They are pattern rules, not automatic indicators.
Context (Location) and Confirmation are key to success!
No parameter headaches for the rules themselves, but helper tools have them.
Higher timeframes are more reliable.
Best used combined with candles, volume, and other indicators.
Understand the pros and cons and suitable scenarios for each.
Alright! Hope this deep dive into the 1-2-3 and 2B rules helps you out! Start practicing spotting these patterns on your charts, but remember to wait patiently for confirmation! See ya next time! Trade smart, catch the turns!