Alright, all you sharp traders, crypto crew, and fintech explorers! Last time we broke down the high-speed weapon EMA, today we’re going back to basics to decode the ‘granddaddy’ of technical indicators – the SMA (Simple Moving Average). Yo, don’t think ‘simple’ means weak. Nailing the fundamentals is how you stand strong in the market! Lots of pros built their empires on this basic stuff!
What’s the deal with SMA? How’s it different from EMA?
SMA is the most straightforward, classic moving average out there. The calculation is seriously simple: add up the closing prices over the last ‘N’ periods, then divide by N. Done!
For example, a 20-day SMA is the sum of the closing prices for the past 20 days, divided by 20. Every single day’s data gets the exact same weight – totally fair and square.
「Mathematical formula visual: SMA = (P1 + P2 + … + Pn) / n. 」
So, what’s the main difference compared to the EMA we talked about? EMA gives more weight to recent data, making it react faster. SMA treats all data equally, making it react slower but also much smoother.
SMA’s “Origin Story”: Why Does This Line Even Exist?
Think back to the old days before computers and charting software. How did traders figure out the trend? Staring at prices jumping up and down every day made it easy to get faked out by short-term noise. So, someone thought, “What if we average out the prices over a period to see the ‘average cost’ or the general ‘average trend’?” And that’s how SMA was born.
Its core goals were:
- Noise Filtering: Smooth out the short-term price swings so you can see the bigger picture.
- Trend Identification: Figure out if the market is generally heading up, down, or sideways based on the average’s direction.
- Providing a Reference Point: See how the current price relates to the average cost.
Basically, SMA tries to find a relatively stable “center line” amidst the chaos of market data.
SMA Basics (The Must-Knows):
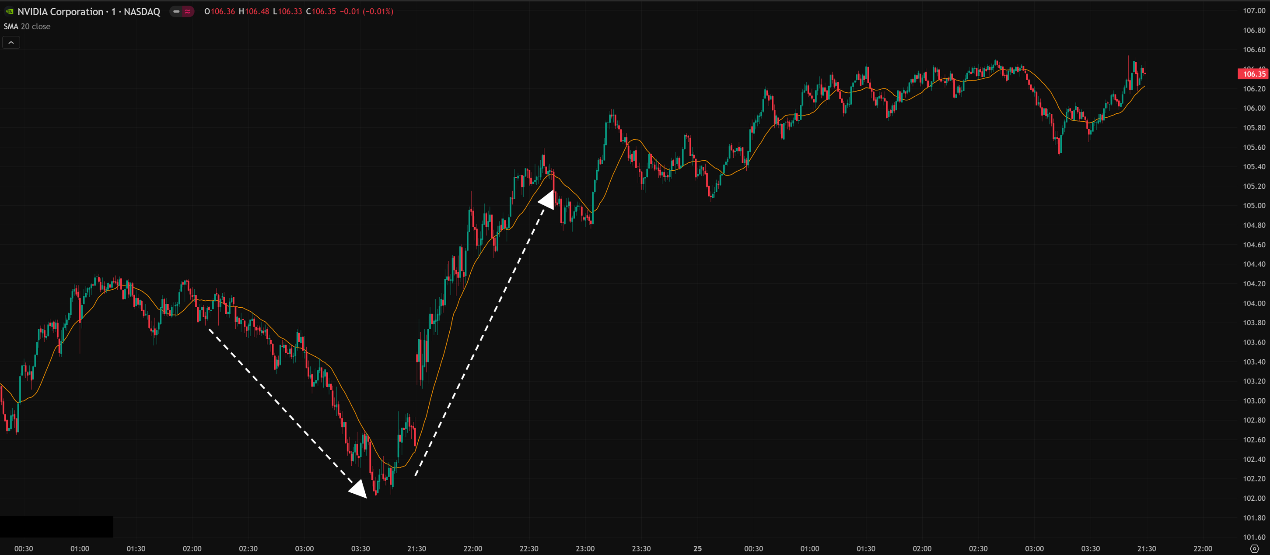
- Spotting the Trend:
-
- SMA sloping up, price usually stays above it → Uptrend.
- SMA sloping down, price usually stays below it → Downtrend.
- SMA going flat → Range-bound / Sideways Market.
- Mindset: Above the line = bullish bias, below the line = bearish bias, flat = wait and see.
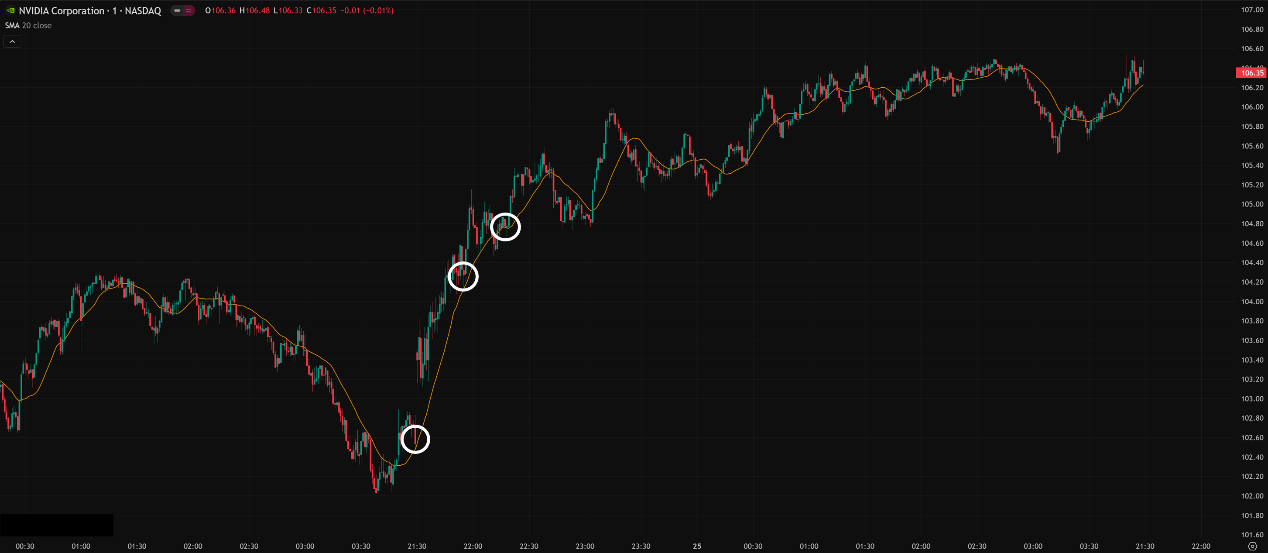
2. Dynamic Support & Resistance:
-
- In an uptrend, when price pulls back to the SMA, the line might act as a “support” level, holding the price up.
-
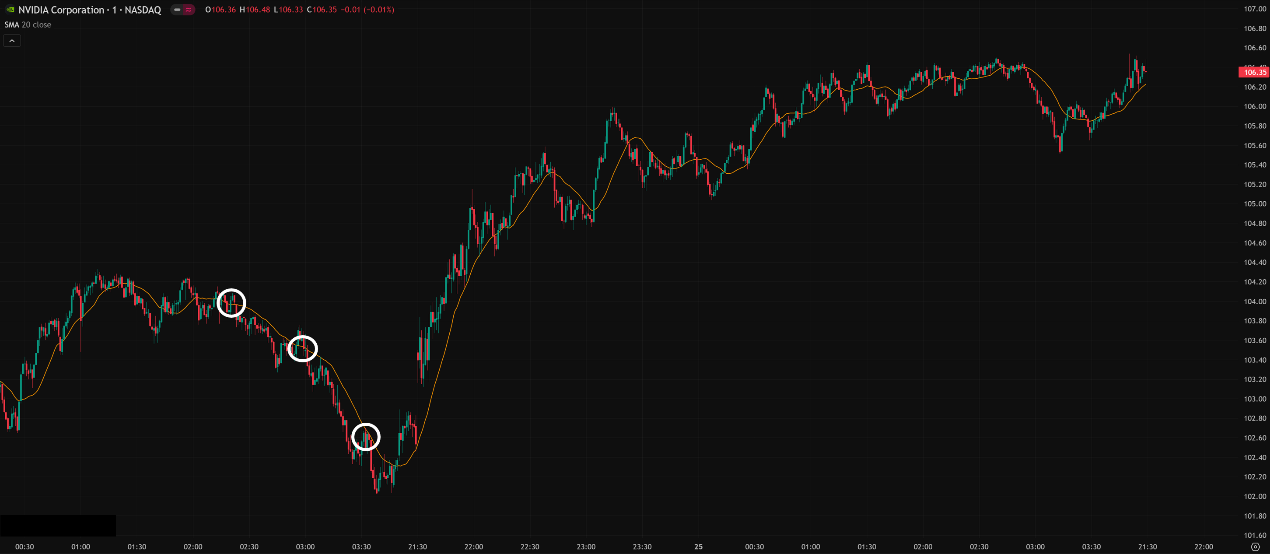
- In a downtrend, when price rallies up to the SMA, the line might act as a “resistance” level, pushing the price down.
-
- Note: SMA’s support/resistance tends to work better in clear trending markets. It often fails in choppy, sideways action.
3. The Classic Crosses (Golden & Death):
-
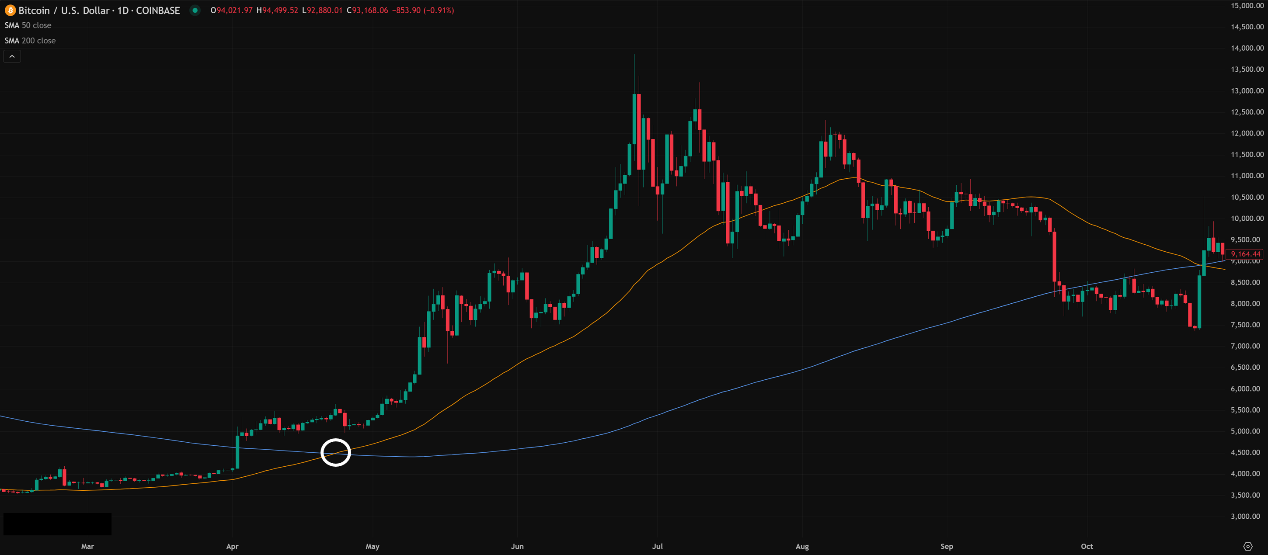
- This is SMA’s most iconic use! Typically uses the 50 SMA and 200 SMA combo (especially on the Daily chart).
- Golden Cross: The shorter-term SMA (50 SMA) crosses UP through the longer-term SMA (200 SMA). Seen as a major signal that a long-term bull market might be starting.
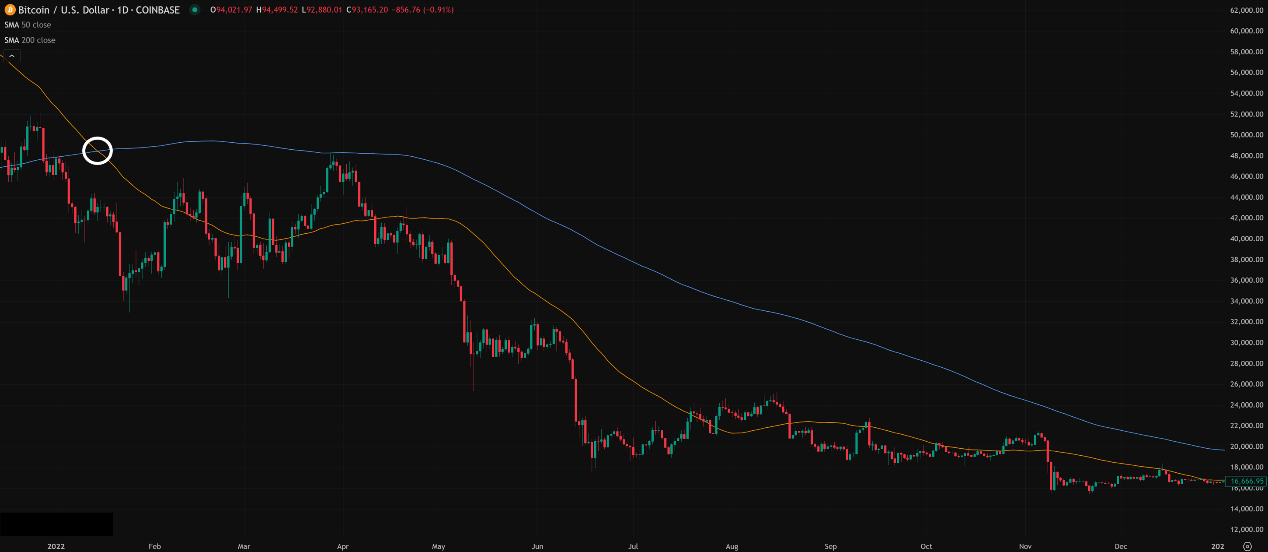
-
- Death Cross: The shorter-term SMA (50 SMA) crosses DOWN through the longer-term SMA (200 SMA). Seen as a major signal that a long-term bear market might be starting.
- Super Important Warning: These crossover signals have SERIOUS LAG! They confirm a trend change well after it’s started, they don’t predict tops or bottoms. In markets like crypto where V-shaped bounces/crashes happen, chasing a cross might be way too late. Plus, you’ll get tons of fake crosses in sideways markets!
Advanced Plays & Decoding Global Trader Parameters (Pro Zone):
SMA might be simple, but using it like a pro comes down to parameters! Different types of traders globally favor different combos based on their market habits and trading styles.
Common Parameter Combos & Logic (Based on Style, Not Just Country!):
- The Short-Term Hit Squad (Day Trading / Scalping):
-
- Common Params: 5, 8, 10, 13, 20, 21 SMA
- Who Uses This? Mostly Day Traders, high-frequency traders, players catching tiny moves. Popular in active US/EU short-term markets and Asian derivatives markets.
- Why Use Them? React relatively faster (though still slower than EMA) for intraday trend bias and entry/exit references. E.g., using a 5 SMA crossing a 20 SMA for a quick signal, or price breaking above/below the 20 SMA for trend-following trades.
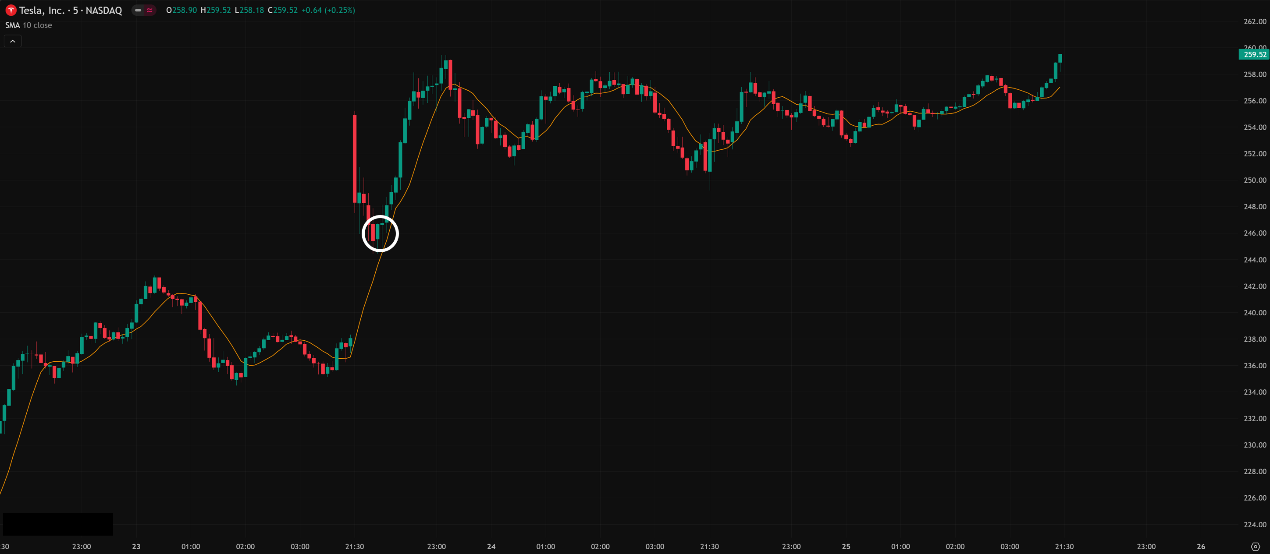
- “Hottest” Effect & How to Use It?
- In clearly trending intraday markets (like the first hour or two after market open), the 10 SMA or 20 SMA works okay as dynamic S/R. Look for price to pull back to the line, then enter on a confirming candlestick pattern (like a Pin Bar or Engulfing).
-
-
- Pitfalls: You’ll get chopped to pieces in ranging markets – tons of fake signals! MUST use with volume confirmation or channel indicators (like Bollinger Bands) to filter.
- Key to Success: Speed! Get in, get out fast, use tight stops. Don’t expect to catch big waves with these short-term SMAs.
2. The Swing Rhythm Crew (Swing Trading / Mid-Term):
-
- Common Params: 50 SMA, 60 SMA (~Quarterly), 100 SMA
- Who Uses This? The vast majority of Swing Traders (holding a few days to weeks) and Position Traders (holding weeks to months). This is the most widely used parameter range globally.
- Why Use Them? The 50 SMA is a crucial mid-term trend reference line watched by many institutions. The 100 SMA offers a longer-term S/R perspective.
- “Hottest” Effect & How to Use It?
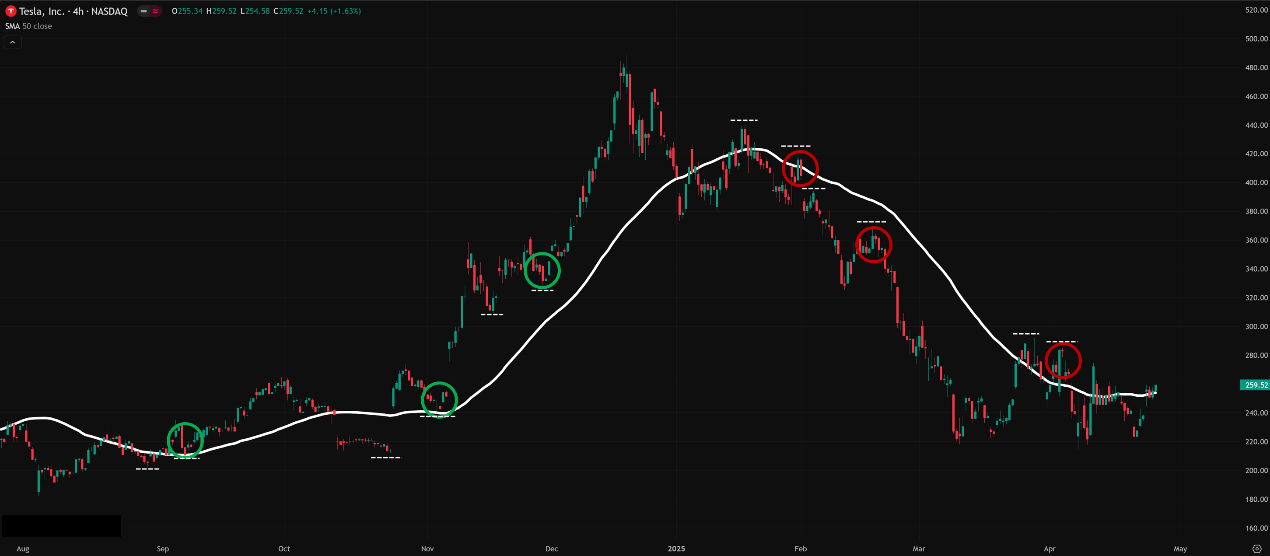
- The 50 SMA is KING here! On Daily or 4-Hour charts, many effective swing trading strategies revolve around the 50 SMA.
-
-
-
- Uptrend: Waiting for price to pull back to the rising 50 SMA and seeing a bullish candlestick pattern (Bullish Pin Bar, Hammer, Bullish Engulfing) is a classic buy setup.
- Downtrend: Waiting for price to rally to the falling 50 SMA and seeing a bearish candlestick pattern (Bearish Pin Bar, Shooting Star, Bearish Engulfing) is a classic sell/short setup.
- Key to Success: TREND CONFLUENCE! Always determine the major trend first using a longer-term MA (like the 200 SMA). Then, only look for pullback opportunities on the 50 SMA in the direction of that major trend. Example: If price is above the 200 SMA (major trend is bullish), only look for buy setups on pullbacks to the 50 SMA.
3. The Long-Term Anchor Crew (Long-Term / Institutional):
-
- Common Params: 200 SMA, 250 SMA (~Annual)
- Who Uses This? Long-term investors, fund managers, institutional players. The 200 SMA is heavily watched across global stock markets, indices, and even Bitcoin.
- Why Use Them? The 200 SMA is widely considered the Bull/Bear Market Line. It represents the average holding cost over roughly the past year.
- “Hottest” Effect & How to Use It?
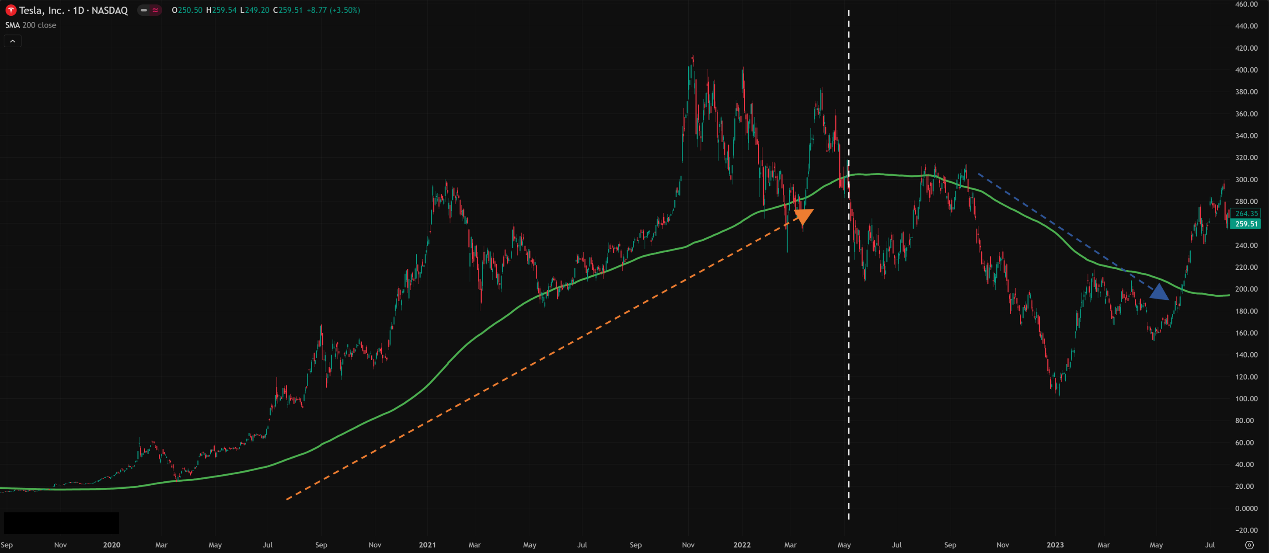
- Judging the Market’s Long-Term Health:
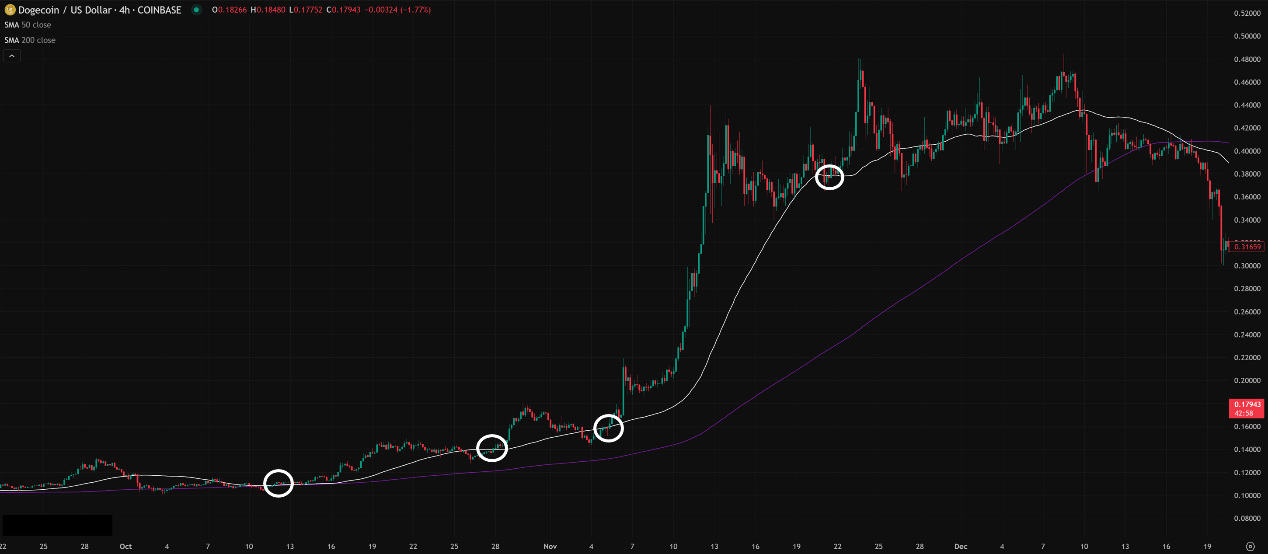
- Price holding firmly above an upward-sloping 200 SMA → Long-term Bull market structure.
- Price breaking down below a downward-sloping 200 SMA → Long-term Bear market structure.
- Ultimate Support/Resistance: In major bull markets, pullbacks to the 200 SMA are often seen as significant buying opportunities (Value Buy Zone). In major bear markets, rallies back to the 200 SMA usually face massive resistance.
- 50/200 SMA Crosses: The Golden/Death crosses mentioned earlier. Primarily used to confirm long-term trend shifts; many long-term funds use these as reference points for asset allocation.
- Key to Success: TIMEFRAME! The 200 SMA’s power is most evident on Daily and Weekly charts. It’s almost meaningless on very short timeframes (like minute charts). Also, its lag is extreme – don’t use it for short-term trading decisions.
「The 200 SMA: The Ultimate Litmus Test for the Long-Term Trend. Know Which Side You’re On」
Decoding Summary: Which Combo is Hottest? How to Use It Effectively?
Honestly, there’s no single “hottest” combo. There’s only the combo best suited for YOUR trading style and the CURRENT market condition!
- If you’re a Scalper/Day Trader: The 10/20 SMA combo might work, but demands strict discipline, use with other tools, and only in clearly trending sessions.
- If you’re a Swing Trader: The 50 SMA + 200 SMA (on Daily/4H charts) is absolutely ESSENTIAL to study! Use the 200 SMA to define the major trend, then use the 50 SMA to find high-probability pullback entries with that trend. This combo has stood the test of time globally.
- If you’re a Long-Term Investor / Big Picture Viewer: The 200 SMA on the Daily/Weekly chart is your North Star! Combine it with the 50 SMA to gauge the mid-term trend and watch for those major Golden/Death crosses.
How to Use SMA Effectively:
- Acknowledge the Lag: SMA is a lagging indicator, not predictive. Don’t expect it to catch exact tops or bottoms.
- Look at the Slope: The direction the SMA is pointing (up, down, flat) is often more important than just whether the price is above or below it.
- Multiple Time Frame Analysis: Use longer timeframe SMAs for direction, shorter timeframe SMAs for potential entries.
- Combine with Price Action & Patterns: A price touch of the SMA + a reversal candlestick (Pin Bar, Engulfing) or chart pattern (Double Bottom, Head & Shoulders) is a much stronger signal.
- Never Use in Isolation: ALWAYS combine with other tools like Volume, RSI, MACD, trendlines, etc., for confirmation!
- Beware of Ranging Markets: SMAs will whip you around mercilessly in sideways chop, giving constant fake signals. You might need to switch to oscillators or channel indicators then.
- Backtest Relentlessly! For your specific market, asset, and timeframe, you MUST test which parameters have performed best historically!

Default Parameters & The “Best” for All Timeframes?
- Defaults: Many platforms default to 9 or 10 SMA (short), 20 or 21 SMA (mid-short), 50 SMA (medium), 200 SMA (long).
- The “Best” Parameters? Let me repeat: DOESN’T EXIST! The optimal parameters change based on the timeframe, market volatility, and your strategy.
- Hyper Short-Term (Scalping, 1m/5m): Maybe 5, 8, 13 SMA.
- Intraday (Day Trade, 15m/1h): Combos like 10, 20, 50 SMA.
- Swing (4h/Daily): Combos like 20, 50, 100, 200 SMA.
- Long Term (Weekly/Monthly): Combos like 50, 100, 200 SMA.
- Remember: These are just common starting points. You absolutely need to test and find what works best for you!
Bottom Line: SMA is Your Anchor, Not a Crystal Ball!
SMA is a cornerstone of technical analysis. It’s simple but powerful, especially for identifying trends and finding mid-to-long-term opportunities. Its smoothness helps filter out market noise so you can see the bigger picture.
However:
- It’s Slow: Don’t get mad at its lag; that’s its nature.
- Ranges are its Kryptonite: Know when to ignore it in sideways markets.
- Combos are Key: Using multiple SMAs together and with other indicators is the pro way.
- Risk Management + Backtesting are ALWAYS VIP!

Hope this deep dive into SMA and global parameter breakdown helps you master this classic tool! Get on your charts, experiment with different combinations, and feel their rhythm!
Next Steps:
- Add the 50 SMA and 200 SMA to your Daily charts and see how they define trends.
- Look for trend-following pullback opportunities using the 50 SMA on the 4-Hour chart.
- Backtest different SMA parameters on the asset and timeframe you trade.
- Keep Practicing, Keep Testing, Keep Winning! Good luck with your trades!🤙📈