Okay, all you awesome traders, Crypto warriors, and future stars of the financial markets! Wanna gear up with a super radar that helps you see through the market’s “energy” and “direction”? Today, we’re diving deep into a seriously powerful indicator – the DMI (Directional Movement Index)! It doesn’t just tell you if it’s going up or down; it tells you how strong that move is! Nail this, and you won’t waste your ammo firing blanks in weak, choppy markets!
What the heck is DMI? Why is it a Big Deal?
DMI is another masterpiece from the technical analysis legend J. Welles Wilder Jr. (Yep, him again! The genius behind RSI, ATR, and Parabolic SAR!). His goal was to create a system that could quantify trend strength and identify trend direction.
DMI isn’t just one line; it usually consists of three lines (some versions add the ADXR):
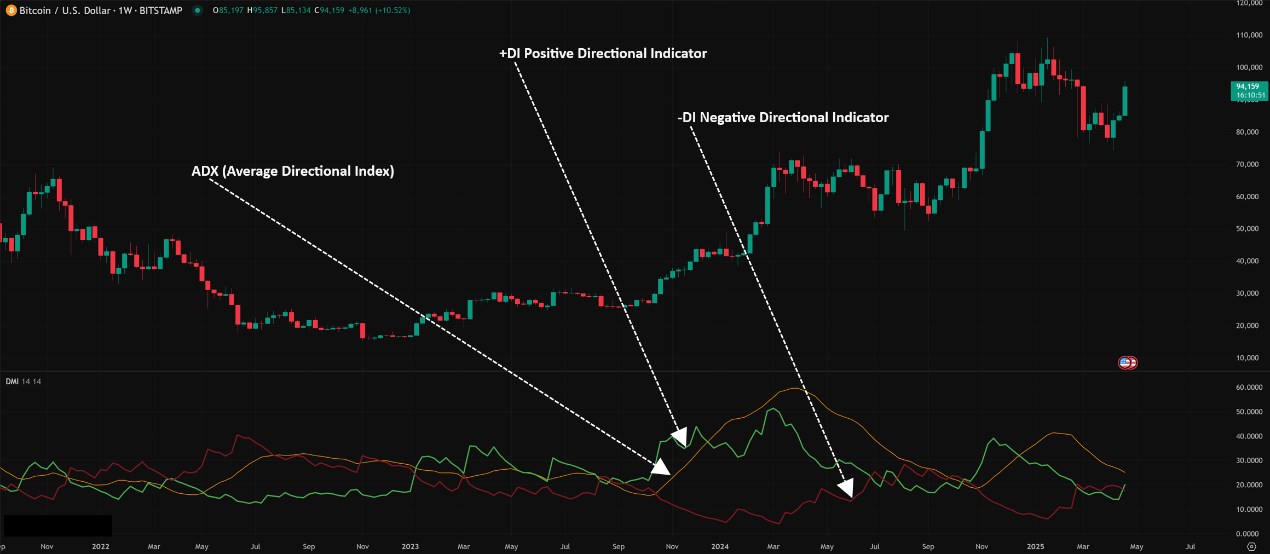
- +DI (Positive Directional Indicator): The green line. Represents how strong the upward buying pressure is. The higher the line, the more aggressive the buyers.
- -DI (Negative Directional Indicator): The red line. Represents how strong the downward selling pressure is. The higher the line, the more aggressive the sellers.
- ADX (Average Directional Index): Usually white or yellow. This line is the soul of the DMI! It doesn’t tell you direction (up or down); it tells you how strong the trend is (Trend Strength)! Whether it’s an uptrend or downtrend, if ADX is climbing, the trend is getting stronger. If ADX is falling, the trend is weakening or entering consolidation.
「DMI Structure: +DI (Buying Power), -DI (Selling Power), ADX (Trend Strength)」
Why is it so important? Because many indicators only show direction but don’t tell you if the move has any real power behind it. DMI’s ADX solves this, helping you filter out fakeouts and focus on trends with actual momentum!
DMI’s Origin Story & Design: How’s it Calculated?
Wilder realized just looking at price changes wasn’t enough. What mattered was how much the current price range moved in the “favorable direction” compared to the previous range.
Conceptual Flow (No need to memorize formulas):
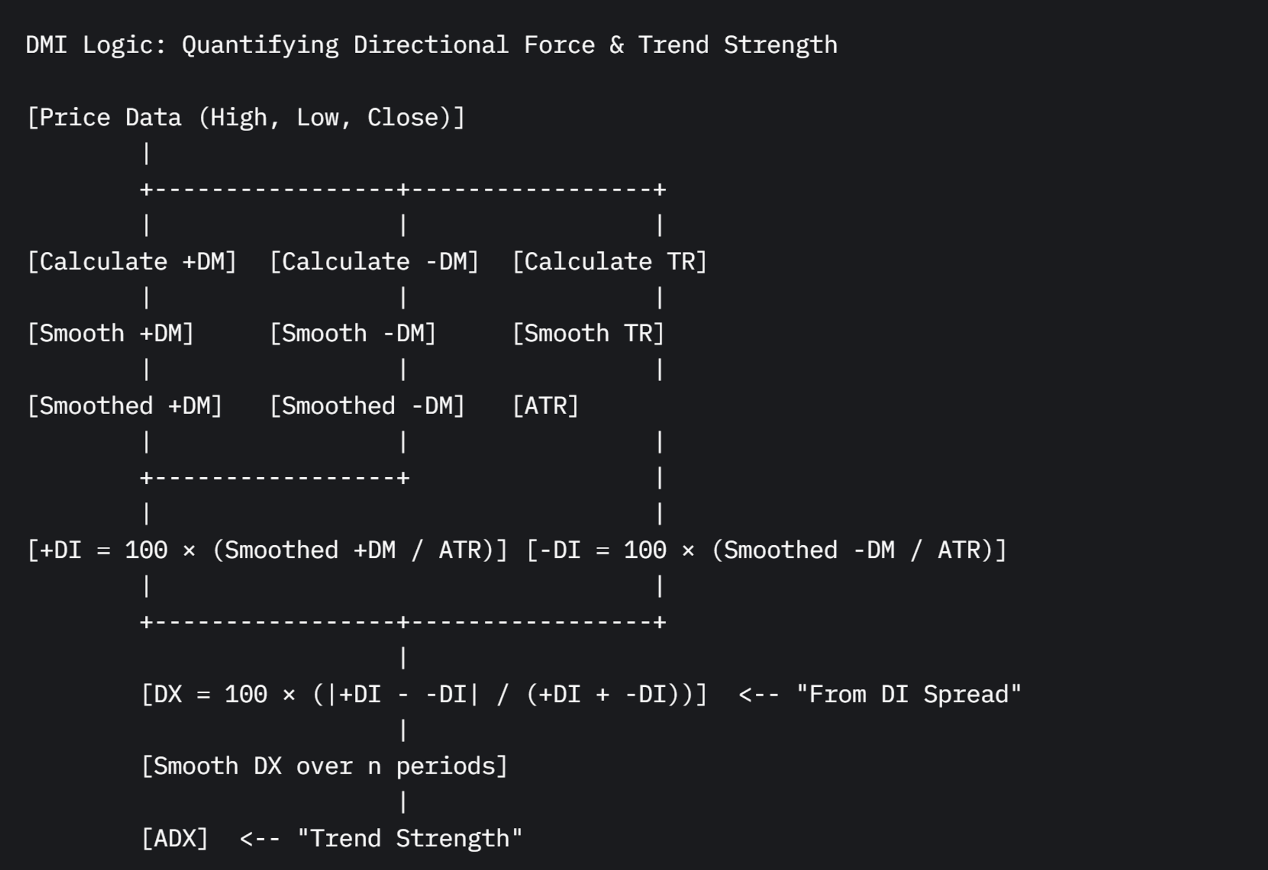
- Calculate Directional Movement (+DM, -DM):
- If today’s high > yesterday’s high, AND that rise is greater than the fall from today’s low compared to yesterday’s low, you get +DM (positive movement).
- If today’s low < yesterday’s low, AND that drop is greater than the rise from today’s high compared to yesterday’s high, you get -DM (negative movement).
- If today’s range is completely inside yesterday’s, or makes both higher highs and lower lows but the moves are equal, DM is 0.
- Incorporate Volatility (ATR): To make DM comparable across different assets and prices, Wilder used his other invention, ATR (Average True Range), to normalize the DM values.
- Calculate +DI / -DI: The smoothed +DM / -DM over a period (usually 14) is divided by the smoothed ATR over the same period, then multiplied by 100. This gives you the +DI and -DI lines, showing the percentage of buying/selling pressure relative to the overall volatility.
- Calculate ADX (The Soul Step):
- First, find the absolute difference between +DI and -DI (| +DI – (-DI) |).
- Then, find the sum of +DI and -DI (+DI + (-DI)).
- Divide the difference by the sum to get the DX (Directional Index). DX shows the proportion of directional strength relative to total strength.
- Finally, apply another moving average (usually 14-period) to the DX values to get the smooth ADX line. The higher the ADX, the bigger the gap between +DI and -DI, meaning a stronger, more directional trend!
「DMI Logic: Quantifying Directional Force & Trend Strength」
DMI Basic Plays (Newbie Essentials):
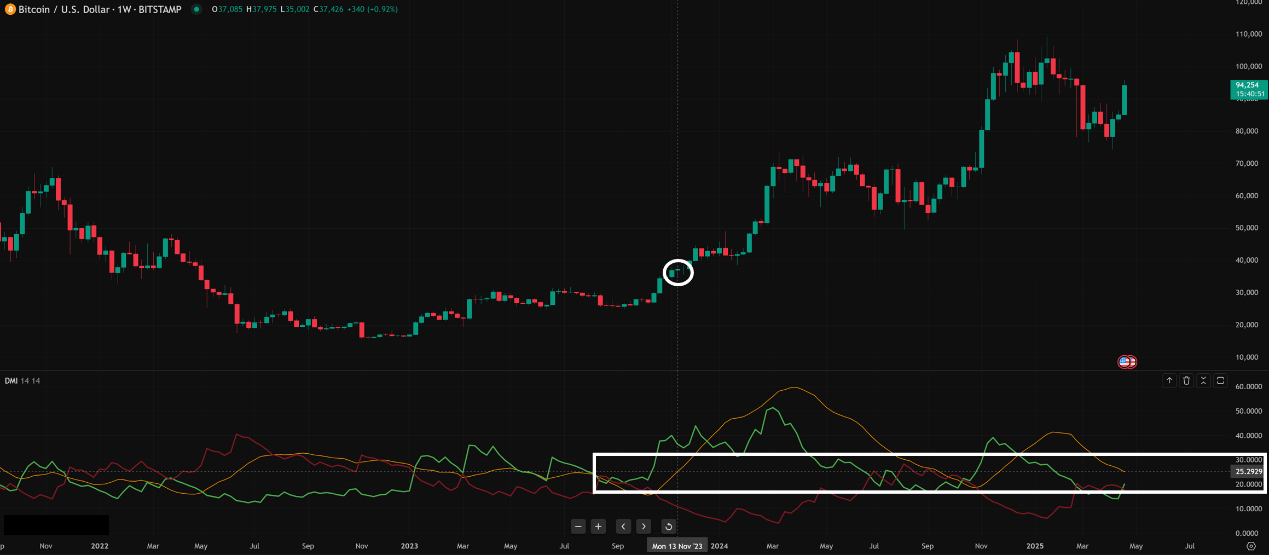
- Use ADX to Judge Market State:
- ADX > 25 (some use 20 or 23): Indicates the market is in a Trending State. The higher the value, the stronger the trend. Trend-following strategies (like MA Crossovers, Supertrend) work better now.
- ADX < 25 (or 20): Indicates the market is Ranging / Sideways / Trendless. The trend is weak or nonexistent. Trend strategies are likely to fail here; consider oscillators (like RSI, Stochastics) or range-trading strategies.
- ADX Rising: Trend is strengthening (could be up or down).
- ADX Falling: Trend is weakening (might enter a range or prepare for reversal).
「ADX Key Level: Separating Trend from Chop」
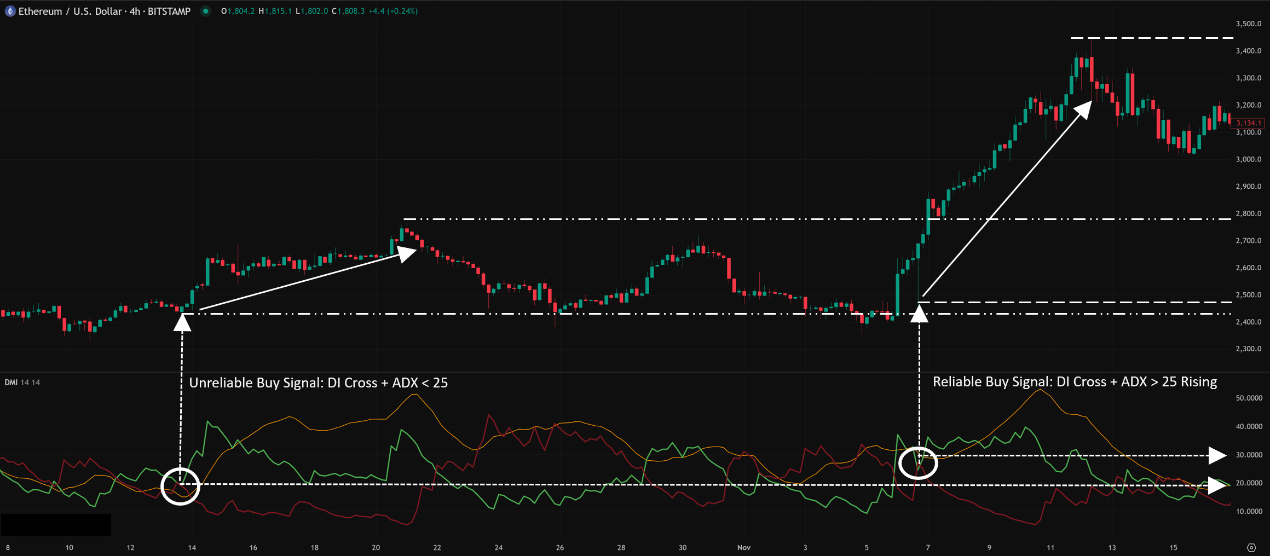
2. Use DI Crosses for Direction (ONLY with ADX Confirmation!):
-
- +DI (Green) crosses ABOVE -DI (Red): Potential Buy Setup.
- -DI (Red) crosses ABOVE +DI (Green): Potential Sell/Short Setup.
- CRUCIAL CAVEAT: DI crossover signals are much more reliable ONLY when ADX is > 25 (or 20)! If a DI cross happens while ADX is low (<25), it’s usually a false signal – just random noise in a choppy market. Ignore it!
「DI Cross + ADX Confirmation = High-Probability Trade」
DMI Advanced Plays & Parameter/Timeframe Breakdown (Level Up!):
DMI seems simple, but pro usage requires understanding parameters and timeframes.
Core Parameters:
- DI Length / ADX Smoothing: How many periods used for calculating +DI, -DI, and smoothing ADX. The almost universally accepted default is 14.
- Shorter Period (e.g., 7, 10): +DI, -DI, ADX react faster, more sensitive to short-term price changes.
- Pros: Might catch trend starts/ends earlier.
- Cons: Lines are choppier, more false signals, ADX might drop below 25 more easily, making you exit trends prematurely.
- Longer Period (e.g., 20, 25): +DI, -DI, ADX are smoother, less sensitive to short-term noise.
- Pros: Filters more false signals, ADX reading is more stable, better reflects longer-term trend strength.
- Cons: Lagging reaction, DI crosses and ADX turns happen much later, potentially missing the beginning of trends.
Parameter Settings Analysis & “Hottest” Combo Discussion:
- Global Consensus: Default 14 is KING!
- Wilder himself used 14. Decades of market testing have proven 14 to be an excellent balance point for capturing mid-term trend strength.
- Vast majority of trading platforms, charting software, and even academic studies use 14 as the default and benchmark.
- Bottom Line: For DMI (especially ADX), unless you have extremely compelling reasons and massive backtesting data, strongly stick with the 14 period. Randomly changing it is more likely to hurt than help. Focus your optimization energy on combining DMI with other tools and understanding market context.
- “Unique” Combos? Not Really!
- Unlike Supertrend or SAR, there’s much less discussion about “unique” DMI parameters. Everyone heavily relies on Wilder’s standard.
- Instead of changing parameters, consider fine-tuning the ADX threshold level:
- High Volatility Markets (Crypto): Might need to raise the ADX threshold to 25 or even 30 to confirm a trend, filtering out more chop.
- Low Volatility Markets (Certain Forex Pairs): Might consider using 20 as the threshold.
- Note: Any threshold adjustment needs backtesting validation!
Timeframe Analysis:
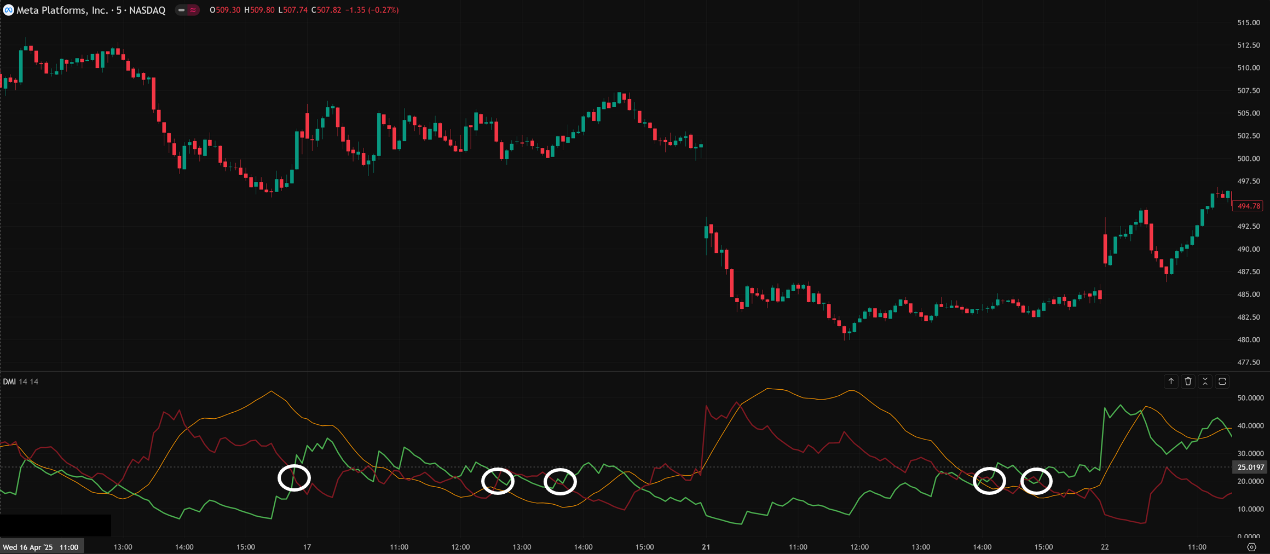
- Ultra Short-Term (M1, M5, M15):
- Performs poorly! On these timeframes, price is mostly noise. ADX struggles to get and stay above 25 consistently. DI lines cross frequently, but without ADX confirmation, it’s meaningless. You’ll see ADX hovering at low levels or rapidly spiking above/below 25, making judgment nearly impossible.
- Conclusion: DMI (especially ADX) has very low value on these short timeframes for gauging trend strength.
「DMI on 5-Minute Chart: ADX Often Too Low」
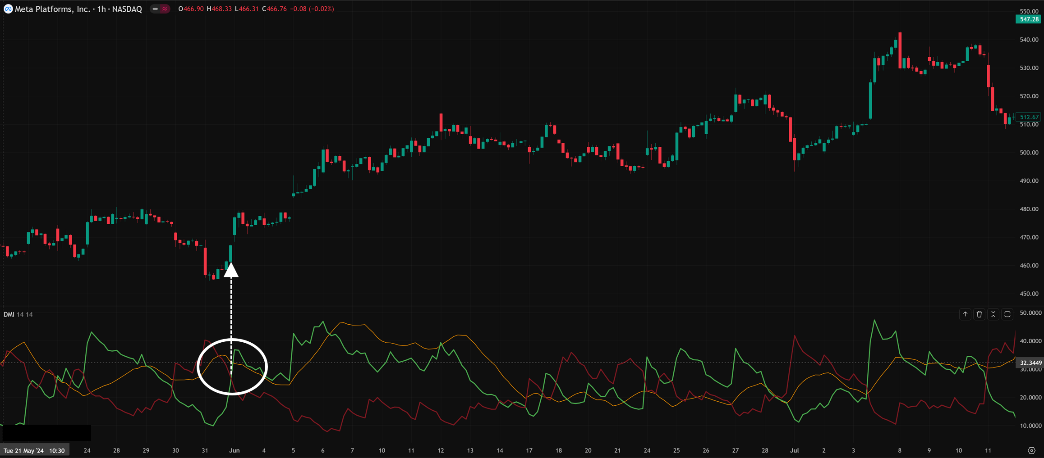
- Intraday / Short Swing (H1, H4):
- Starts becoming useful! These timeframes begin to show clearer intraday or multi-day trends.
- How to Use:
- Use ADX (14) to determine if the market is trending (ADX > 25) or ranging (ADX < 25).
- If ADX > 25 and rising, look for entry opportunities in the direction of the DI cross (e.g., +DI crosses above -DI, consider longs).
- If ADX starts falling from high levels, even if DI hasn’t crossed back, be cautious of weakening trend momentum. Consider tightening stops or taking partial profits.
- Key: Still needs confirmation from other indicators (e.g., MAs, S/R)
「DMI on 1-Hour Chart: Identifying Intraday Trends」
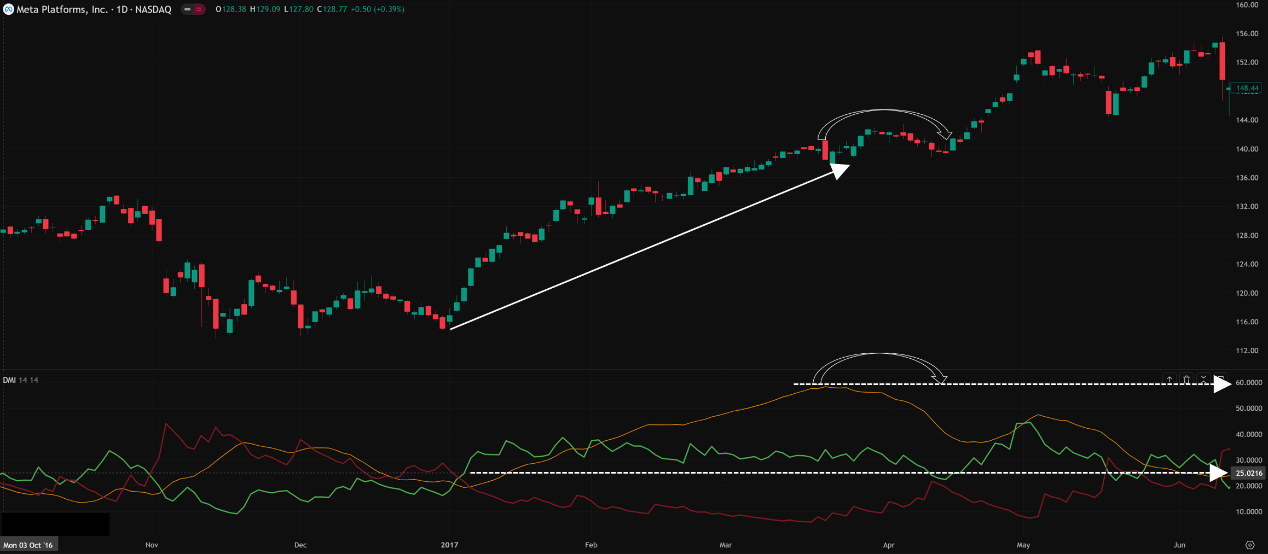
- Swing / Long-Term (Daily, Weekly):
- DMI’s Sweet Spot! On these longer timeframes, trends are more sustained, noise is reduced, and DMI (especially ADX) truly shines in its ability to quantify trend strength.
- Golden Usage:
- Major Trend Confirmation: ADX (14) > 25 and rising confirms a strong underlying trend.
- Filtering Trade Signals:
- ADX > 25 rising, +DI > -DI → Strong uptrend, focus on long setups.
- ADX > 25 rising, -DI > +DI → Strong downtrend, focus on short setups.
- ADX < 25 → Ranging market, avoid trend trades or switch strategies.
- ADX Extremes/Turns: When ADX reaches very high levels (e.g., 50, 60+) and then starts turning down, it might suggest the trend is overextended and due for exhaustion, a significant pullback, or consolidation (Note: Not a reversal signal itself, just weakening strength).
「DMI on Daily Chart: Gauging Major Trend Strength & Exhaustion」
Summary: Which Parameter Combo + Timeframe is Hottest & Most Effective? How to Use It?
- Parameters: Stick with 14! Don’t mess with it unless you have solid proof.
- Timeframe: H4 / Daily / Weekly are most reliable. H1 is usable. M15 and below are generally unreliable for DMI’s core purpose.
- Hottest / Most Effective Usage:
- ADX is KING! Always look at ADX FIRST! Use ADX > 25 (or your tested threshold) to decide if you should be using trend strategies or range strategies.
- ONLY AFTER confirming a trend (ADX > 25 & rising), use DI crosses to help determine direction, OR use the dominant DI line (+DI > -DI = bullish bias; -DI > +DI = bearish bias) to filter entry signals from your other strategies.
- Combine with Long-Term MAs (e.g., 50/200 SMA/EMA) for major direction filtering: E.g., Price > 200MA + ADX > 25 rising + +DI > -DI → Strong confluence for bullish bias.
- ADX falling from high levels is a WARNING: Signals weakening momentum, be cautious.
DMI Advanced Tips (Bonus Points):
- ADX Bounces off Threshold? If ADX dips near 25 but doesn’t break below, and instead turns back up while DI makes a favorable cross, it could be a strong signal of a trend resuming after a brief pause.
- Divergence (Less Common, Use with Caution): Some try to find divergence between price and ADX (e.g., price makes a new high, but ADX fails to make a new high) as a sign of weakening trend. However, ADX primarily measures strength, not momentum in the same way RSI/MACD do, so ADX divergence is often less reliable.
Bottom Line: DMI is Your Trend “Strength Meter” – Don’t Trade Without Its Confirmation!
DMI, especially the ADX line, is a critically important indicator because it gives us an objective way to measure trend strength. Its value lies in:
- Distinguishing trending from ranging markets.
- Confirming the validity of DI cross signals.
- Alerting to changes in trend momentum.
But always remember its limitations:
- Lagging: ADX needs time to process data, reacting slower than price.
- Useless in Ranges: When ADX is low, DI crosses are meaningless noise.
- Not a Standalone Entry System: DMI is mainly for confirmation and filtering, not generating entry points on its own.
- Standard Parameters Work Best: Sticking to the 14 period is usually the optimal choice.
「DMI Dashboard: Judging Market State, Choosing Strategy」
Hope this deep dive into DMI helps you master this powerful trend strength analysis tool! Add it to your workflow and learn to use ADX as your gatekeeper!
Next Steps:
- Add DMI (using default 14 parameters) to your H1, H4, and Daily charts.
- Observe how the ADX line behaves differently in trending vs. ranging markets, paying attention to the 25 level.
- Compare DI crosses that happen when ADX > 25 versus those that happen when ADX < 25.
- Practice using ADX > 25 as a filter for your existing trading strategies.
- Backtest! Backtest! Backtest! Validate if the ADX threshold needs slight adjustments for your specific market.
May you accurately gauge trend strength and ride the powerful waves!💪🌊