Alright, all you Speed Demon Traders, Crypto rocketeers, and friends seeking the “Warp Drive” in technical analysis! Today, we’re unlocking a “supercar” in the Moving Average (MA) universe – the HMA (Hull Moving Average)! Sounds badass? Damn right, because its design goal is to achieve extreme smoothness while also having lightning-fast responsiveness, aiming to K.O. the biggest enemy of MAs – Lag!
What the heck is HMA? How’s it different from other MAs?
HMA was invented in 2005 by an Australian trader and mathematician named Alan Hull. He was seriously frustrated with the lag of traditional MAs, especially when quick reactions are needed. His goal was clear: create a moving average that’s super responsive but doesn’t suffer from the excessive choppiness (whipsaws) of simple short-period MAs.
Think of the MA family:
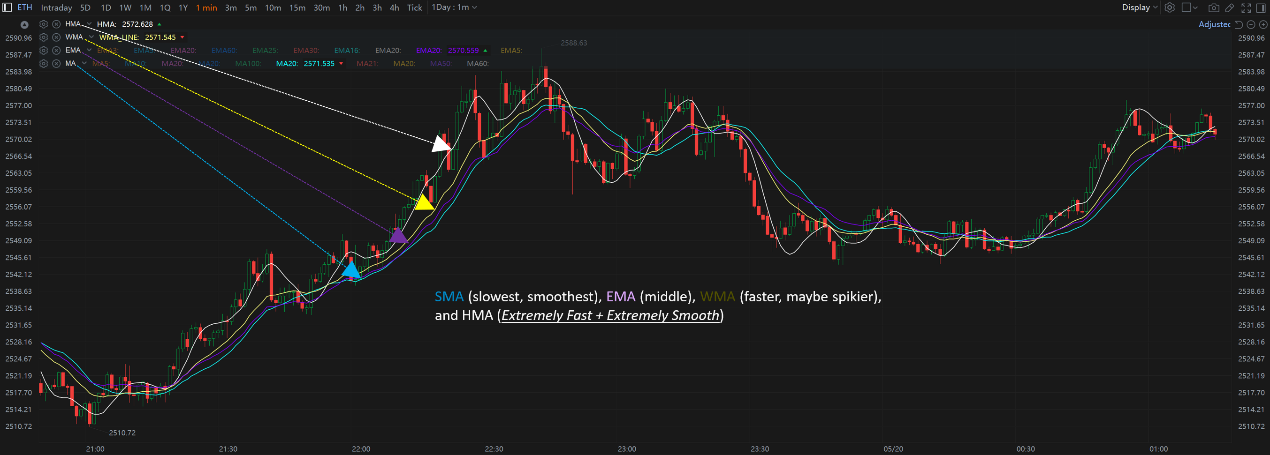
- SMA (The Grandpa): Steady, but slow enough to make you wait forever.
- EMA (The Cool Kid): Faster, but the acceleration can sometimes be jerky (not perfectly smooth).
- WMA (The Specialist): Also fast, linear acceleration, but maybe not as well-rounded as EMA.
- HMA (The Supercar): Aims to be both FAST and SMOOTH! Its line typically hugs the price very closely, turns quickly, yet maintains surprising smoothness.
「MA Ultimate Showdown? HMA’s Speed & Style」
HMA’s Design: How is it So Fast & Smooth? (Alan Hull’s Genius!)
HMA’s secret sauce lies in its unique calculation method. It doesn’t just apply simple weighting. It uses a clever trick to cancel out lag:
The 3-Step Concept (Grasp the logic, not the exact formula):
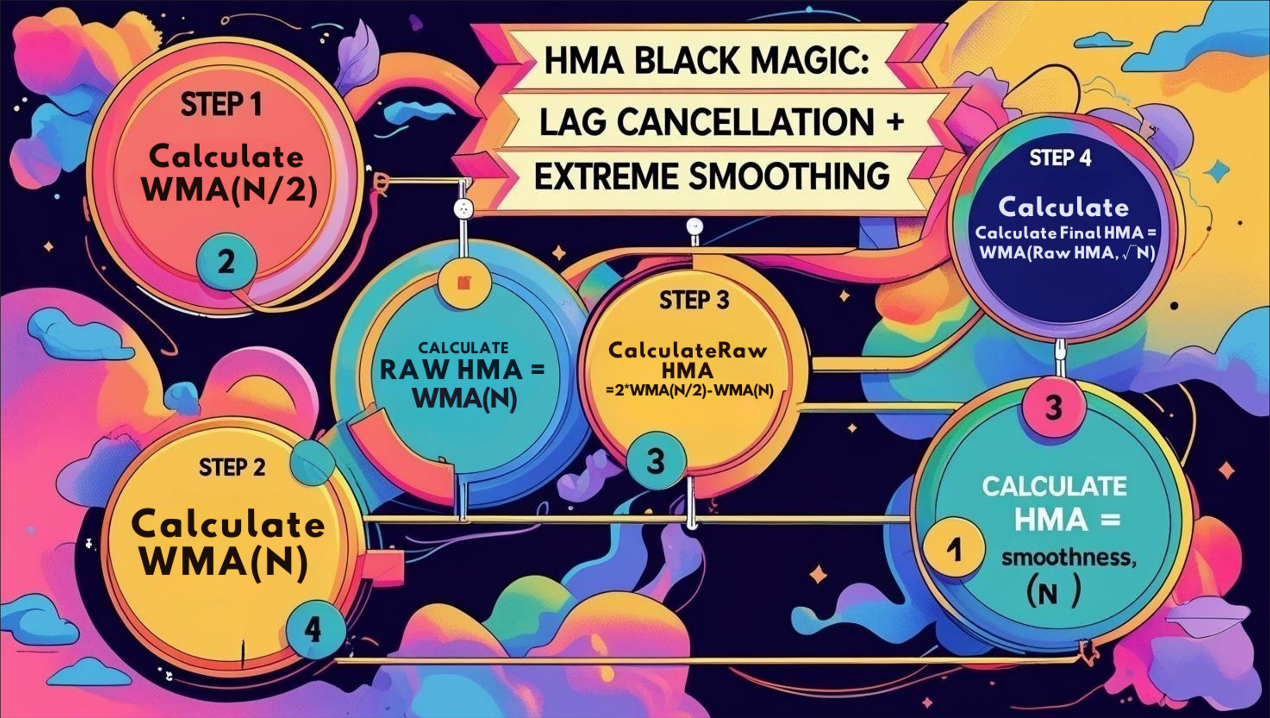
- Step 1: Calculate a WMA with half the period. If you want a 20-period HMA (N=20), first calculate a 10-period (N/2) WMA. WMA1 = WMA(Price, N/2)
- Step 2: Calculate a WMA with the full period. Then calculate a 20-period (N) WMA. WMA2 = WMA(Price, N)
- Step 3: The Magic! Use “Fast minus Slow” to accelerate, then smooth again!
-
- First, calculate (2 * WMA1) – WMA2. The goal here is to amplify the impact of recent prices and offset some of the inherent lag of the WMAs. Think of it as calculating a raw difference with a “predictive” component.
- But this raw difference can be jerky. So, Alan Hull applies one more WMA smoothing to this difference, using a period equal to the square root of N (√N) (e.g., for N=20, √20 ≈ 4.47, typically rounded to 4 or 5).
- HMA = WMA( (2 * WMA1) – WMA2, √N )
In Simple Terms: It uses WMA twice, combines them in a specific way to pre-calculate and subtract the inherent MA lag, and then “polishes” the result smooth with a very short-period WMA. The outcome? A line that reacts incredibly fast but looks remarkably smooth!
「HMA Black Magic: Lag Cancellation + Extreme Smoothing」
HMA Basic Plays (Beginner Quick Tips):
Because HMA is so fast and smooth, its basic usage is more direct than other MAs, but also requires more caution!
- Read the Direction (Ultra-Clear Trend Direction):
- HMA consistently pointing UP → Strong bullish bias.
- HMA consistently pointing DOWN → Strong bearish bias.
- HMA Flat → Rare, usually signals extreme consolidation or a fleeting moment of trend change. Its smoothness makes it rarely stay flat for long.
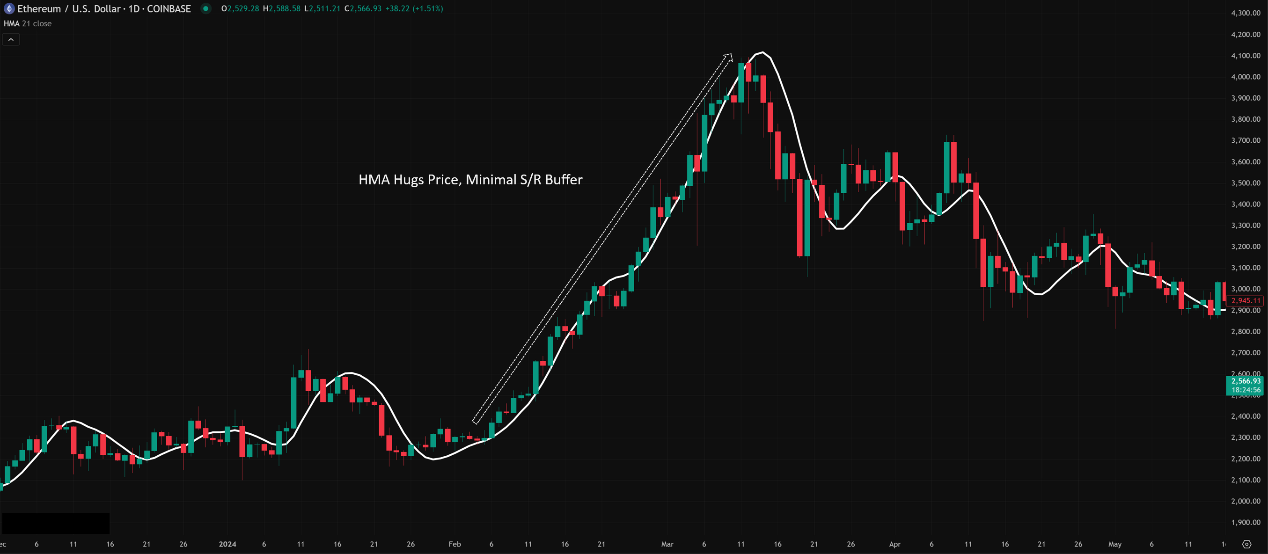
- Dynamic Support & Resistance (Dynamic S/R – Be Extra Careful!):
- Theoretically, price pulling back to the HMA in an uptrend might find support, and rallying to it in a downtrend might find resistance.
- BUT! Because HMA hugs price so closely, the buffer zone for S/R is tiny! Price can easily slice through it. So, NEVER blindly enter/exit just because price “touches” the HMA. It’s more indicative of whether the immediate momentum has shifted.
「HMA Support/Resistance: More Like a Trend Boundary」
3. Slope/Color Change as Signal (Super-Fast Alert!):
-
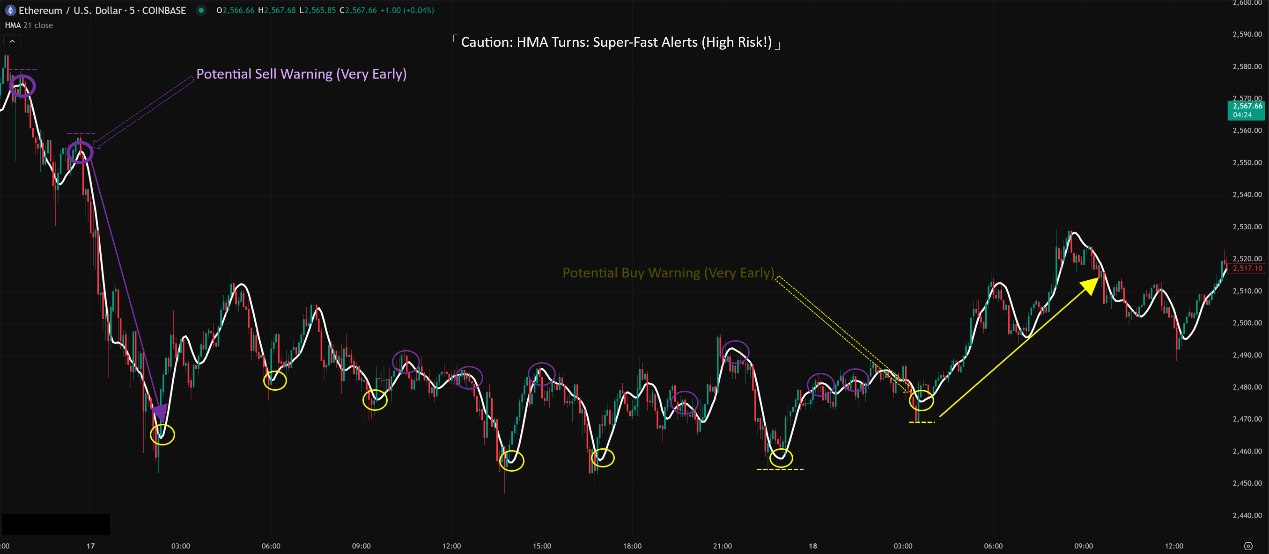
- HMA turns from rising to falling (slope change) → Very early potential sell/exit long warning.
- HMA turns from falling to rising (slope change) → Very early potential buy/exit short warning.
- Many platforms color the HMA (green for up, red for down). The color change is the most direct visual cue.
- Biggest Trap: Because it’s so fast, HMA can overreact to price fakeouts and noise, leading to tons of false turn signals! Especially in ranging markets!
「HMA Turns: Super-Fast Alerts (High Risk!)」
HMA Advanced Plays & Parameter/Timeframe Breakdown (Pro Strategy Vault):
HMA’s uniqueness makes its advanced usage quite different from other MAs.
Core Parameter: Period (N)
- HMA has only one standard parameter: Period N.
- Impact of Changing N:
- Smaller N (e.g., 9, 14): HMA reacts faster, stays closer to price, turns sharper. But also more sensitive to noise, higher risk of false signals.
- Larger N (e.g., 21, 50, 55): HMA is smoother. Still much faster than EMA/SMA of the same period, but relatively slower than a shorter HMA. Filters short-term volatility better, better for catching slightly longer moves.
- Default Parameters: No single universal default, but common ones include 14, 16, 20, 21, 55. Many platforms might default to 20 or 21.
Parameter Settings Analysis & “Hottest” Combo Discussion:
- The “Fast” vs. “Smooth” Trade-off: Choosing HMA parameters is about balancing “lightning-fast reaction” against “relative smoothness (fewer false signals).”
- Common “Unique” Combo Ideas & Usage:
- The Speed Demon Crew (N ≈ 9-16):
- Goal: Seek the fastest possible trend shift signals, perhaps for short-term momentum plays or as a fast filter for other indicators.
- How to Use (High Risk!):
- HMA(9) or HMA(14) turn + Requires very strong confirmation from other sources (e.g., key S/R break + huge volume + RSI momentum confirmation).
- Use HMA(9) as an ultra-short-term trendline; significant price deviation from it might indicate short-term overbought/oversold conditions.
- “Hottest” Effect? In very strong, accelerating trends, a short-period HMA can provide incredibly tight guidance. But in any other condition (especially ranges), it’s a nightmare.
- The Balanced Utility Crew (N ≈ 20-30):
- Goal: This range is probably the most experimented with. Tries to maintain HMA’s responsiveness while adding a bit more smoothness to filter some noise. HMA(21) is a popular choice.
- How to Use:
- HMA(21) turn serves as a major warning signal, then seek confirmation from price action or other indicators.
- Use HMA(21) as the primary gauge of short-term trend. Price consistently staying above/below HMA(21) suggests trend continuation.
- Could try two HMA crossovers (e.g., HMA(10) vs. HMA(21)), but false signal risk remains; needs confirmation like ADX for trend strength.
- “Hottest” Effect? For intraday or short swing trading, if the market has direction, HMA(21) can offer faster and smoother trend guidance and exit references than EMA(21).
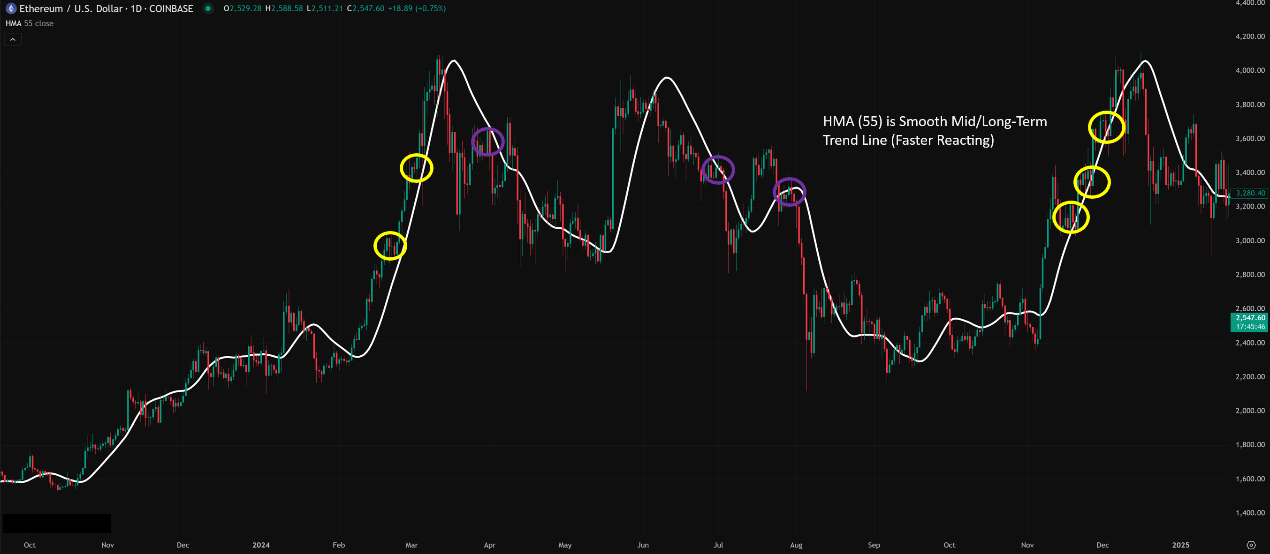
- The Smooth Trend Rider Crew (N ≈ 50-55 or longer):
- Goal: Leverage HMA’s smoothness for mid-to-long-term trend following, while still reacting faster than SMA/EMA of the same period. HMA(55) is a classic example.
- How to Use:
- Use HMA(55) as the main trend direction line. Price above HMA(55) = overall bullish; below = overall bearish.
- Look for trend-following opportunities when price pulls back/rallies towards the HMA(55) (since it’s slower, price has a chance to reach it), combined with candlestick or other confirmation.
- Monitor the slope change of HMA(55) to gauge trend strength.
- “Hottest” Effect? On Daily or Weekly charts, HMA(55) can act as a faster-reacting, closer-fitting mid-to-long-term trendline than EMA(50) or SMA(50), while maintaining excellent smoothness.
「Longer Period HMA: A New Trend Following Option?」
Timeframe Analysis:
- Ultra Short-Term (M1, M5):
- Extremely Dangerous! While designed to be fast, HMA’s speed becomes its fatal flaw on these noisy timeframes, leading to insane amounts of false signals. Even longer-period HMAs won’t help much here.
- Conclusion: Strongly advise against using HMA for primary decisions on M1/M5.
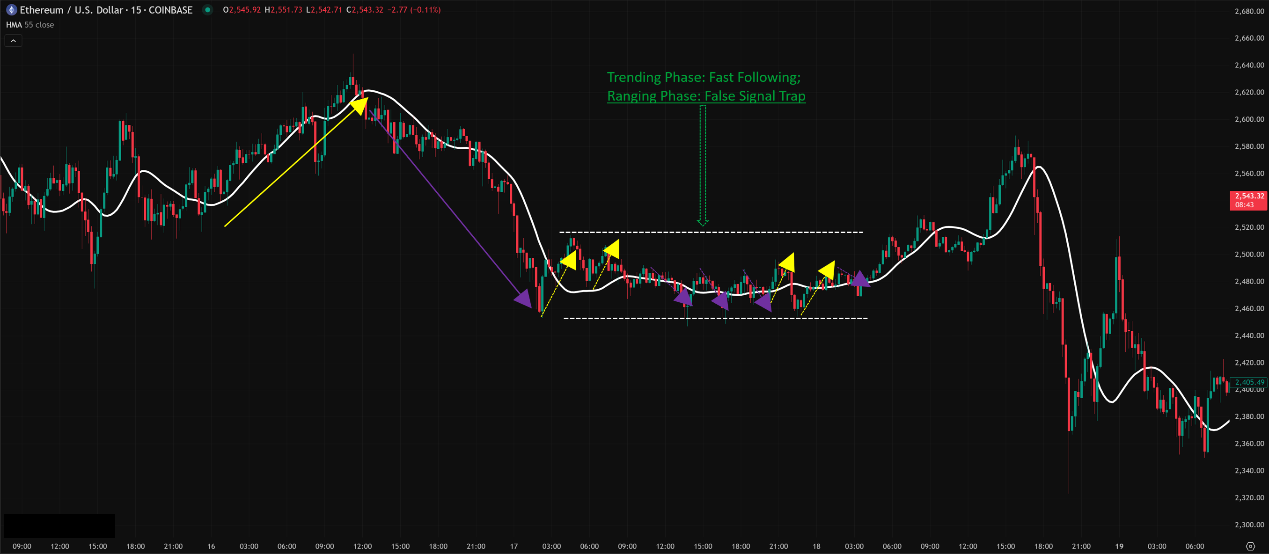
- Short-Term / Intraday (M15, H1):
- Where HMA starts showing potential, but extreme caution is needed!
- Pros: Compared to same-period EMA/SMA, HMA (e.g., 14, 21) turns faster and smoother, potentially giving earlier warnings of trend shifts or tighter trailing stop references.
- Cons: Ranging markets are still deadly! False signals will still be more frequent than with EMA.
- How to Use: Must filter signals rigorously!
- Combine with Trend Strength: Use ADX > 25 to confirm a trend exists before considering HMA signals.
- Combine with Price Structure: HMA turn + break of key S/R level.
- As a Fast Exit Signal: Might get you out of a losing trade quicker than other MAs.
「HMA on 15-Min Chart: Fast but Needs Filtering!」
- Swing / Long-Term (H4, Daily, Weekly):
- HMA’s stability and advantages become more apparent!
- How to Use:
- Use mid-to-long period HMA (e.g., 55) for major trend direction, enjoying its faster reaction compared to traditional MAs.
- Use short-to-mid period HMA (e.g., 21) for swing direction and potential exit points.
- Can experiment with HMA crossover strategies (e.g., HMA(21) vs. HMA(55)), but still needs confirmation.
- Advantage: On these timeframes, HMA’s smoothness really shines, effectively filtering noise while having significantly less lag than SMA, potentially even outperforming EMA in responsiveness.
Summary: Which Parameter Combo + Timeframe is Hottest & Most Effective? How to Use It?
- Parameters: No absolute “hottest,” but N=21 (balanced) and N=55 (smooth trend) are worthy starting points for investigation. Choice requires extensive backtesting.
- Timeframe: Daily / Weekly / H4 are where HMA is relatively safest and its advantages best utilized. H1 / M15 are high-risk, need strong confirmation. M5 / M1 are basically no-go zones.
- Hottest / Most Effective Usage = Understand and Leverage its Core Strengths:
- Ultra-Fast Turn Alerts (For Exits/Risk Management): An HMA turn can be a very early warning to take profit or tighten stops (requires confirmation!).
- Super-Smooth Trend Line (For Direction/Trend Entries): Use a longer-period HMA (e.g., 55) to define the major trend, enjoying its smooth yet responsive nature. Enter on pullbacks near the HMA with other confirming signals.
- Filter for Other Signals: Only consider buy signals from other indicators when HMA is rising; only sell signals when HMA is falling.
- Absolutely DO NOT use its turns/color changes ALONE for entries! Unless you have god-tier win rates and risk control.
- Identify and Avoid Ranging Markets! HMA’s false signals in chop can be even more deceptive than other MAs because it looks so smooth while doing it.
HMA is a Double-Edged Sword!
Alan Hull’s design is ingenious; it masterfully tackles the seemingly contradictory goals of “reducing lag” and “maintaining smoothness.” Its pros are:
- Extremely Fast Reaction
- Extremely Smooth Line
- Visually Clear
But its cons are also deadly:
- Sensitive to Noise, Prone to Many False Turn Signals
- Performs Poorly in Ranges
- Tiny Buffer as S/R
「HMA: The Precision Double-Edged Sword」

HMA is a precision instrument, not a point-and-shoot camera. It demands higher skill and stricter confirmation steps from the user. If you can harness its speed and smoothness effectively, it can be a potent tool in your arsenal. But misuse it, and its false signals will bleed you dry.
Next Steps:
- Add HMA to your charts, experiment with periods like 14, 21, 55.
- Compare HMA lines and responsiveness against EMA/SMA of the same period on different timeframes (especially H4, Daily).
- Find a clear trend and watch how HMA follows. Then find a range and watch how it generates false signals.
- Practice using HMA as an exit alert or as a filter for entries based on ADX/RSI/MACD/Price Structure.
- Backtest! Backtest! Backtest! Use data to verify if HMA truly adds value to your strategy.
Hope you all master this supercar of the MA world and outpace the competition! ️🏎️💨