Okay, all you super-sharp Trader elites, Crypto pioneers, and friends looking for that “future sight” on the charts! Today, we’re going to decode a less-talked-about, but conceptually unique relative of the moving average family – the LSMA (Least Squares Moving Average)! Some platforms also call it the Linear Regression Curve/Line. It’s not calculated using simple averaging; it uses statistics to try and “predict” where the price might go next! Sounds like sci-fi, right? Let’s dive in and see what it’s all about!
What the heck is LSMA? What’s the Fundamental Difference from SMA/EMA/HMA?
The biggest difference between LSMA and other MAs is its entirely different calculation basis!
- SMA/EMA/WMA/HMA: These are all based on the average value of past prices (using different weighting methods). They summarize past data.
- LSMA: This one uses the statistical method of Linear Regression. Simply put, it looks at the price data points over your chosen past N periods and finds the straight line that best “fits” these data points (mathematically, the line that minimizes the sum of the squared vertical distances from each data point to the line – hence “Least Squares”). The value the LSMA indicator plots on your chart is the endpoint value of this regression line at the current candle!
「LSMA Logic: Plotting the ‘Best Fit’ Statistical Line」
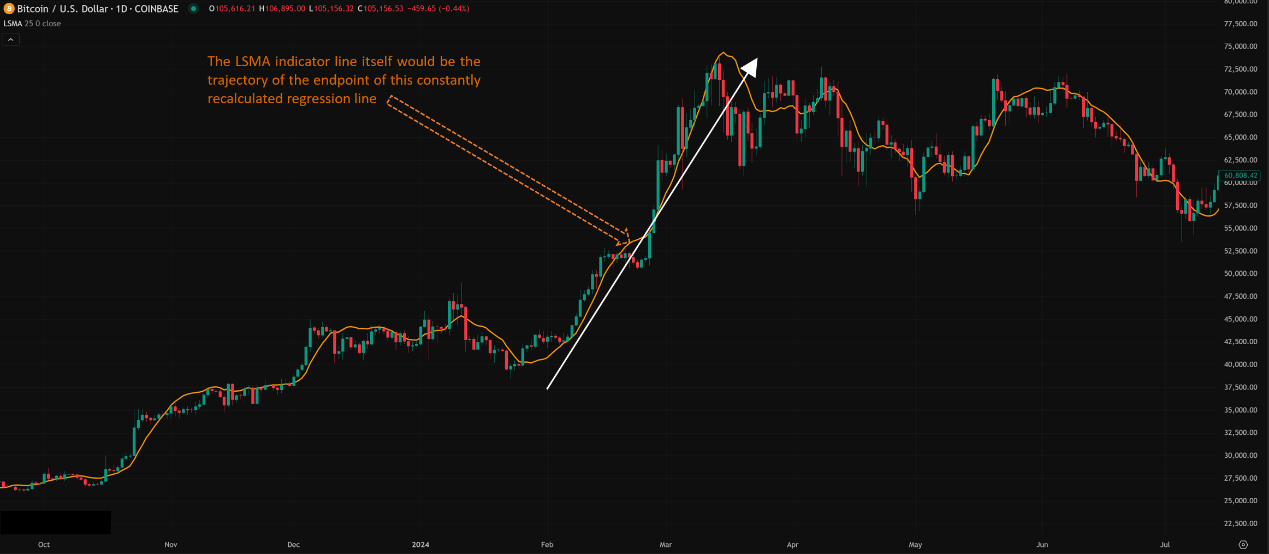
Core Concept: LSMA isn’t an “Average,” it’s a “Predicted Endpoint”!
Because it calculates where the best-fit line should end right now, its value theoretically includes a “predictive” element about the immediate trend, assuming the price continues along the most recent linear path. This makes the LSMA typically extremely fast and very close to the price.
LSMA’s Origin Story & Design: Statistics Enters the Trading Floor
LSMA doesn’t have a single famous inventor who “packaged” it like Wilder or Hull did for their indicators. Its roots are in basic statistics – least squares linear regression – a method that’s been around forever. Traders and analysts later applied this statistical tool to financial markets to analyze price trends.
- Design Goals:
- Extreme Responsiveness: By plotting the endpoint of the fitted line, the hope was to catch trend starts and turns faster than traditional MAs.
- Quantify Short-Term Slope: The slope of the regression line itself represents the strength of the recent linear trend.
- Identify Deviations: Observe how far the actual price deviates from the LSMA line.
LSMA Basic Plays (Quick Look for Newbies):
Because LSMA hugs price tightly and reacts instantly, its basic usage requires extreme caution regarding its characteristics.
- Gauging Direction (Trend Direction via Slope):
- LSMA sloping UP → Short-term bullish bias.
- LSMA sloping DOWN → Short-term bearish bias.
- LSMA Flat → Possible micro-consolidation, but LSMA rarely stays flat for long.
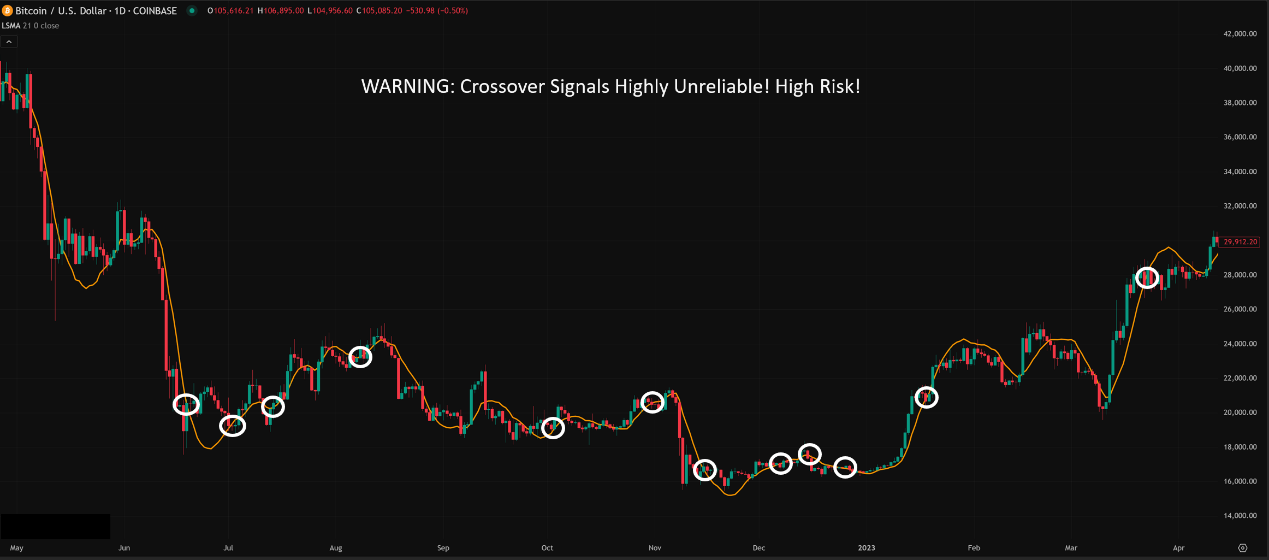
- Crossover Signals (EXTREMELY HIGH RISK!):
- Price Crossing LSMA:
- Price breaks above LSMA → Ultra-short-term buy alert?
- Price breaks below LSMA → Ultra-short-term sell alert?
- Fast/Slow LSMA Cross: (e.g., LSMA(10) vs. LSMA(25))
- Fast crosses above slow → Buy alert?
- Fast crosses below slow → Sell alert?
- EXTREME DANGER WARNING! Because LSMA is so fast, hugs price, and its standard implementation can potentially “repaint” slightly (the LSMA value on historical bars might subtly adjust as new data comes in), using crossover signals alone for trading is incredibly dangerous! You will get drowned in false signals! Its crosses reflect instantaneous momentum shifts more than reliable entry signals.
「LSMA Crossovers: Extremely Volatile, Use with Extreme Caution!」
3. Dynamic S/R? Forget About It!
-
- LSMA basically sticks to the price like glue, offering almost zero buffer space. Therefore, its value as dynamic support or resistance is extremely low. Don’t expect price to reliably bounce off the LSMA line.
LSMA Advanced Plays & Parameter/Timeframe Breakdown (Expert Lab):
Due to its unique nature and potential issues (repainting risk), advanced LSMA uses are limited, and there are no widely accepted “holy grail” strategies.
Core Parameter: Period (N)
- LSMA’s main parameter is the period N used for the linear regression calculation.
- Impact of N:
- Smaller N (e.g., 9, 14): LSMA reacts extremely fast, follows every price wiggle. Highly sensitive to noise, the line can look very “jagged,” tons of false turns.
- Larger N (e.g., 21, 25, 50): LSMA is relatively smoother (but still much faster than EMA/SMA of the same period), better reflecting the linear trend over a slightly longer duration. Lag increases, but might filter some noise.
- Default Parameters: No universal standard, but 21 or 25 are common. TradingView’s default might be 25.
Parameter Settings Analysis & “Hottest” Combo Discussion:
- “Hottest” Combo? Nope! Really, None! Due to LSMA’s characteristics (fast, tight, potential repaint), stable and reliable standard crossover or pullback strategies are hard to form. Thus, there are no widely circulated “golden parameter combos.”
- Why Not?
- Inherent Nature: Too fast, too close to price, rendering traditional MA strategies ineffective.
- Repainting Risk (Potential): Standard LSMA calculation means historical values might slightly change, which is a huge obstacle for backtesting and developing mechanical strategies. Many rigorous traders avoid potentially repainting indicators for core decisions. (Note: Implementations vary across platforms; some might offer “non-repainting” versions, but the logic might differ).
- Alternatives Exist: For speed + smoothness, HMA is often preferred and more reliable. For pure speed, short-period EMA/WMA might be easier to handle.
- So What Do People Use LSMA For? (Unique Ideas / Niche Uses):
- Ultra-Short-Term Momentum Indicator (Auxiliary):
-
-
- Use the slope of a very short period LSMA (e.g., 5, 9) to gauge instantaneous momentum direction. E.g., slope flipping sharply from positive to negative might, combined with other signals, warn of short-term risk.
- Focus on the slope, ignore the crosses!
2. Price Deviation from LSMA:
-
-
- Use a relatively longer LSMA (e.g., 21, 25). When price deviates significantly from the LSMA line (e.g., price is far above a rising LSMA), it might suggest a short-term overbought/oversold condition with potential for Mean Reversion (but needs confirmation from oscillators like RSI/Stochastic).
- This is somewhat similar to using Bollinger Bands.
3. As a “Smoother” for Other Indicators?
-
-
- Some advanced traders might use LSMA’s calculation method to smooth data from other indicators (like RSI), theoretically offering faster smoothing than SMA/EMA. But this is very niche.
4. Combinations (Possible direction, needs extensive testing):
-
-
- LSMA + Slow MA Trend Filter: E.g., only consider LSMA (e.g., 21) pointing up if the price is above the 200 SMA.
- LSMA Slope + Oscillator Confirmation: E.g., LSMA(21) starts sloping up + RSI crosses up from oversold territory.
Timeframe Analysis:
- Ultra Short-Term (M1, M5, M15):
- Disaster Zone! LSMA’s speed + potential repaint + massive market noise = extremely chaotic and unreliable signals. Absolutely not recommended on these timeframes.
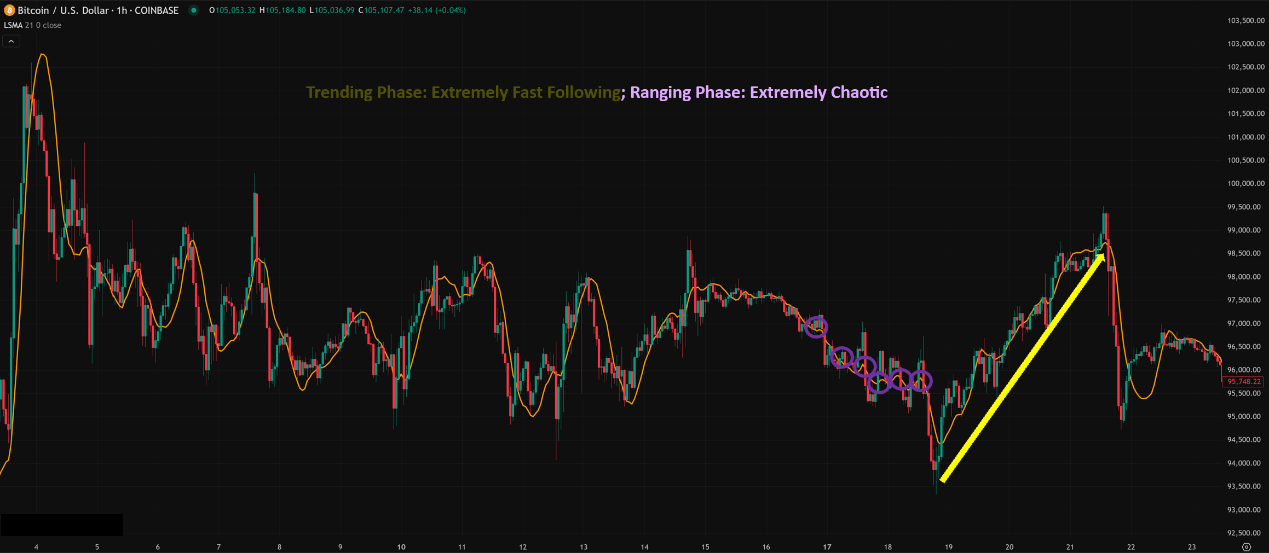
- Intraday / Short Swing (H1, H4):
- Still Very Fast! LSMA (e.g., 21, 25) will closely track price swings.
- Usage Challenge:
- In strong, one-sided trending markets, LSMA can provide a very tight trendline.
- But the moment the market gets choppy or pulls back, LSMA will flip rapidly, generating many false signals.
- Using it for deviation analysis or momentum reference might be better than using crosses.
- Conclusion: Risk remains very high, requires strong filtering and confirmation. Might be more suitable as an exit reference (e.g., price breaks strongly below a rising LSMA) rather than entry.
「LSMA on 1-Hour Chart: Extremely Responsive, Extremely Risky」
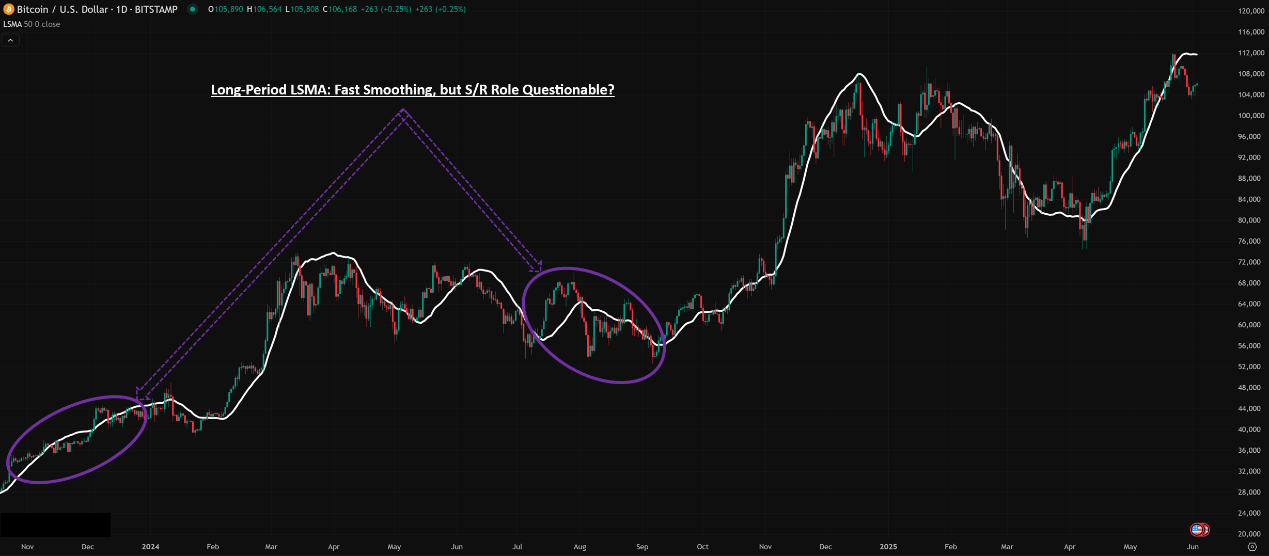
- Swing / Long-Term (Daily, Weekly):
- Relatively smoother, but still fast! Longer period LSMA (e.g., 50) will be more stable than short periods.
- Usage Exploration:
- Observe the slope of a long-period LSMA as a primary trend reference; its turns will be faster than same-period SMA/EMA.
- Monitor the degree of price deviation from the long-period LSMA as an auxiliary gauge of potential overbought/oversold levels.
- Whether it provides reliable pullback S/R like a 50 EMA/SMA is questionable due to its different calculation basis and needs extensive observation/testing. Often, HMA(55) might be a better choice for this purpose.
「LSMA on Daily Chart: Smoother but Still Unique」
Summary: Which Parameter Combo + Timeframe is Hottest & Most Effective? How to Use It?
- Parameters: No “hottest”! Common starting points are 21 or 25. Understanding its nature is more important than the exact parameter.
- Timeframe: Longer periods are “less dangerous” but not necessarily “best.” Daily/Weekly are relatively stable, but its main advantage (speed) might be less pronounced compared to alternatives like HMA on these scales. Short timeframes are extremely risky.
- Hottest / Most Effective Usage = DON’T Use it like a Traditional MA!
- Understand it’s a “Linear Trend Forecast Point”: Don’t expect stable S/R like SMA/EMA.
- Leverage its “Speed” for Momentum Reference: Observe slope changes, especially on very short periods, as hints of instantaneous momentum shifts (requires heavy filtering).
- Use its “Tightness” for Deviation Analysis: Monitor significant price deviations from LSMA as potential mean reversion setups (needs oscillator confirmation).
- Treat Crossover Signals with Extreme Skepticism!
- Be Aware of Potential Repainting Issues! Especially for backtesting and automated trading.
- Always, Always, ALWAYS Combine with Other Confirmation Tools! LSMA is an indicator demanding significant backup and validation.
LSMA: Formula 1 Car or Experimental Prototype?
The concept behind LSMA is fascinating: using statistics to fit the trend and achieve ultimate speed. It’s like an F1 car:
- Pros: Blindingly fast, highly responsive.
- Cons: No buffer, extremely sensitive to track conditions (market noise), very difficult to handle, and might “correct” its own path unexpectedly (repaint).
For most traders, a well-balanced sports car (like HMA) or a reliable GT (like EMA) is likely more practical. LSMA feels more like an experimental tool for advanced users.
「LSMA: High-Speed Experiment?」

If you’re obsessed with speed, love digging into indicator math, and have the skills to build complex confirmation systems and perform rigorous testing, LSMA might pique your interest. But if you’re a beginner or looking for stable, reliable tools, master EMA, HMA, and other mainstream options first.
Next Steps:
- Find LSMA (might be called Linear Regression Curve/Line) on your platform.
- Add it (e.g., with period 21/25) to different timeframe charts and compare visually against HMA/EMA.
- Focus on observing slope changes and price deviations, not crossovers.
- Understand if your platform’s LSMA implementation potentially repaints.
- Test Extensively in Demo / with Tiny Positions! Don’t jump into heavy trades with LSMA initially.
Keep exploring, keep testing, keep learning with caution on your technical analysis journey!🚀🔬