Alright hustlers, market wizards finding that Alpha, and Crypto explorers of the new frontier! Today, we’re cracking open the code on an indicator with a seriously confident name, sounding like the “ultimate cheat sheet” – the Know Sure Thing (KST) indicator! Sounds solid, right? The guy behind it, Martin Pring, is basically a GOAT-level legend in technical analysis! But is KST really a “Know Sure Thing”? Where does it actually shine? Let’s break it down together!
What the heck is KST? How’s it different from RSI / MACD?
KST is a Momentum Oscillator, invented by the technical analysis giant Martin J. Pring. It’s similar to common tools like RSI (Relative Strength Index) or MACD (Moving Average Convergence Divergence) in that it measures market momentum, but KST’s design philosophy puts extra emphasis on combining momentum changes across different time cycles to pinpoint major cyclical turning points.
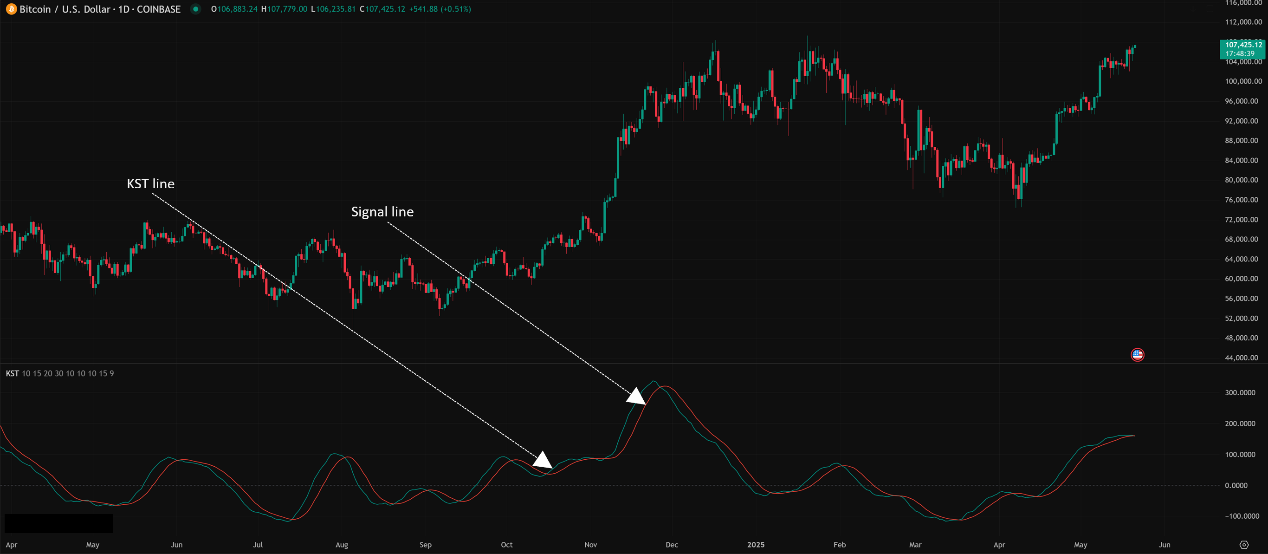
It usually consists of two lines:
- The KST Line: The main oscillator line, fluctuating around a Zero Line.
- The Signal Line: Typically a Simple Moving Average (SMA) of the KST line itself, like a 9-period SMA.
「KST Indicator Structure: Main KST Line + Signal Line」
How it differs from others:
- RSI/Stochastic: Mainly focus on overbought/oversold levels, react quickly to price changes.
- MACD: Looks at the difference between fast and slow EMAs, capturing trend momentum.
- KST: By blending four different Rate of Change (RoC) periods, smoothing each one, and then taking a weighted sum, it aims to capture smoother, more reliable major cycle momentum, filtering out short-term noise. Think of it as a “greatest hits” compilation of momentum.
KST’s Origin Story & Design: Why So Complicated?
Martin Pring is an expert in market cycles. He found that single-period momentum indicators often generate false signals. He wanted to create a composite indicator that reflected the momentum across different market cycle lengths (short, intermediate, long, very long).
How it’s Calculated (Super Conceptual Flow, feel the vibe!):
- Calculate Four Rates of Change (RoC):
- Calculate the price RoC over four different periods N1, N2, N3, N4 (e.g., the price change over the last 10, 15, 20, and 30 days).
- Smooth Each RoC Individually:
- Apply a moving average (usually SMA) to each of the four RoC values, using periods M1, M2, M3, M4 respectively (e.g., smooth the 10-day RoC with a 10-period SMA, smooth the 15-day RoC with a 10-period SMA…).
- Weighted Summation:
- Multiply each smoothed RoC value by a different weight (W1, W2, W3, W4), then add them together. Weights typically increase (e.g., W1=1, W2=2, W3=3, W4=4), giving more importance to the longer-term RoC influence.
- KST = (SmoothedRoC1 * W1) + (SmoothedRoC2 * W2) + (SmoothedRoC3 * W3) + (SmoothedRoC4 * W4)
- Calculate the Signal Line:
- Finally, apply a shorter-period SMA (e.g., 9-period) to the calculated KST line itself to get the signal line.
Simply Put: KST is like a symphony orchestra! It doesn’t just listen to one instrument (single RoC period). It takes the sounds (momentum) from different sections (short, medium, long cycle RoCs), processes them (smoothing), blends them according to importance (weighting), and finally produces a grander, more harmonious (more reliable) piece (composite momentum)! The goal is to capture the market’s main theme, not just individual noisy notes.
「KST Logic: A Symphony of Multi-Cycle Momentum」
KST Basic Plays (Beginner’s Playbook):
KST usage shares similarities with other momentum oscillators, but with slightly different emphasis.
- Zero Line Cross:
- KST line crosses above the zero line from below → Potential bullish signal, suggests longer-term momentum might be strengthening.
- KST line crosses below the zero line from above → Potential bearish signal, suggests longer-term momentum might be weakening.
- Note: Zero line crosses are relatively lagging signals, often used as part of trend confirmation, not precise entry points.
- Signal Line Cross (More Common!):
- KST line crosses above its signal line → Buy signal.
- KST line crosses below its signal line → Sell signal.
- Pros: Catches short-term shifts in momentum faster than zero line crosses.
- Cons: Still generates false signals, especially in ranging markets. Needs combination with other analysis!
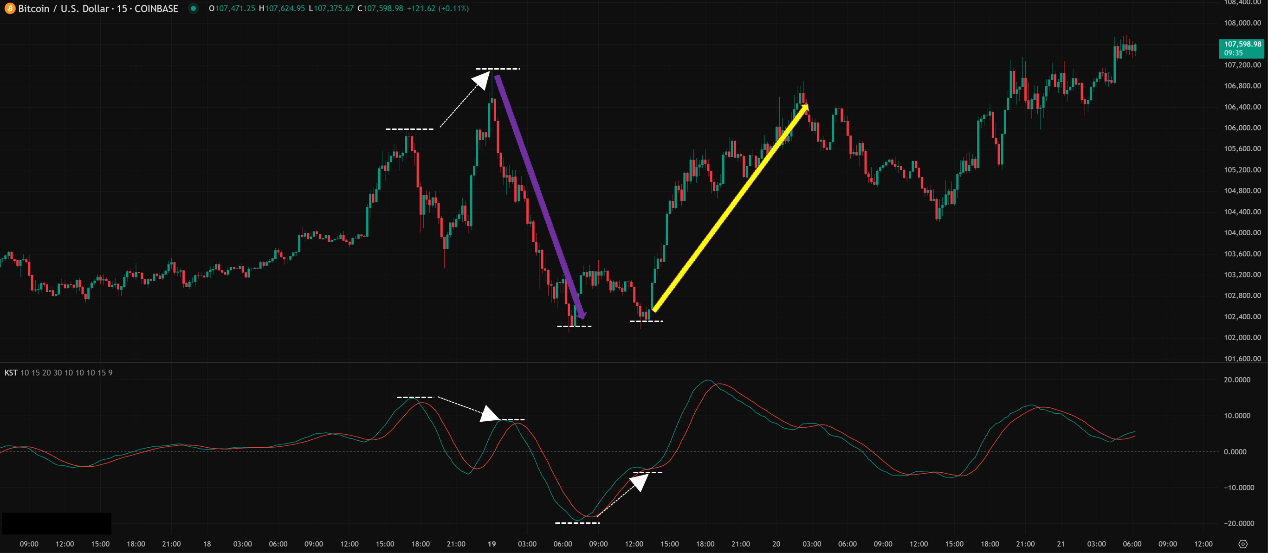
- Divergence (One of KST’s Strengths!):
- Similar to RSI/MACD, KST divergence is a very important signal!
- Bullish Divergence: Price makes a new low, but the KST line fails to make a corresponding new low (makes a higher low instead) → Suggests downside momentum is fading, potential bottoming/reversal is near.
- Bearish Divergence: Price makes a new high, but the KST line fails to make a corresponding new high (makes a lower high instead) → Suggests upside momentum is fading, potential topping/pullback is near.
- Divergence signals often provide earlier warnings than crossovers.
「KST Core Usage: Signal Line Crosses & Divergence Detection」
4. Overbought/Oversold? (Less Reliable):
-
- KST doesn’t have fixed overbought/oversold levels (like RSI’s 70/30). While you can observe historical extreme highs/lows on the KST, using it for OB/OS readings is far less reliable than RSI or Stochastics. Not recommended as a primary use case.
KST Advanced Plays & Parameter/Timeframe Breakdown (Pro Zone – Parameter Hell?):
Advanced KST application and parameter tuning can be a deep topic.
Core Parameters: A LOT!
- Standard Parameters (Recommended by Martin Pring, for Long-Term Daily/Weekly):
- RoC Periods (4): 10, 15, 20, 30
- SMA Smoothing Periods (4): 10, 10, 10, 15
- RoC Weights (Implied): Usually 1, 2, 3, 4 (many platforms calculate this automatically).
- Signal Line SMA Period: 9
- How Do Parameters Affect It?
- Changing any RoC or SMA period affects the KST line’s responsiveness and smoothness.
- Shorter periods → Faster, more noise.
- Longer periods → Slower, smoother.
- Changing weights → Alters the influence of different cycle momentums on the final output.
Parameter Settings Analysis & “Hottest” Combo Discussion:
- The Challenge: Too Many Parameters! 9 settings to tune! How does a normal person handle that?
- Pring’s Original Intent: His default parameters (10,15,20,30 / 10,10,10,15 / 9) were heavily researched and specifically designed to capture mid-to-long-term market momentum based on traditional economic cycles, especially on Daily / Weekly / Monthly charts of stock market indices. For this specific purpose, his defaults are arguably a time-tested classic.
- “Simplified” KST (Used by many platforms):
- To make it user-friendly, many platforms (including some versions on TradingView) offer a simplified KST, perhaps using only two RoC periods + two SMA periods + one signal line period.
- Example: A common TradingView version might default to:
- RoC 1: 10, SMA 1: 10
- RoC 2: 15, SMA 2: 10
- RoC 3: 20, SMA 3: 10
- RoC 4: 30, SMA 4: 15
- Signal SMA: 9
- Warning! When using a simplified version, your results might differ from Pring’s original KST!
- Any More “Unique” / “Hottest” Crypto Combos?
- No Recognized Standard! Because the Crypto market is 24/7 and highly volatile with different cycles than traditional markets, there’s significant doubt whether Pring’s original parameters are optimal.
- Common Experimental Directions:
- Overall Shorter Periods: Might try combos based on Fibonacci numbers like (RoC: 5,8,13,21 / SMA: 8,8,8,13 / Signal: 5) to make it react faster in crypto.
- Tuning Simplified KST: Might take the platform’s simplified default and tweak it, e.g., adjusting RoC periods to better fit their trading timeframe.
- The Results? Highly dependent on backtesting and personal validation! Changing any parameter can have cascading effects. No single setting guarantees superior performance across all cryptos or all times.
- Conclusion: The “hottest” / most effective approach might be:
- For long-term stock index analysis → Stick with Pring’s defaults (10,15,20,30 / 10,10,10,15 / 9) on Daily/Weekly/Monthly charts. This is the classic, intended use.
2. For other markets (like Crypto) or shorter-term trading → Probably use the simplified KST offered by your platform, accept its defaults as a starting point, or only slightly tweak one or two parameters (like the signal line period), and perform extensive backtesting. Randomly changing all 9 parameters is asking for trouble.
「KST Parameters: Complexity & Choice」

Timeframe Analysis:
- Ultra Short-Term (M1, M5, M15):
- Limited / Poor Effectiveness. KST is designed to capture cyclical momentum and is relatively smooth. On ultra-short timeframes, it will appear very laggy, unable to effectively capture rapid fluctuations. Signal line crosses become mostly meaningless.
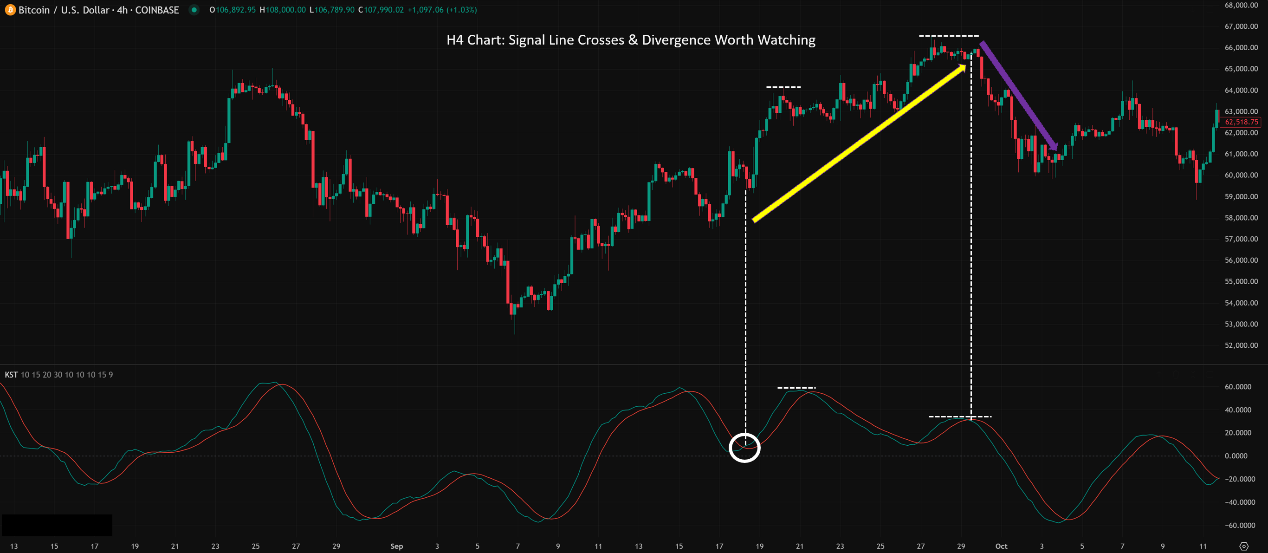
- Intraday / Short Swing (H1, H4):
- Starts having some reference value, especially simplified KST.
- How to Use:
- Primarily watch KST line / signal line crosses as early references for momentum shifts (but still lags more than indicators like MACD).
- Look for Divergence signals; these might provide earlier warnings than crossovers on these timeframes.
- Example: A clear bullish divergence on the H4 chart could prompt looking for buy confirmation from price action or other indicators.
- Limitation: Pring’s original KST might be too slow; simplified versions are more commonly used here.
「KST on H4 Chart: Potential Swing Signals」
- Swing / Long-Term (Daily, Weekly, Monthly):
- KST’s Home Turf! The core application intended by Pring!
- How to Use (with Pring’s default parameters):
- Identify Major Market Cycle Turns: Zero line crosses or turns from extreme low/high levels can signal shifts in the long-term trend.
- Confirm Bull/Bear Markets: KST persistently trading above zero confirms a bull market; below zero confirms a bear market.
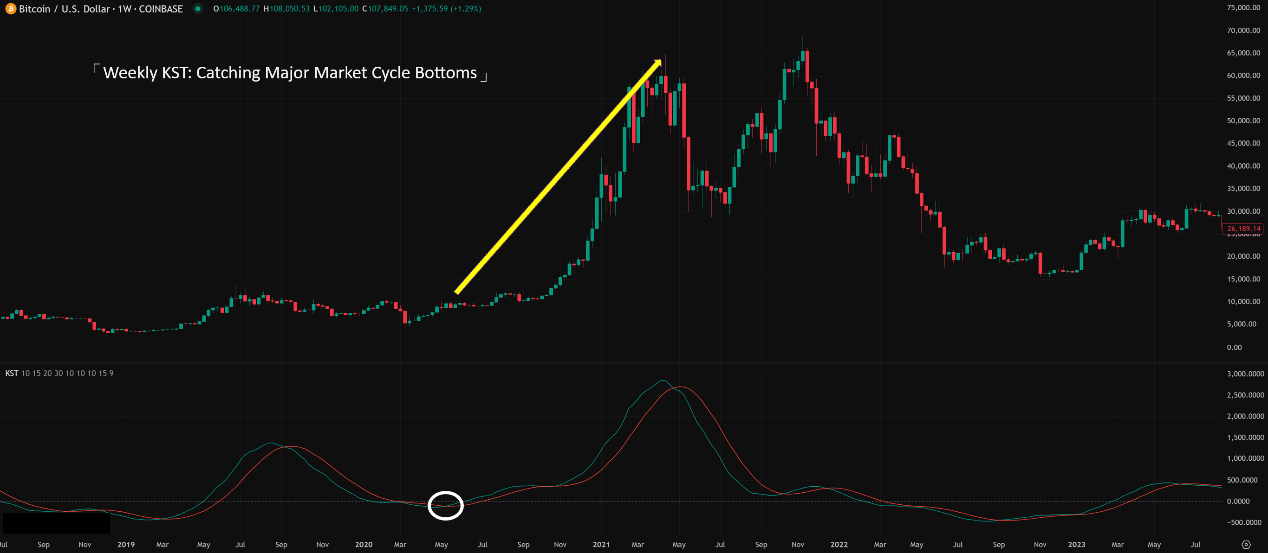
- Find Long-Term Buy Opportunities: Monthly KST crossing up through its signal line or the zero line from deep negative territory is a very significant long-term buy reference signal (similar to Coppock Curve, but KST offers a more comprehensive momentum view).
- Major Divergences: Divergences on Daily/Weekly KST often precede significant corrections or reversals.
「KST on Weekly Chart: Identifying Major Market Cycles」
Summary: Which Unique Parameter Combo + Timeframe is Hottest & Most Effective? How to Use It?
- Parameters:
- Long-Term Stock Indices (Daily/Weekly/Monthly): Use Pring’s defaults (10,15,20,30 / 10,10,10,15 / 9). This is the classic, most meaningful application.
- Other Markets/Shorter Term: Use your platform’s simplified KST defaults as a starting point. Don’t try to randomly tune all 9 original parameters!
- Timeframe: Daily / Weekly / Monthly are KST’s most reliable playgrounds. H4 / H1 are usable (esp. simplified KST for divergence). M15 or lower is generally pointless.
- Hottest / Most Effective Usage = Understand its “Multi-Cycle Momentum” Core, Be a “Cycle Confirmation” and “Divergence” Specialist:
- Prioritize Longer Timeframes! Use it to feel the market’s major waves.
2. Focus on Signal Line Crosses, especially those near zero or at extreme levels.
3. Make Divergence a Core Advanced Technique! KST’s smoothness makes its divergence signals relatively reliable.
4. Combine with the Major Trend! KST signals aligned with the larger trend (e.g., bullish divergence or KST crossing up signal line in a bull market) are more trustworthy.
5. Don’t Use it Alone! Confirm with price patterns, trendlines, MAs, etc.
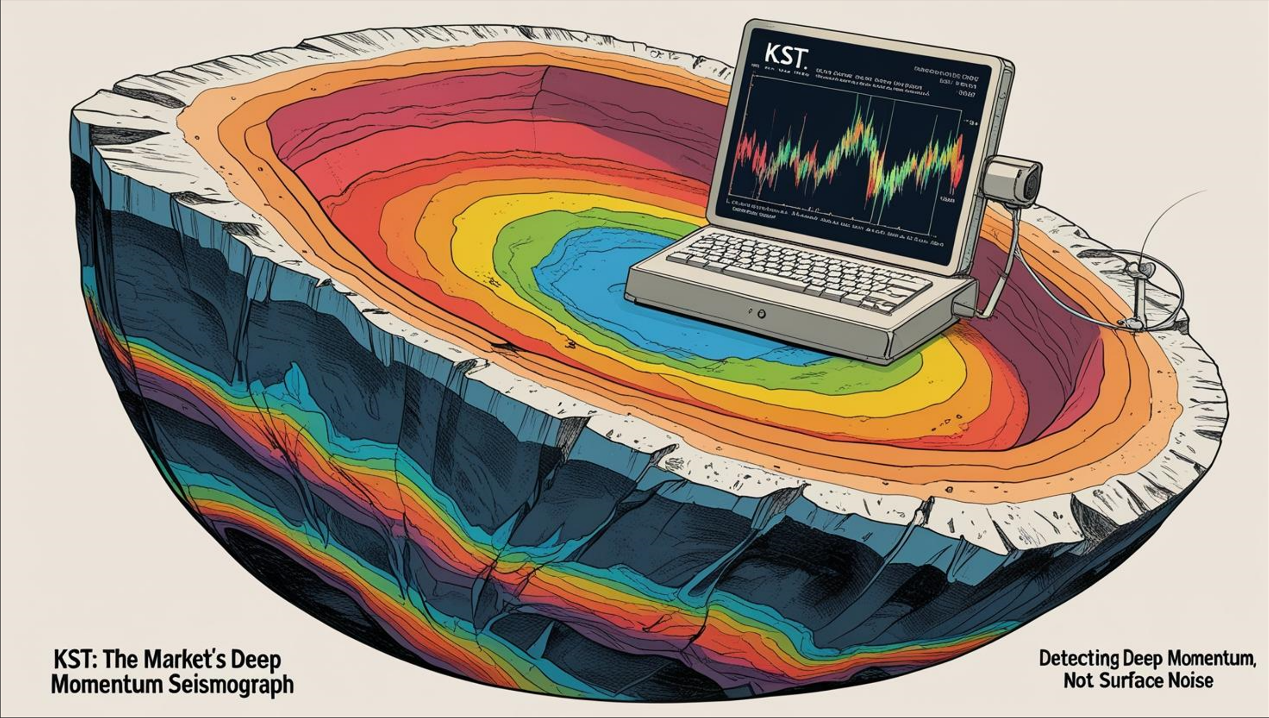
KST: The Market’s “Seismograph,” Measuring Deeper Momentum
KST isn’t about the fastest reaction time. It’s more like a sophisticated “seismograph,” analyzing vibrations (momentum) from different layers (cycles) to determine if major shifts are brewing deep within the earth’s crust (the market’s primary trend). Its pros:
- Combines multiple cycles, theoretically more comprehensive and smoother.
- Divergence signals are relatively reliable.
- Excels at identifying major market cycle turns.
But its cons are significant:
- Lagging: By design, slower than many indicators.
- Complex Parameters: Especially the original version.
- Poor for Short-Term Trading: Not suitable for high-frequency reactions.
- Requires Patience: Especially waiting for long-term signals.
「KST: The Market’s Deep Momentum Seismograph」
KST requires understanding its design philosophy and is primarily suited for mid-to-long-term analysis. For traders looking to capture major cycles, make long-term allocations, or find a smoother, more reliable momentum divergence tool, it’s an excellent indicator worth studying.
Next Steps:
- Find the KST indicator on your platform; note if it’s the full Pring version or a simplified one (check adjustable parameters).
- Add KST (using defaults) to your Daily and Weekly charts.
- Focus on observing signal line crosses and divergences between price and the KST line.
- Compare KST’s behavior to MACD on the same chart.
- Backtest! If you intend to adjust parameters (especially on simplified versions), validate with data.
May you master the market’s deep rhythms and catch those cycle turns! ️🌊🕰️🚀