Physical Address
304 North Cardinal St.
Dorchester Center, MA 02124
Physical Address
304 North Cardinal St.
Dorchester Center, MA 02124
Alright, all you market rhythm masters, Crypto momentum trackers, and sharp traders looking to catch that price “acceleration”! Today, we’re digging into a super fundamental indicator that often gets overlooked or misunderstood – the Momentum indicator! It doesn’t have the bells and whistles of RSI/Stochastics or the complexity of MACD. It’s the rawest, most direct measure telling you: how fast is the price moving right now? Wanna know how to use this “speedometer”? Let’s break it down!
What the heck is the Momentum Indicator? How Raw & Direct Is It?
The Momentum indicator, just like its name suggests, measures the speed and magnitude of price changes over a specific time period. It’s one of the most foundational momentum concepts.
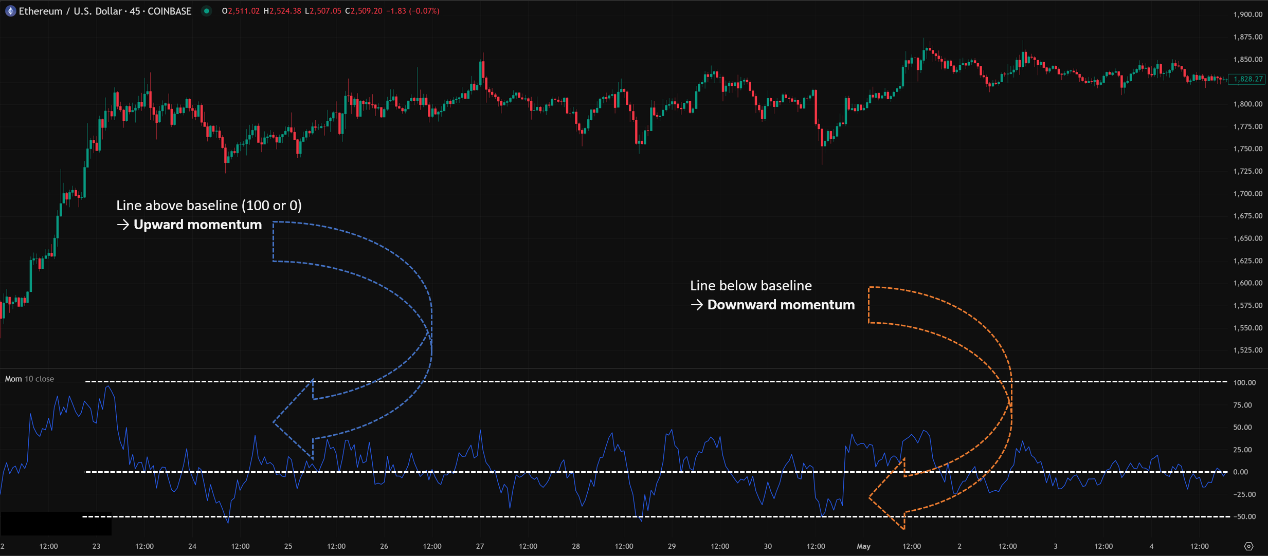
It usually appears as a single line oscillating around a baseline (typically 100 or 0):
Calculation Method (Most Common): (Current Close / Close N periods ago) * 100. A value of 100 means the price is the same as N periods ago; > 100 means it’s up; < 100 means it’s down.
Alternative Calculation: Current Close – Close N periods ago. In this case, the baseline is 0. > 0 means up, < 0 means down.
Core Interpretation:
Line above baseline (100 or 0) → Upward momentum.
Line below baseline → Downward momentum.
The further the line is from the baseline → The stronger the momentum (faster price change).
The closer the line is to the baseline → Momentum is weakening (slower price change).
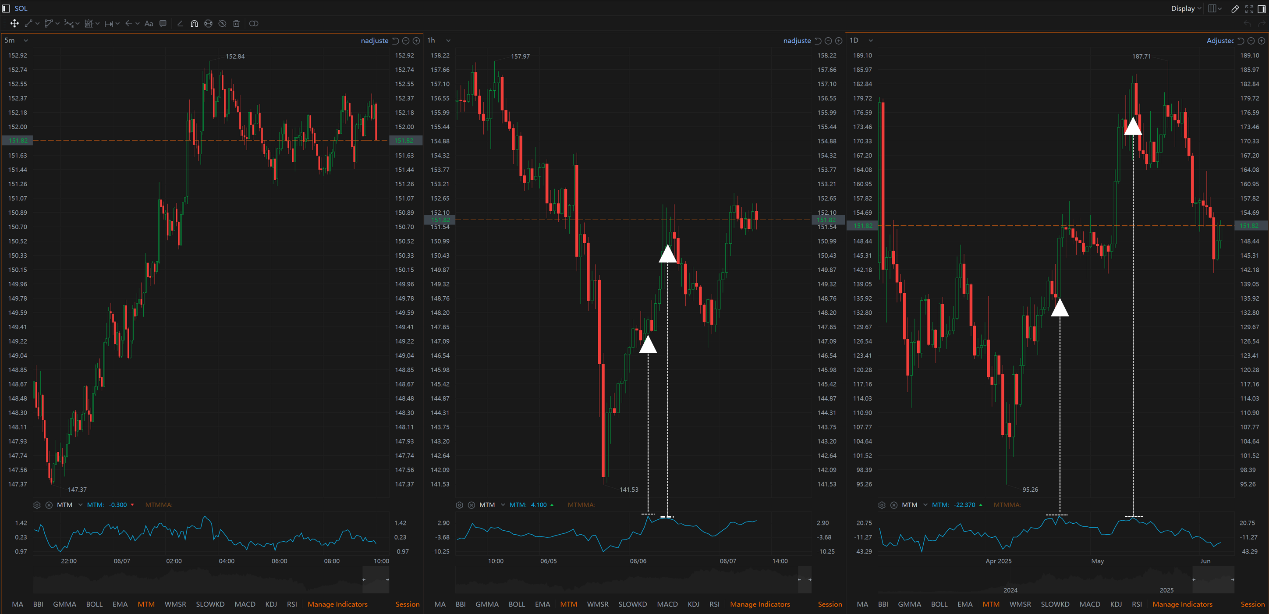
「Momentum Indicator Structure: Measuring Price Change Velocity」
How it differs from other momentum indicators:
RSI/Stoch: Focus on overbought/oversold, values bound by 0-100/(-100).
MACD: Looks at the difference between fast/slow lines, has its own signal line.
Momentum: The most direct comparison of current vs. past price speed. Its value is unbounded (with the subtraction method) or centered around 100. It has no built-in OB/OS concept.
The concept of momentum is so fundamental that no single “inventor” like Wilder is solely credited with popularizing this specific indicator form. It stems from the basic trader observation: Price doesn’t just have direction; it has speed! A slow grind up is different from a rocket launch.
Design Philosophy:
Quantify Speed: Provide an objective number to gauge how fast prices are changing.
Identify Momentum Changes: Watch the indicator line’s direction (up or down) to see if momentum is increasing or decreasing.
Spot Extremes: When momentum reaches very high or low levels, it might suggest the trend is overextended in the short term.
The Core: Just comparing now vs. N periods ago! Very simple and direct.
「Momentum Logic: The Market’s ‘Speedometer’」

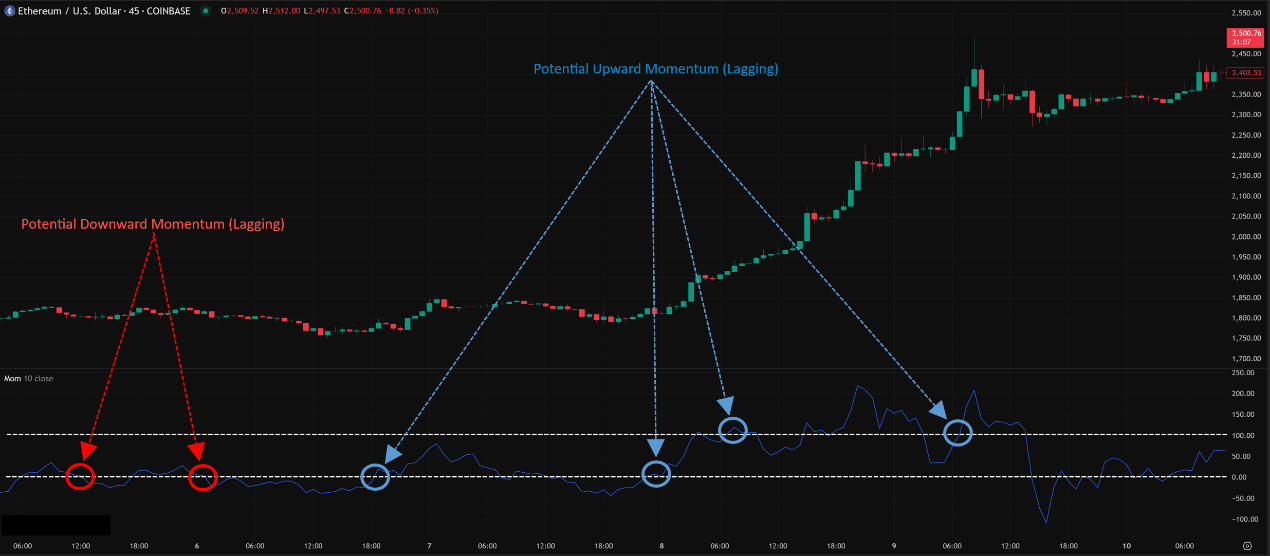
Baseline Cross (Lagging Signal):
Momentum line crosses above baseline (100 or 0) from below → Upward momentum emerging, potential bullish signal?
Momentum line crosses below baseline from above → Downward momentum emerging, potential bearish signal?
Warning: This is a very lagging signal! By the time the cross happens, the price might have already moved significantly. It’s better used as part of trend confirmation.
「Momentum Baseline Cross: Lagging Trend Confirmation」
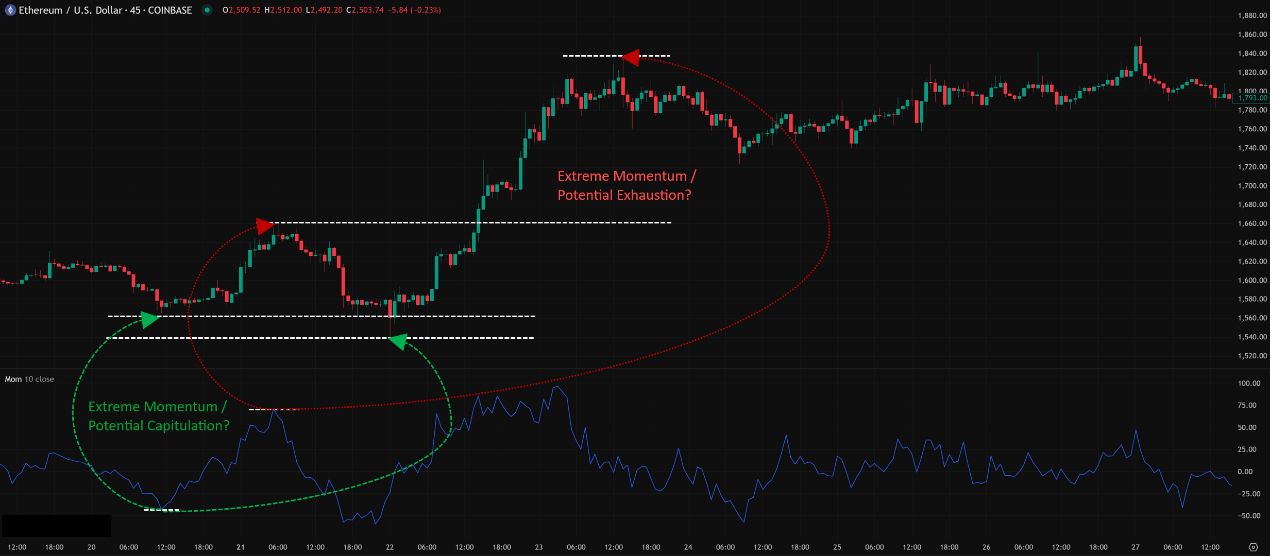
Extreme Readings (NOT OB/OS!):
Momentum line reaches historically high levels → Indicates recent upward price movement was extremely fast. Could mean the trend is strong, but could also be a sign of a short-term exhaustion spike (caution!).
Momentum line reaches historically low levels → Indicates recent downward price movement was extremely fast. Could mean the trend is strong, but could also signal a short-term panic selling climax/bottom (caution!).
Key Point: Momentum has no fixed overbought/oversold levels! “Extreme” is relative and must be judged against the asset’s own history. Furthermore, extreme momentum does not guarantee a reversal!
「Momentum Extreme Readings: Strength vs. Exhaustion」
The real power of Momentum lies in its “leading” characteristic – not the baseline cross, but how the momentum itself changes!
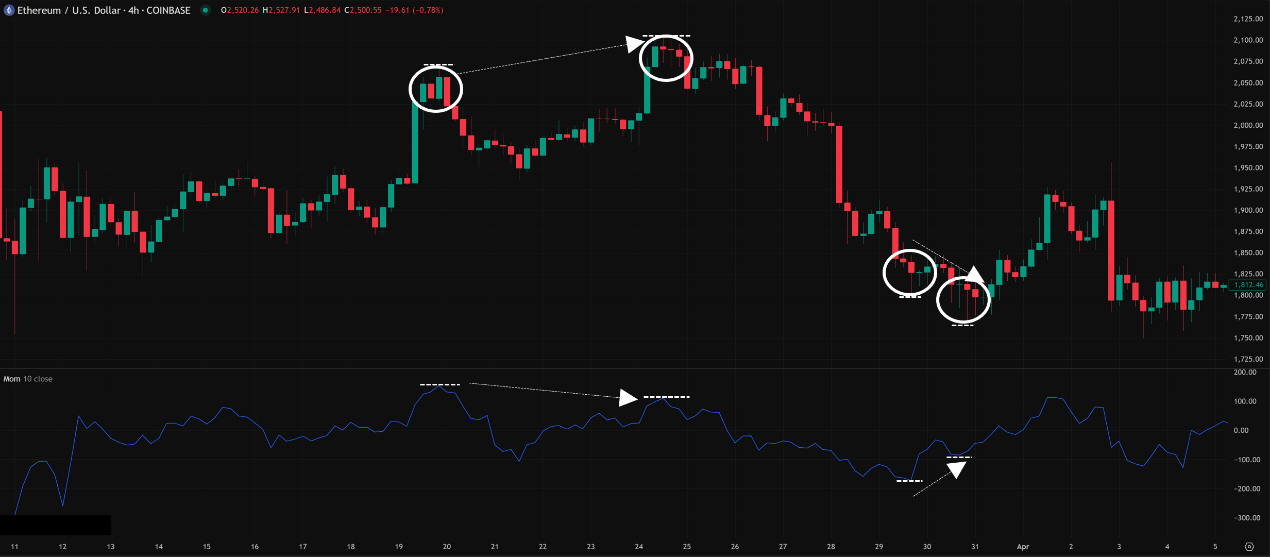
Divergence (Momentum’s Superpower!):
Just like RSI/MACD, divergence on the Momentum indicator is an extremely valuable leading signal!
Regular Bullish Divergence:
Price makes Lower Lows (LL), but the Momentum line makes Higher Lows (HL) (the speed of the decline is slowing). → Potential bottoming / bounce signal.
Regular Bearish Divergence:
Price makes Higher Highs (HH), but the Momentum line makes Lower Highs (LH) (the speed of the ascent is slowing). → Potential topping / pullback signal.
Why it Matters: Because momentum (speed) often turns before price itself does! When you see divergence, the market is telling you: “Even though my price made a new high/low, the force behind that move is significantly weaker!”
「Momentum’s Ace: Regular Divergence (Momentum Leads Price)」
Momentum Trendline Breaks:
Similar to RSI, you can draw trendlines directly on the Momentum indicator line.
A break of the Momentum trendline sometimes precedes a break of the corresponding price trendline, offering an early warning.
As a Confirmation Tool:
Use the direction/strength of Momentum to confirm other trade signals.
Example: Price breaks resistance + Momentum line also breaks strongly above baseline → Higher confirmation of breakout validity. Price forms a bullish candlestick pattern + Momentum shows bullish divergence → Increased confidence in a potential bounce.
Core Parameter: Period (N)
Momentum has one core parameter: the lookback period N.
Default Parameters: No single universal standard, but 10, 12, 14, 20 are all commonly seen defaults. TradingView, for instance, might default to 10.
Impact of Changing N:
Shorter N (e.g., 5, 9):
Momentum line is extremely sensitive, reacts super fast, very volatile.
Pros: Catches the shortest-term momentum bursts.
Cons: Very noisy, line whipsaws constantly, baseline crosses mostly meaningless.
Longer N (e.g., 20, 25, 30):
Momentum line is smoother, reacts slower.
Pros: Filters short-term noise, better reflects the dominant momentum trend over a period. Divergence signals might be more reliable.
Cons: Increased lag.
Parameter Settings Analysis & “Hottest” Combo Discussion:
Which N is Best?
No single answer! Depends on your objective and trading style.
If using for Divergence (Most Recommended Use): Mid-range periods (e.g., 12, 14, 20) often work well. Too short N can create unreliable divergences; too long N might obscure them.
If using for Ultra Short-Term Confirmation (High Risk): Might use 9 or 10.
If reflecting Longer-Term Trend Momentum: Might use 20 or 25.
The “Hottest” Combo?
No specific combo is particularly “hot.” Momentum’s power lies more in how you interpret it (especially divergence) than in the exact parameter.
Recommendation: Start with the platform default (e.g., 10 or 14). Get familiar with its basic behavior and divergence patterns. Only consider tweaking N if you find it consistently too sensitive/laggy for your specific purpose, and ALWAYS backtest your changes!
「Momentum Parameter N: Balancing Speed & Noise」

Timeframe Analysis:
All Timeframes Applicable! Like RSI, the Momentum concept works across all timeframes.
But Effectiveness & Focus Differ:
Ultra Short-Term (M1, M5, M15):
Momentum line will be extremely volatile, baseline crosses frequent.
Mainly look at extreme readings (vs. history) and very fleeting divergences as auxiliary references for scalping. Low reliability!
Intraday / Short Swing (H1, H4):
Momentum becomes more useful, especially divergence signals.
Can be used to confirm the momentum behind breakouts or reversal patterns. E.g., Head & Shoulders top forms, price makes lower high on right shoulder, Momentum is significantly lower than at the left shoulder – confirms downside momentum.
Swing / Long-Term (Daily, Weekly):
Momentum divergence carries significant weight on longer timeframes! Weekly divergences often precede major trend exhaustion.
Can use longer period N (e.g., 20, 25) to observe the trend of long-term momentum. E.g., Momentum staying consistently above baseline and trending up confirms bull market strength.
「Momentum Timeframes: Longer = More Reliable Divergence」
Parameters: Default (e.g., 10 or 14) is a good starting point. No single “hottest” combo. Fine-tune N based on need and testing.
Timeframe: All work, but Daily/Weekly divergence signals are most important. H1/H4 common usage zone. M15 or lower very noisy.
Hottest / Most Effective Usage = Master “Divergence” + Use as “Confirmation” Tool:
Divergence is the Core Weapon! Treat Momentum as a leading indicator of momentum exhaustion.
Baseline Crosses are Lagging Confirmation Only.
Extreme Readings are Potential Warnings, NOT OB/OS.
Use Momentum to Confirm Price Action! Does the breakout have momentum? Does the reversal pattern have divergence support?
Combine with Trend Analysis! Momentum signals aligned with the major trend (e.g., bullish divergence bounce in an uptrend) are more reliable.
Momentum: The Market’s “Throttle” Gauge, Showing Thrust Power
The Momentum indicator is like the throttle position gauge in a car, directly showing the intensity of the price’s acceleration. Its pros:
Simple and Direct, measures pure price velocity.
Divergence Signals are powerful leading indicators.
Effective at confirming the momentum behind other signals.
Cons:
Baseline Crosses Lag.
No Fixed OB/OS Levels, extreme readings require context.
Line can be volatile/jagged (especially short N).
Needs combination with other analysis tools.
「Momentum: The Market’s Throttle Pedal」

Momentum is a fundamental yet practical tool. Learning to read its divergence signals can make you much more sensitive to market turns. Integrating it into your system as a momentum confirmation step can effectively increase your trade conviction.
Next Steps:
Add the Momentum indicator (using default period, e.g., 10 or 14) to your charts.
Focus on practicing identifying bullish and bearish divergences.
Observe what typically happens to price after Momentum hits historical highs/lows.
Note how far price has usually moved by the time Momentum crosses its baseline.
Try using Momentum to confirm signals from your other favorite strategies.
Backtest! Test if different N periods provide better divergence signals in your market.
Hope you master the speed and fury of the market and catch those momentum bursts! ️