Physical Address
304 North Cardinal St.
Dorchester Center, MA 02124
Physical Address
304 North Cardinal St.
Dorchester Center, MA 02124
Alright team, all you precision Market Snipers, Crypto cycle watchers, and technically-minded traders looking for a more reliable momentum indicator! Today, we’re dissecting the “ultimate weapon” designed by trading legend Larry Williams (yeah, the %R guy!) – the Ultimate Oscillator (UO)! Sounds epic, right? Its whole design philosophy is about tackling the shortcomings of single-period oscillators, aiming to give you a smoother, more dependable momentum signal!
What the heck is the UO? How’s it different from RSI/Stoch/MACD?
The UO is a Momentum Oscillator that fluctuates between 0 and 100. Its biggest difference from its siblings lies in the fact that it doesn’t rely on just one time period!
RSI/Stoch/Momentum: Usually calculated using a single period (e.g., 14 periods).
MACD: Uses two EMAs.
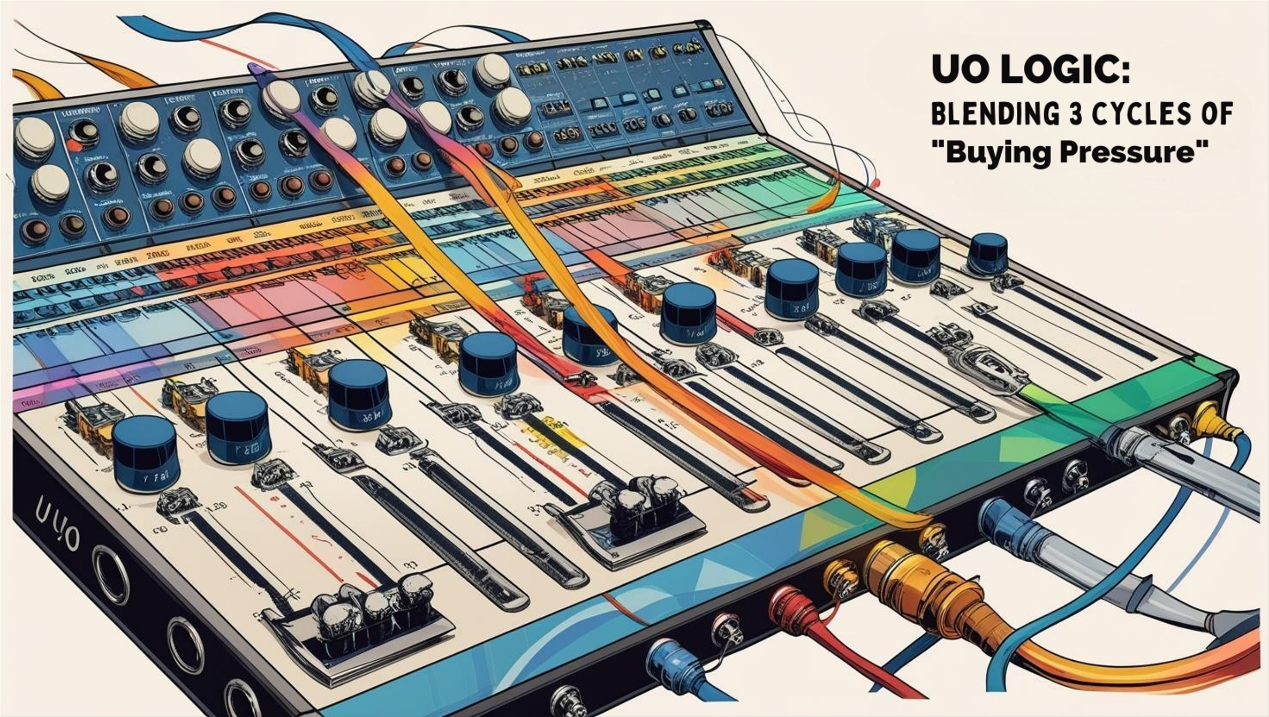
UO: It’s a hybrid! It calculates “Buying Pressure” over three different timeframes (short, medium, long) and then averages them together using specific weights!
Its goals are:
Reduce False Signals: Single-period oscillators can be easily fooled by short-term noise. Blending three periods helps cancel out some of this noise, making signals smoother and potentially more reliable.
Reduce Divergence Failures: Sometimes short-term indicators show divergence, but the longer-term trend isn’t finished, causing the divergence to fail. UO combines multiple cycles, hoping to produce more trustworthy divergence signals.
Provide More Stable OB/OS Readings: While it has overbought/oversold zones, blending in longer periods usually prevents it from hitting extreme levels as frequently as something like StochRSI.
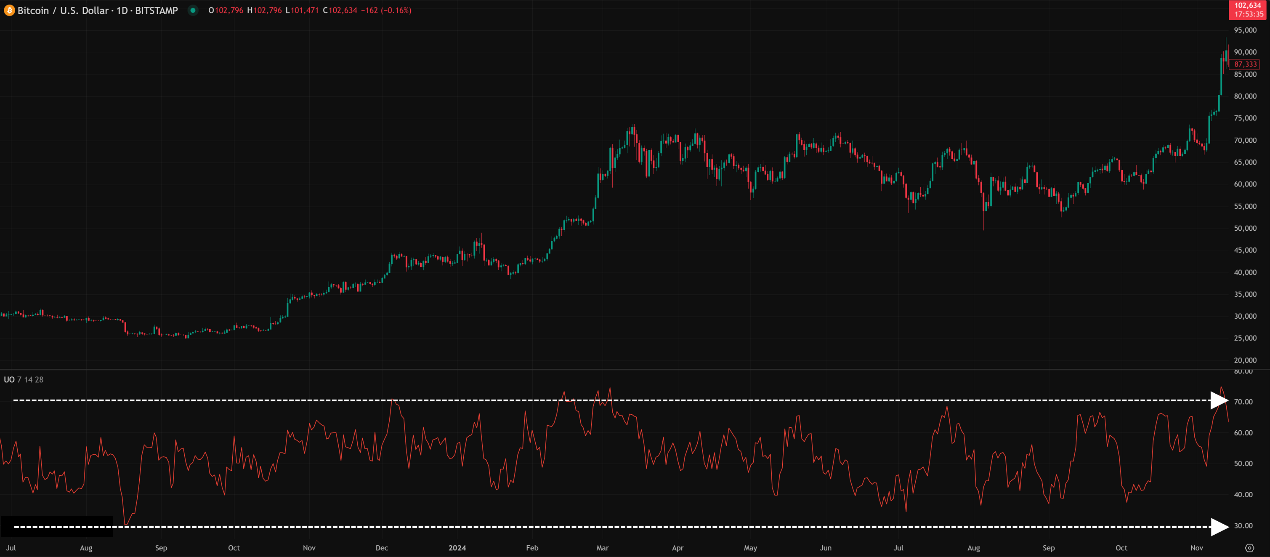
It typically displays as a single line, oscillating around the 70/30 or 80/20 overbought/oversold levels.
「Ultimate Oscillator (UO) Structure: Weighted Average of 3 Momentum Cycles」
Larry Williams introduced the UO in 1976. He observed that oscillators using a single short period (like Stochastics, popular at the time) generated many false signals during rapid price fluctuations, especially unreliable divergences. He believed the market operates on multiple superimposed cycles of different lengths, and a good momentum indicator should reflect this multi-cycle nature.
Core Calculation Concept (Feel the Mix!):
Define “Buying Pressure” (BP): This is unique to UO. Williams believed true buying pressure isn’t just about the close, but how high the close is relative to the “True Low.”
True Low (TL) = Minimum of (Today’s Low, Yesterday’s Close)
Buying Pressure (BP) = Current Close – True Low
Define “True Range” (TR): Measures the price fluctuation range.
True Range (TR) = Maximum of (Today’s High, Yesterday’s Close) – Minimum of (Today’s Low, Yesterday’s Close)
Calculate “Average Buying Pressure” for Three Periods:
Separately calculate for the past N1 (short, e.g., 7), N2 (medium, e.g., 14), N3 (long, e.g., 28) periods:
Sum of Buying Pressure (Sum BP)
Sum of True Range (Sum TR)
Get three ratios: Avg1 = SumBP(N1)/SumTR(N1), Avg2 = SumBP(N2)/SumTR(N2), Avg3 = SumBP(N3)/SumTR(N3). These ratios reflect the relative strength of buyers pushing price up from the lows over different cycle lengths.
Weighted Average to Get UO:
UO = 100 * [(Weight1 * Avg1) + (Weight2 * Avg2) + (Weight3 * Avg3)] / (Weight1 + Weight2 + Weight3)
Larry Williams recommended weights of 4 (short), 2 (medium), 1 (long). This is special – the shortest cycle gets the highest weight! He believed short-term momentum was most important but needed the stability of medium and long cycles to “anchor” it and prevent overreaction.
So the formula becomes: UO = 100 * [(4 * Avg1) + (2 * Avg2) + (1 * Avg3)] / (4 + 2 + 1)
Simply Put: UO is like an experienced coach watching a game. They don’t just see how fast a player is running right now (short cycle), they also consider their stamina in the first half (medium cycle) and the overall game strategy (long cycle). Then, based on the importance of each factor (weighting), they give a composite score (UO value) reflecting the team’s true momentum!
「UO Logic: Blending 3 Cycles of ‘Buying Pressure’」
Overbought/Oversold Zones (OB/OS – 70/30 Standard, Auxiliary Use):
UO > 70 → Overbought. Price might be overextended short-term.
UO < 30 → Oversold. Price might be oversold short-term.
Usage Note: Like RSI/Stoch, don’t use OB/OS alone for reversal trades! Especially in strong trends. UO, due to its longer cycle blend, theoretically stays out of extreme zones longer than Stoch, but it’s not absolute.
Better Use: Wait for UO to exit the OB/OS zone (cross below 70 from above; cross above 30 from below) as an auxiliary confirmation of potential momentum shift.
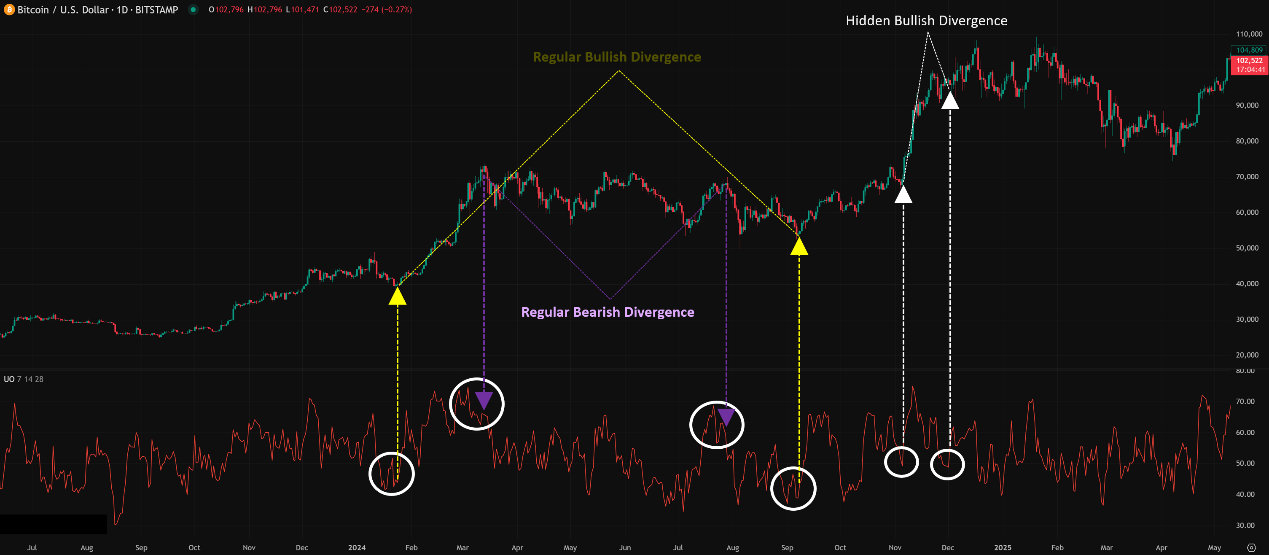
Divergence (UO’s Strongest Weapon!):
This is the usage most emphasized by Larry Williams! Because UO incorporates multiple cycles, its divergence signals are often considered more reliable and less prone to failure than single-period oscillator divergences!
Regular Bullish Divergence:
Price LL, but UO HL → Very significant potential bottom signal! Williams considered this one of the strongest buy signals, especially if the UO low forms below 30.
Regular Bearish Divergence:
Price HH, but UO LH → Very significant potential top signal! Especially if the UO high forms above 70.
Hidden divergence also applies for trend continuation signals.
「UO’s Ace: Reliable Regular Divergence Signals」
Zero Line / Centerline? (Not Relevant to UO):
UO oscillates between 0-100. There’s no traditional zero line. While 50 can be a neutral reference, it’s not used like the MACD zero line or RSI 50 line.
Advanced UO plays primarily revolve around its most reliable weapon – divergence.
Triple / Multiple Divergences:
If you see two or even three consecutive instances of divergence (price keeps making new lows/highs, but UO keeps making higher lows/lower highs), this is an extremely strong reversal signal!
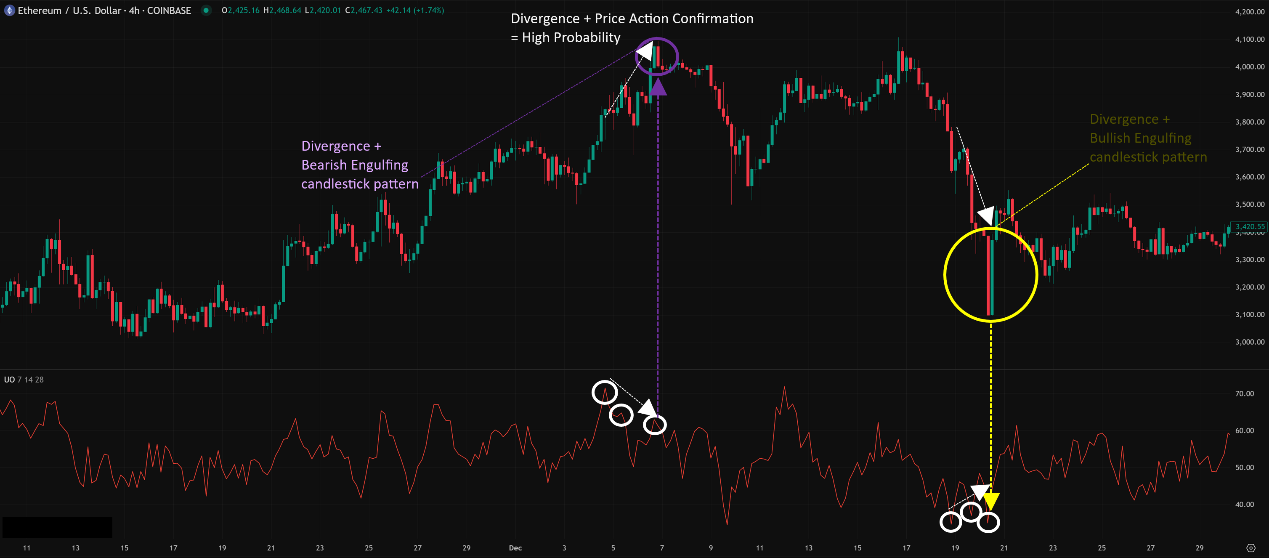
Confirming Divergence with Price Action (PA):
Bullish Divergence + Bullish PA/Breakout: E.g., Daily chart shows UO bullish divergence, and price forms a Hammer candlestick or breaks a downtrend line → Increases buy probability.
Bearish Divergence + Bearish PA/Breakdown: E.g., Daily chart shows UO bearish divergence, and price forms a Shooting Star or breaks an uptrend line → Increases sell/short probability.
「UO Advanced: Combining Divergence with Price Action」
Using OB/OS Zones to “Qualify” Divergence:
Williams himself emphasized:
Strongest Buy Signal: Price LL, UO HL, AND the UO low formed below 30.
Strongest Sell Signal: Price HH, UO LH, AND the UO high formed above 70.
Meaning, divergences occurring from overbought/oversold territory are considered more potent.
UO Parameter/Timeframe Breakdown (What Settings are Truly Ultimate?):
Core Parameters: (N1, N2, N3)
Default Parameters: (7, 14, 28)! This is the “golden combo” recommended by Larry Williams after extensive testing.
N1 = 7 (Short cycle, ~1.5 weeks)
N2 = 14 (Medium cycle, ~1 month)
N3 = 28 (Long cycle, ~2 months)
(Weights usually fixed at 4, 2, 1)
Why 7, 14, 28? These periods roughly double, capturing key short, intermediate, and longer-term trading cycles observed in markets.
Is (7, 14, 28) the Only Answer? For UO, this combination is the highly standard, highly respected setting! Much like Ichimoku’s (9, 26, 52), most professional traders stick with the defaults.
Attempts to Change Parameters?
Rarely seen, and generally not recommended!
Why?
Breaks the Design: UO’s core is blending the momentum from these specific 7/14/28 cycles. Changing them disrupts the balance and original intent.
Questionable Benefit: Little evidence suggests other parameter combinations consistently provide better signals. You might find a combo that works for a specific past period, but it’s likely overfitting.
Complexity: UO is already complex enough; randomly changing parameters makes analysis even harder.
Conclusion: The “hottest,” most effective parameter combo is undoubtedly the default (7, 14, 28)! Focus your energy on mastering signal interpretation (especially divergence!) with the defaults and on risk management.
「UO Parameters: (7, 14, 28) is the Gold Standard」

All Timeframes Applicable! UO’s design allows it to be used across different timeframes.
But Effectiveness & Focus Differ:
Ultra Short-Term (M1, M5, M15):
UO will be smoother than RSI/Stoch but likely still too volatile for reliable signals on its own. Divergences might appear but have low reliability. Might primarily watch extreme OB/OS readings. Not the ideal use case.
Intraday / Short Swing (H1, H4):
Starts becoming very useful! UO divergence on the H4 chart is particularly noteworthy for catching potential swing turning points. OB/OS zone exits can serve as auxiliary confirmation.
Swing / Long-Term (Daily, Weekly):
UO’s Best Stage! Optimal Application! On these longer timeframes, the market’s major cyclical momentum is more apparent, and UO’s multi-cycle advantage shines.
Usage: Catch major trend divergences predicting significant reversals. Weekly UO divergence signals carry substantial weight! Use it to confirm long-term entry/exit timing.
Summary: Which Unique Parameter Combo + Timeframe is Hottest & Most Effective? How to Use It?
Parameters: Default (7, 14, 28) IS the answer!
Timeframe: Daily / Weekly for major divergences is top-tier! H4 / H1 for catching swing divergences. M15 or lower effectiveness decreases.
Hottest / Most Effective Usage = Become a “Divergence” Expert + Wait Patiently for Quality Signals:
Divergence is the Soul of UO! Master identifying both regular and hidden divergence, especially those forming in OB/OS zones.
Use OB/OS Zones Mainly to Qualify Divergence Strength or as exit references (e.g., crossing below 70 / above 30).
Patience is Key! High-quality UO divergence signals aren’t frequent, especially on longer timeframes. You need to wait for them!
Always Combine with Price Action, S/R, Trend Analysis! UO provides momentum clues, not a crystal ball.
UO: Your Multi-Dimensional Momentum Scanner – Reducing Noise, Improving Signal Quality
The Ultimate Oscillator, by combining buying pressure across three distinct cycles, offers a smoother and potentially more reliable momentum perspective. Its advantages:
Reduces False Signals, especially compared to single-period oscillators.
Divergence signals are considered more reliable.
Standardized Parameters (7, 14, 28), less guesswork.
Disadvantages:
Lag still exists (though potentially better than single long-period indicators).
Calculation is relatively complex (though done by the platform).
In extremely strong trending markets, might stay in OB/OS zones or provide less clear signals.
「UO: The Multi-Dimensional Momentum Scanner」
The UO is a sophisticated instrument designed to improve signal quality. If you’re tired of the frequent false signals of RSI/Stoch, especially failed divergences, investing time to study the UO could bring new insights to your trading.
Next Steps:
Add the Ultimate Oscillator (use default 7, 14, 28) to your H4, Daily, and Weekly charts.
Focus on practicing identifying UO bullish and bearish divergences, especially those forming beyond the 70/30 levels.
Compare UO divergence signals with those from RSI/Stoch on the same chart. Feel if UO truly provides “fewer false signals.”
Observe UO’s behavior in strong trending vs. ranging markets.
Backtest! Test trading strategies centered around UO divergence.
Hope you master this ultimate weapon and achieve greater stability in your trading wins!