Physical Address
304 North Cardinal St.
Dorchester Center, MA 02124
Physical Address
304 North Cardinal St.
Dorchester Center, MA 02124
Alright, all you Market Volatility Dominators, Crypto breakout hunters, and forward-thinking traders looking to know when the market’s about to “go big”! Last time we dissected the awesome Bollinger Bands (BB), and today we’re diving deep into its “heart chamber” to break down an indicator specifically designed to measure how wide or narrow those BBs are – the Bollinger Bands Width (BBW)! Think of it as the “pressure gauge” for the BBs, telling you if the market is “building up steam” and ready for a major explosion!
What the heck is BBW? How does it work with Bollinger Bands (BB)?
BBW isn’t a channel plotted on the price chart itself; it’s a separate oscillator usually displayed in a window below the price chart. It typically consists of just one line.
Core Function: Measures the “distance” or “width” between the upper and lower Bollinger Bands.
Calculation (Common): (Upper Band – Lower Band) / Middle Band
This calculation normalizes the width into a relative percentage value, making it easier to compare relative volatility across different times or assets.
Some platforms might simply use the absolute difference Upper Band – Lower Band. The effect is similar, but the numerical scale differs.
Interpretation:
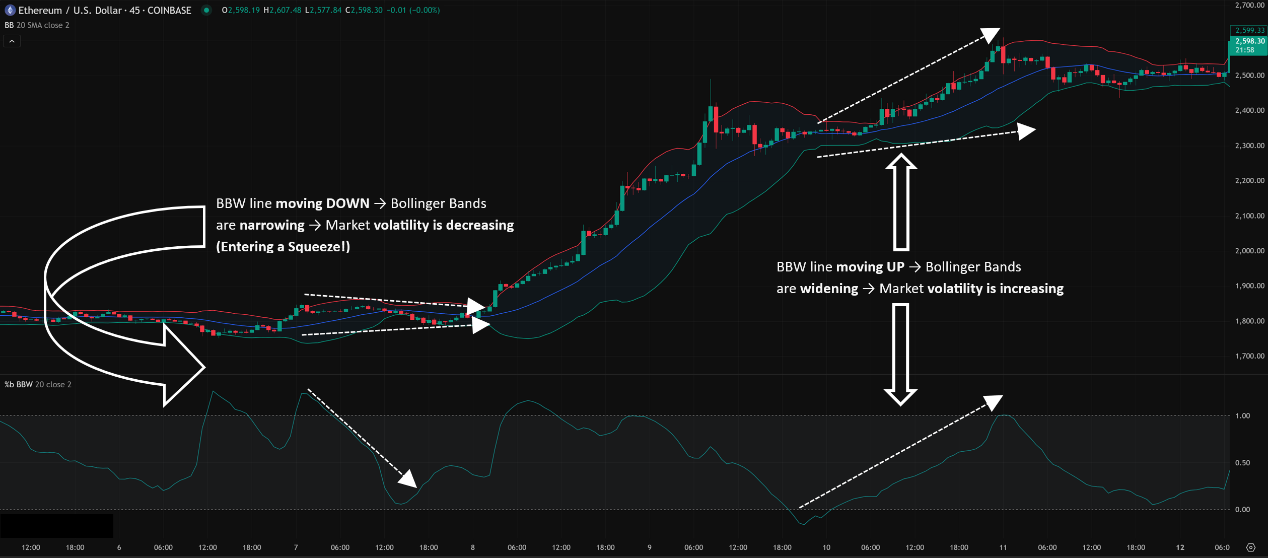
BBW line moving UP → Bollinger Bands are widening → Market volatility is increasing.
BBW line moving DOWN → Bollinger Bands are narrowing → Market volatility is decreasing (Entering a Squeeze!).
「BBW Structure: Measuring Bollinger Band Width = Market Volatility」
Relationship between BBW and BB:
BB is the main actor, providing the price channel and relative high/low context.
BBW is the supporting actor, solely dedicated to quantifying the BB channel’s width, giving you an objective reading of volatility. You can see at a glance if a Squeeze is truly “extremely narrow.”
BBW’s Origin Story & Design: Quantifying the “Pressure”
BBW naturally came into being alongside Bollinger Bands, both creations of John Bollinger. He realized that just visually estimating the band width wasn’t always objective enough, especially for comparing volatility across different periods or precisely identifying the extreme state of a Squeeze.
Design Philosophy:
Quantify Volatility: Provide a numerical value to directly assess the degree of market volatility.
Objectively Identify the Squeeze: When BBW drops to historical lows, it’s the most objective confirmation of a Squeeze.
Foreshadow Potential Breakouts: Periods of extremely low volatility (Squeezes) rarely last forever. The market builds energy and often breaks out directionally afterward. BBW acts as the alarm for this “pressure buildup.”
The Core: Just a mathematical expression of the distance between the bands! Simple but incredibly useful!
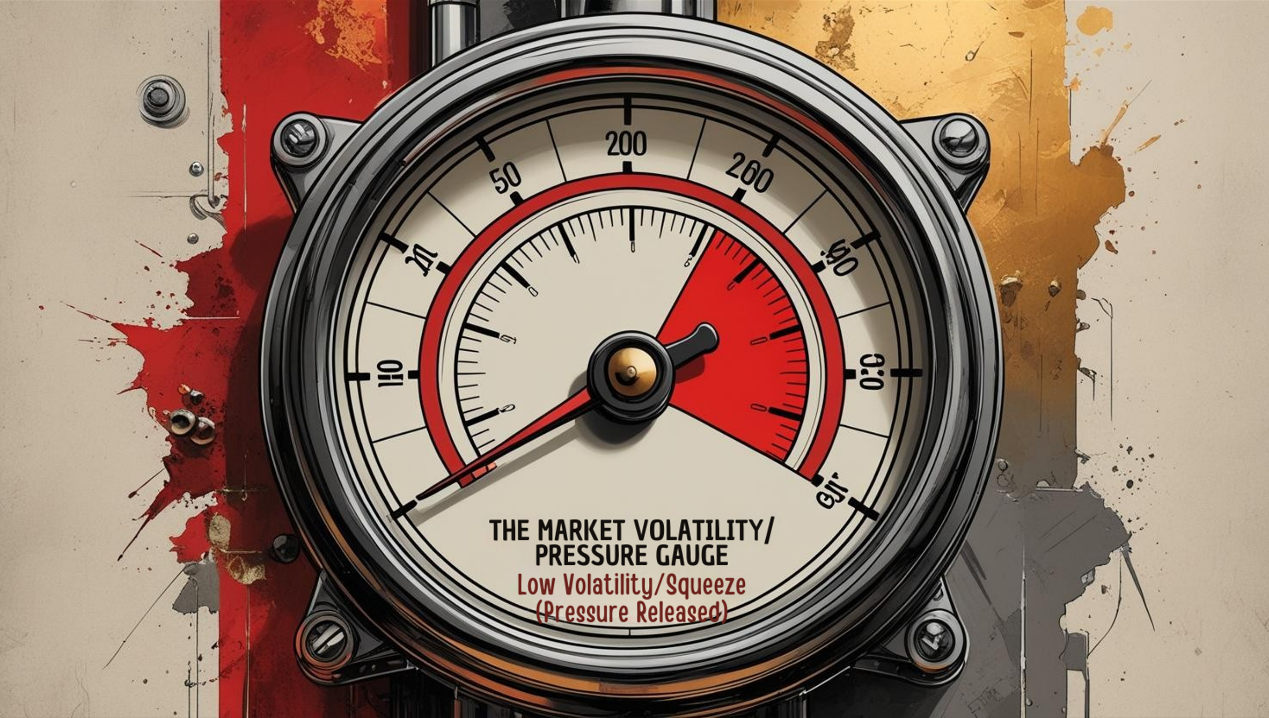
「BBW Logic: The Market Volatility/Pressure Gauge」
The single most important basic use of BBW is identifying the Bollinger Band Squeeze!
Finding the Squeeze (The Holy Grail Signal!):
Watch the BBW indicator line. When the BBW line drops to a very low level (usually judged relative to its own recent historical lows) → Confirms the market has entered a Squeeze state.
Meaning: Market volatility is compressed to an extreme. Buyers and sellers are temporarily balanced, but this equilibrium is fragile, like a spring coiled tight, ready to powerfully uncoil!
Action: A Squeeze itself is NOT a buy/sell signal. It’s a “High Alert” signal! It tells you the market is likely about to “pick a direction” and make a significant move. Time to prepare your breakout strategy.
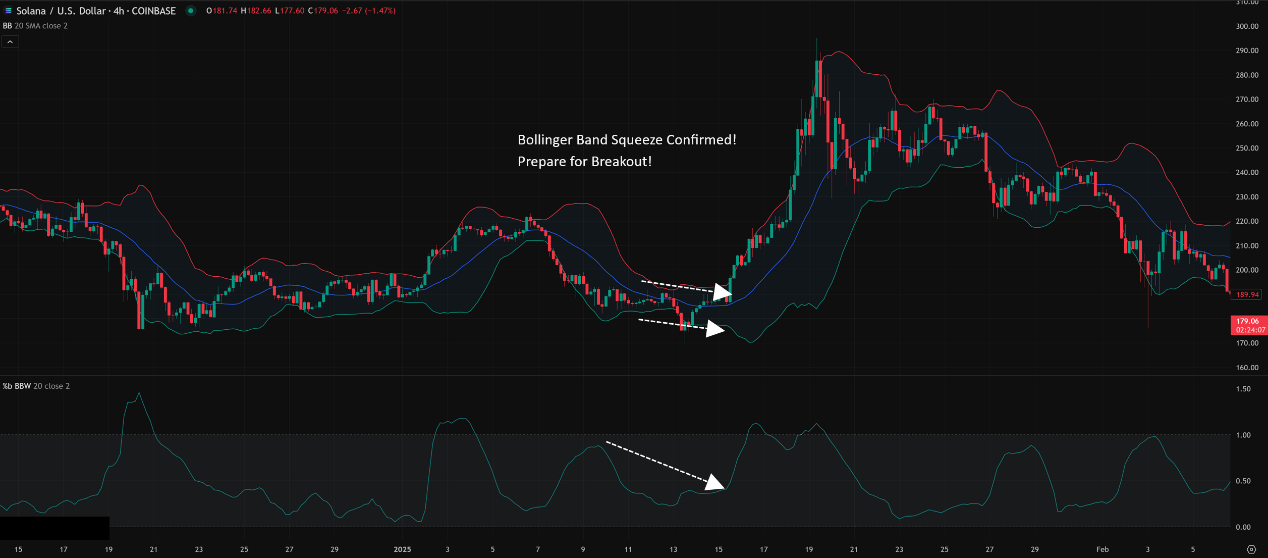
「BBW Core Use: Identifying the Squeeze Low Volatility State」
Observing Volatility Expansion:
When the BBW line surges upwards sharply from a low level → Confirms market volatility is exploding, usually accompanying a directional price breakout.
This can confirm whether your Squeeze breakout trade is likely following a genuine move.
Utilizing Volatility Cycles:
Market volatility is often cyclical: High Volatility (High BBW) -> Low Volatility (Low BBW / Squeeze) -> High Volatility… and repeat.
How to Use:
When BBW reaches historically high levels and starts to turn down → Might suggest the preceding trend/volatility burst is exhausted short-term. The market may enter a resting/consolidation phase, and volatility might contract. Consider tightening stops on trend-following trades or watching for counter-trend opportunities (carefully!).
When BBW stays at historically low levels for a while → Increases the probability of the next volatility expansion (big move) occurring soon. Patience while waiting for the breakout becomes key.
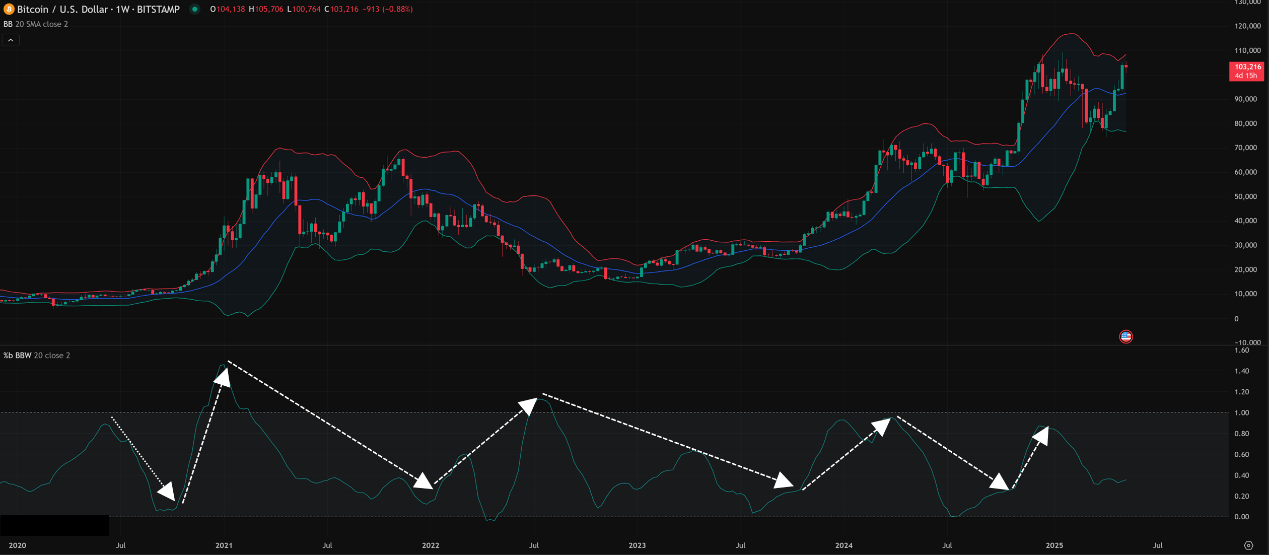
「BBW Advanced: Observing Volatility Cycles」
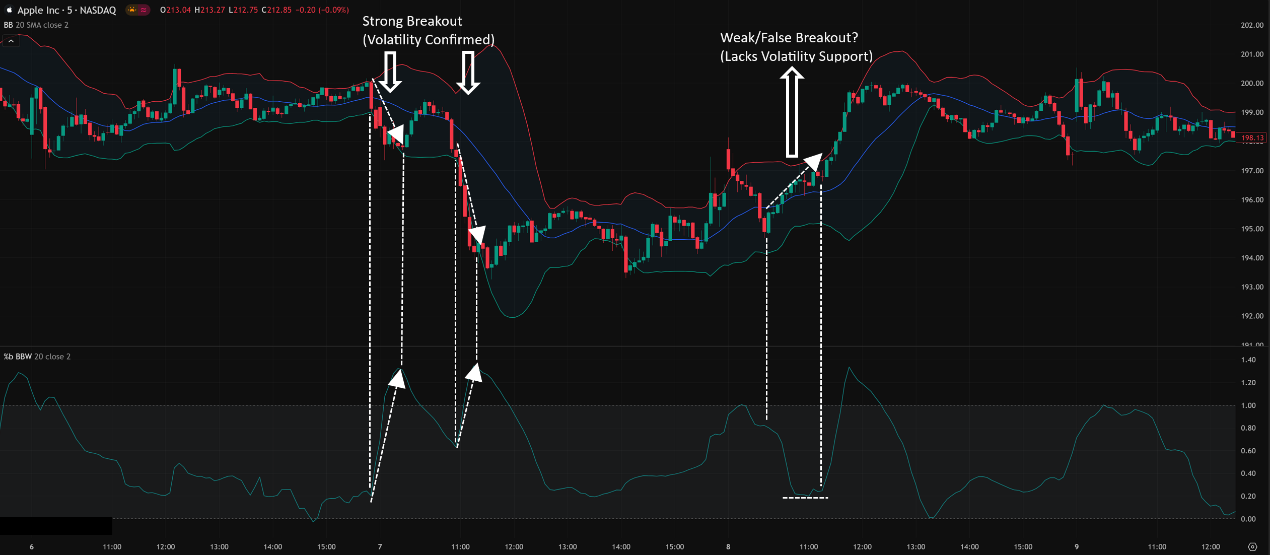
Confirming Breakout Strength:
After a Squeeze, price breaks out up or down.
If the breakout occurs simultaneously with BBW spiking sharply upwards from extreme lows → Confirms the breakout is accompanied by volatility expansion, making the breakout more reliable and likely to travel further.
If price breaks out, but BBW barely reacts or stays low → This might be a false breakout! Breakouts without volatility expansion backing them are prone to failure.
「BBW for Breakout Confirmation: Volatility is Key」
Potential Trend Exhaustion Warning:
After a strong trend (price walking the bands), if BBW starts to decline significantly from high levels, it might suggest the trend’s momentum/volatility is waning. Be alert for potential corrections or consolidation.
Core Parameters: Inherited from Bollinger Bands (N, K)
Important! BBW itself usually has NO independent parameters to set! Its value is entirely determined by the parameter settings of the Bollinger Bands on your chart!
So, the “parameters” for BBW are the BB parameters:
N (SMA & Std Dev Period): Period for the BB middle band and standard deviation. Default = 20.
K (Std Dev Multiplier): The standard deviation multiplier. Default = 2.
Parameter Settings Analysis & “Hottest” Combo Discussion:
Since BBW follows BB parameters, is using the BB gold standard (20, 2) best?
Absolutely! Because BBW’s primary use (especially identifying the Squeeze) is rooted in the statistical meaning and market consensus around BB(20, 2). The “historical lows” of a BBW calculated from standard BB(20, 2) are the most meaningful reference points.
What happens to BBW if BB parameters are changed?
Shorter N / Smaller K (Makes BB narrower): BBW’s overall value will be lower, it will fluctuate more frequently, and Squeezes will appear more often, but many might be insignificant noise.
Longer N / Larger K (Makes BB wider): BBW’s overall value will be higher, the line smoother, and Squeezes will become very rare.
Any “Unique” Combo to make BBW work better?
Nope! Don’t think that way! Instead of trying to tweak parameters to make BBW “better,” focus on understanding the signal significance of the standard BBW(20, 2) and how to combine it with price action to trade the Squeeze breakout direction.
**Conclusion: The “hottest,” most effective combo is using the Bollinger Bands Width calculated from standard Bollinger Bands (20, 2)! No need to overcomplicate it.
「BBW Parameters = BB Parameters (Stick to 20, 2)」

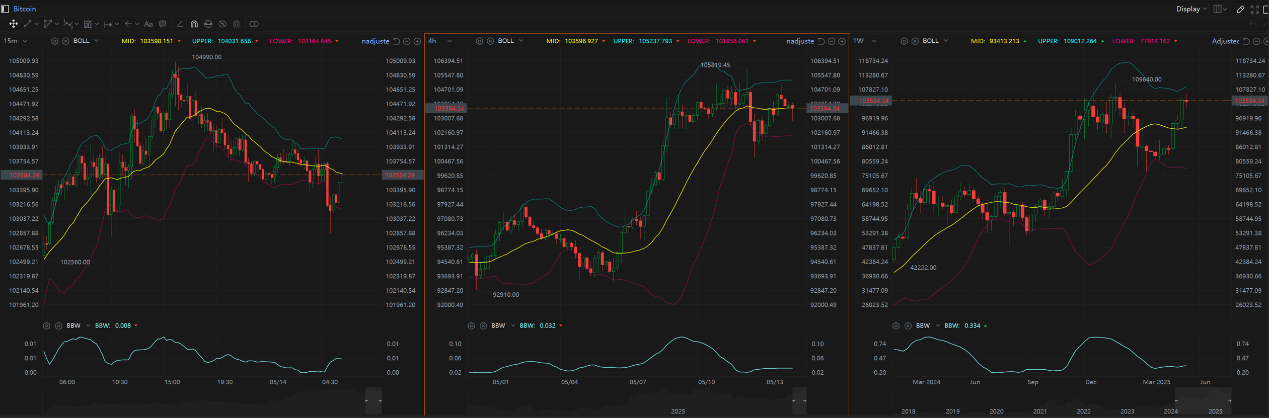
Timeframe Analysis:
All Timeframes Applicable! BBW can be used on any timeframe, but understand the meaning of a Squeeze differs.
Timeframe Dictates Squeeze Significance:
Ultra Short-Term (M1, M5, M15): You’ll see many very short-term Squeezes. Breakouts following these might only last a few minutes to maybe an hour. Suitable for Scalpers catching quick pops.
Intraday / Short Swing (H1, H4): Common usage zone! Squeezes on H1/H4 often precede moves lasting several hours to a few days. Day Traders and Short-term Swing Traders focus heavily on Squeezes here.
Swing / Long-Term (Daily, Weekly): Squeeze signals carry the most weight! A Daily Squeeze can precede trends lasting weeks or months. A Weekly Squeeze might signal the start of a multi-month or even year+ major move! Swing Traders and Position Traders must watch these!
「BBW Timeframes: Longer Period = Greater Squeeze Significance」
Parameters: Use BBW derived from standard BB(20, 2)! No doubt!
Timeframe: All usable, match it to your trading style! H4/Daily Squeezes are most relevant for swing trading.
Hottest / Most Effective Usage = Become a Squeeze Expert + Breakout Confirmation Master:
Core Strategy: Identify the Squeeze! When BBW hits historical lows, get ready to pounce on the breakout.
Squeeze Doesn’t Predict Direction! Never guess! Wait for a clear price breakout above the upper BB or below the lower BB.
Confirm Breakout with Rising BBW! A price breakout accompanied by BBW sharply rising from lows greatly increases reliability.
Combine with Volume! Genuine breakouts usually have expanding volume.
Watch for Highs Turning Down. BBW falling from extreme highs can signal contracting volatility and potential trend pausing.
BBW: Your Market “Volatility Radar,” Alerting You to Energy Build-up
Bollinger Bands Width is a straightforward yet extremely practical tool. Its value lies in:
Objectively Quantifying Market Volatility.
Clearly Identifying Squeeze Conditions, warning of potential big moves.
Confirming the Volatility Support behind breakouts.
Helping understand Volatility Cycles.
Its limitations:
Provides No Directional Signal.
Has no independent parameters; entirely dependent on BB settings.
Requires combination with price action and other tools to determine breakout direction.
「Bollinger Bands Width: The Market Volatility Radar」
Mastering BBW, especially how to use the Squeeze to set up trades, is fundamental to many successful breakout strategies. Add it to your analytical workflow, and you’ll gain a deeper understanding of the market’s “Breathing” and “Power.”
Next Steps:
Add Bollinger Bands Width to the indicator window below your chart (ensure it’s based on BB(20, 2)).
Practice identifying Squeeze patterns (BBW hitting historical lows) on different timeframes.
Observe the price breakout direction after a Squeeze and whether BBW rose simultaneously.
Note what typically happens to the market when BBW falls from historical highs.
Backtest! Test strategies based on BBW Squeeze breakouts.
Hope you become volatility masters and catch every market explosion! ⚡️