Physical Address
304 North Cardinal St.
Dorchester Center, MA 02124
Physical Address
304 North Cardinal St.
Dorchester Center, MA 02124
Alright Crew! Let’s keep the momentum going! After breaking down the ATR “risk ruler” last time, today we’re dissecting another heavyweight indicator in the technical analysis world, a secret weapon specifically designed to help us “track money flow” and “decode what the big players are doing” – introducing the OBV (On-Balance Volume) indicator!
Yo yo yo, you always hear people talking about “following the smart money” or “seeing what the whales are doing,” but how do you actually know if big money is flowing in? When price is rising, is it genuine buying pressure, or just retail FOMO? When price is falling, are the big guys dumping their bags? OBV is a classic tool designed to try and answer these questions! It combines Volume with price changes to show you the market’s “internal strength.”
Wanna learn how to use OBV to confirm trends and even catch potential reversal signals? Wanna know how to master this parameter-less indicator? Stick around as we dig deep into the secrets of OBV! Let’s get it!
OBV is pretty much the “granddaddy” of volume-based indicators.
The Inventor: Joe Granville – This market analyst, famous in the mid-20th century, officially introduced the OBV concept in his 1963 book, Granville’s New Key to Stock Market Profits. He was one of the earliest analysts to heavily emphasize the importance of volume.
Core Philosophy: “Volume Precedes Price” – Granville believed that changes in volume often reflect the true supply and demand dynamics before significant price changes occur. He argued that “Smart Money” (institutional investors, whales) starts showing its hand through volume before major price moves happen.
If whales want to buy, they’ll quietly accumulate while prices are still low (or even dipping slightly). Volume might gently increase during this time, and OBV would start ticking up first.
If whales want to sell, they’ll distribute shares while prices are still high (or even making new highs) as retail chases the rally. Volume might not support the price rise, and OBV could start flattening or heading down.
Purpose: Tracking the Flow of “Money” – OBV was Granville’s tool to quantify this “volume pressure,” using cumulative volume to show whether funds were primarily flowing into or out of an asset.
So, OBV was born from a powerful belief: Volume is the fuel that drives prices, and OBV is the dashboard gauge telling us if the “fuel tank” is being filled or leaking.
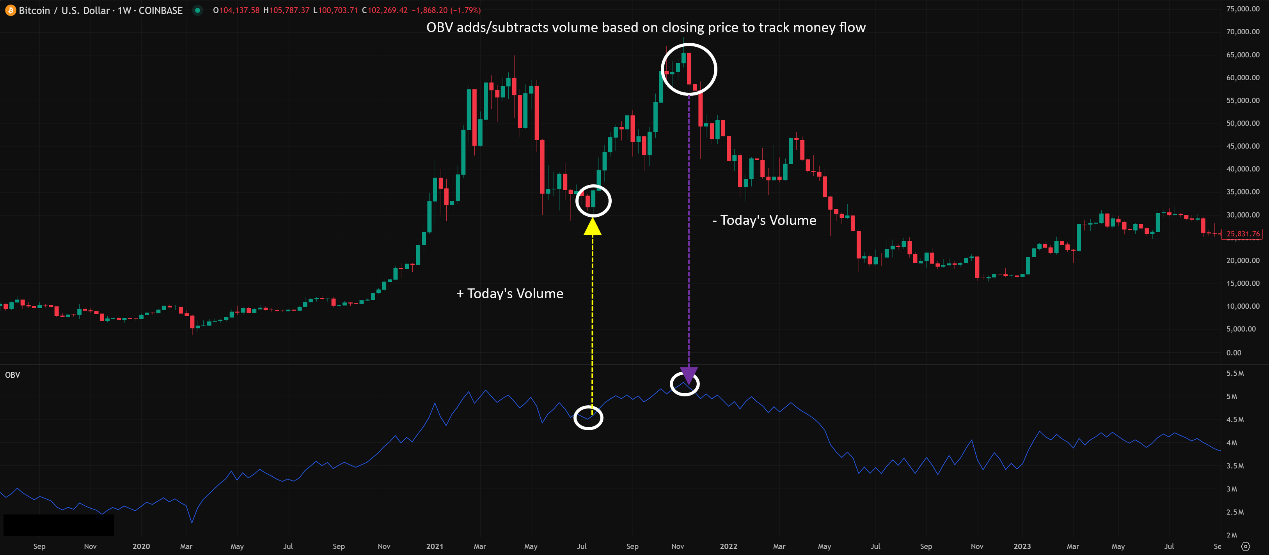
The calculation for OBV is incredibly simple, but the logic behind it is insightful.
Set a Starting Point: Begin on any given day; the OBV value can start at 0 or the day’s volume.
Add or Subtract Volume Based on Daily Close Price Change:
If Today’s Close > Yesterday’s Close (Price Up):
Today’s OBV = Yesterday’s OBV + Today’s Volume
(Meaning: Price went up with volume, that volume represents buying pressure, add it.)
If Today’s Close < Yesterday’s Close (Price Down):
Today’s OBV = Yesterday’s OBV – Today’s Volume
(Meaning: Price went down with volume, that volume represents selling pressure, subtract it.)
If Today’s Close = Yesterday’s Close (Price Unchanged):
Today’s OBV = Yesterday’s OBV (No change)
(Meaning: Price didn’t move, buying/selling forces balanced out volume-wise, OBV stays put.)
Keep Accumulating: OBV is a Cumulative indicator. It keeps adding or subtracting the daily volume according to the rules, forming a continuous line.
Key Point: The Absolute Value of OBV is Meaningless!
Seeing an OBV of 1 billion or -5 million doesn’t matter in itself, because the starting point is arbitrary.
What matters is the direction and pattern of the OBV line! Is it trending up, down, or sideways? Is it confirming the price trend or diverging from it? That’s the critical analysis.
Think of a Tug-of-War:
Volume is like the number of people pulling on each side each day.
Price goes up = Buyers won today. Add today’s number of people (volume) to the buyers’ team score (OBV increases).
Price goes down = Sellers won today. Add today’s number of people (volume) to the sellers’ team score (OBV decreases, effectively).
The OBV line shows which team’s cumulative strength is growing over time.
「OBV Calculation Logic Explained」
Level 1: Basic Uses – Confirmation & Divergence
The two most common, fundamental ways to play with OBV:
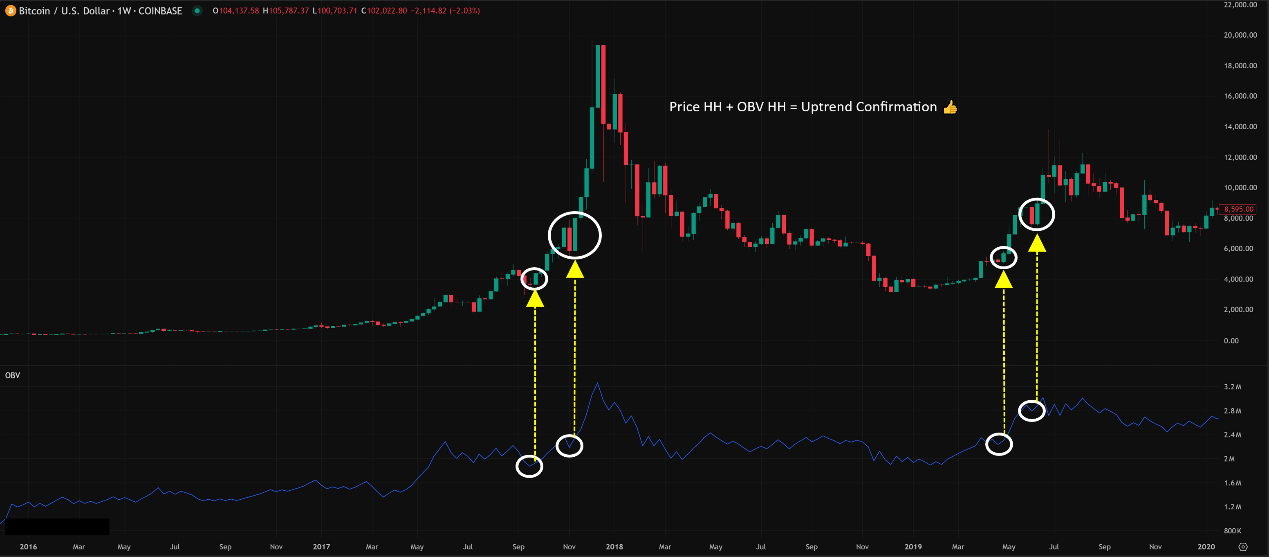
Principle: A healthy trend should ideally see volume confirming price action (“volume goes with the trend”). OBV should move in sync with the price trend.
How to Use:
Price New High + OBV New High: Uptrend looks healthy, volume supports the rise, trend likely to continue.
Price New Low + OBV New Low: Downtrend looks sustained, volume confirms selling pressure, trend likely to continue.
Price Sideways + OBV Sideways: Market is directionless for now, volume shows no clear dominance.
Warning Sign: If price makes a new high, but OBV fails to make a new high or even declines, be cautious! (This leads to divergence, discussed next).
「OBV Trend Confirmation Example (Uptrend)」
2. Divergence: OBV’s Strongest Weapon!
Principle: When price action and OBV action disagree, it’s a potential reversal signal. It suggests that volume (money flow) is no longer supporting the price direction.
Two Main Types:
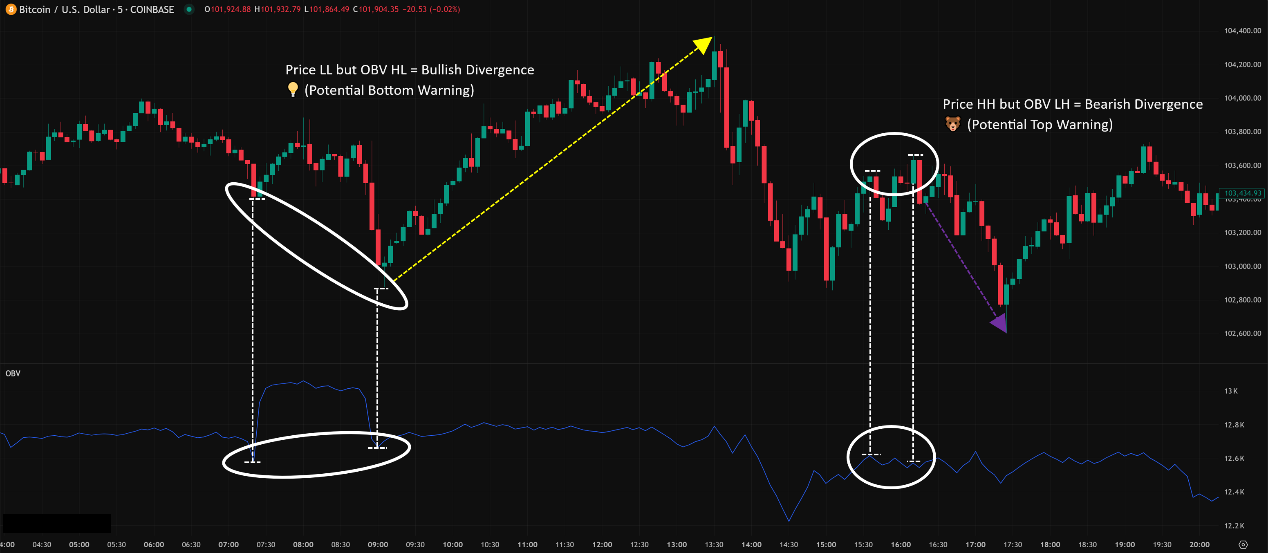
Bullish Divergence:
Pattern: Price makes a Lower Low (LL), but OBV fails to make a new low, instead forming a Higher Low (HL).
Meaning: Even though price broke the previous low, the selling volume wasn’t as strong as before, or buyers might be quietly accumulating at the lows. Selling pressure is weakening, potentially signaling a bottom.
Bearish Divergence:
Pattern: Price makes a Higher High (HH), but OBV fails to make a new high, instead forming a Lower High (LH).
Meaning: Even though price broke the previous high, the buying volume wasn’t as strong, the rally might be losing steam, or smart money could be distributing into strength. Buying pressure is weakening, potentially signaling a top.
Important Note: Divergence is a warning sign, not a direct trade signal! It suggests the trend might be weakening. Look for confirmation from price action (e.g., reversal patterns, key level breaks) or other indicators before acting. Divergence can persist for a long time before a reversal occurs.
「OBV Bullish Divergence & Bearish Divergence Example」
Think OBV is just about confirmation and divergence? Think again!
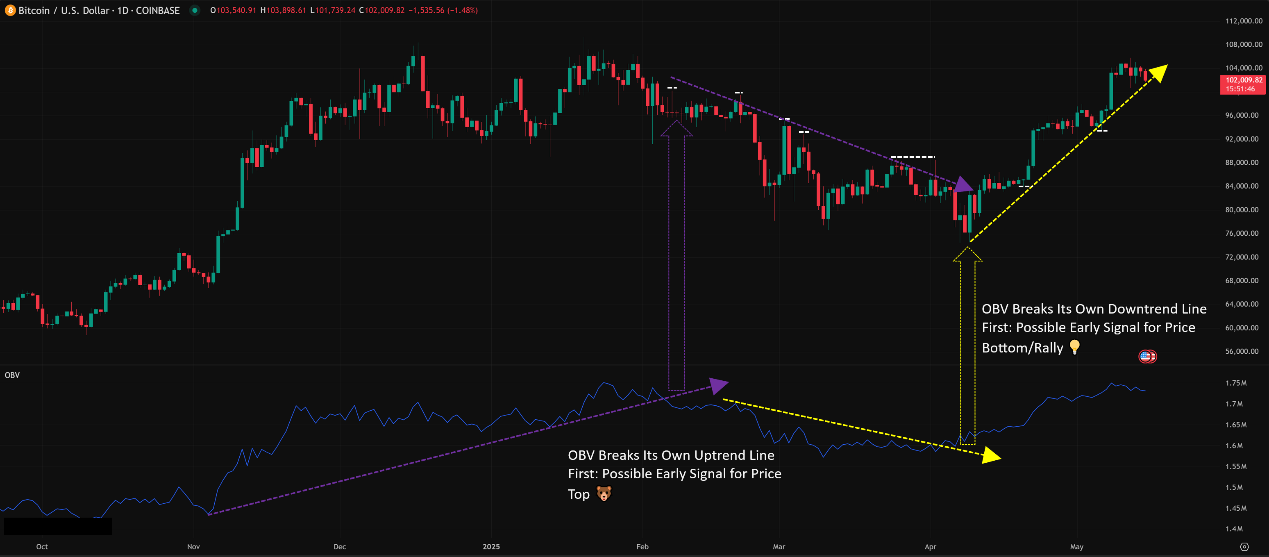
A. OBV Trendline Break: Potential Leading Signal!
The Play: Draw trendlines directly on the OBV indicator line itself (just like you do on the price chart).
The Key Signal: When OBV breaks above its own descending trendline, or breaks below its own ascending trendline, it can sometimes signal a potential trend change before the price itself breaks its trendline!
OBV breaks UP through descending trendline: Might suggest buying pressure is building under the surface, potentially preceding an upward price breakout.
OBV breaks DOWN through ascending trendline: Might suggest selling pressure is increasing or buying power is fading, potentially preceding a downward price breakdown.
Why Leading? It goes back to Granville’s core idea: volume leads price. Changes in money flow might show up in the OBV trend first.
How to Use: Use this OBV break as an early alert to watch closely for a corresponding breakout opportunity on the price chart.
「OBV Trendline Break Example」
B. OBV + Moving Average (OBV + MA): Smoothing & Crossover Signals
The Play: Add a Moving Average (MA) directly onto the OBV indicator line (e.g., a 9, 20, or 50-period SMA or EMA).
How to Use:
Smoothing: The MA provides a smoother representation of the OBV trend direction.
Crossover Signals: When the OBV line crosses above its MA, it can be seen as a potential buy signal (short-term money flow stronger than average). When OBV crosses below its MA, it can be a potential sell signal.
Confirmation: These crossovers are best used to confirm price action or signals from other indicators, not standalone.
Parameter Choice: The MA period depends on your style. Shorter periods react faster but give more false signals; longer periods are smoother but lag more. 20 or 50 periods are common.
C. OBV as a Strategy Filter
Concept: Use the status of the OBV (trending up/down, diverging, breaking trendlines) as a condition to either “approve” or “veto” signals generated by your primary trading strategy.
Example:
Your strategy (e.g., MA crossover) gives a buy signal. But you notice OBV is trending down or showing bearish divergence with price. You might decide to skip the trade or reduce your position size because volume doesn’t support the move.
Conversely, if a buy signal occurs while OBV is strongly trending up or just broke its downtrend line, the signal’s reliability might be considered higher.
D. Parameter Settings & Timeframes (The Parameter Paradox!)
Does OBV Have Parameters? Nope! This is one of OBV’s unique features. Its calculation doesn’t require any user-defined period settings (like the 20 for MA or 14 for RSI). It’s purely based on cumulative volume adjusted by daily price closes.
So What’s Left to Discuss? Timeframes! Even without parameters, the Timeframe you view OBV on makes a huge difference:
Short Timeframes (M1, M5, M15): OBV line will be extremely choppy, spiky, and change rapidly. Might capture very short-term flows but is full of noise, making trendlines and divergence hard to spot reliably.
Medium Timeframes (M30, H1, H4): OBV line becomes smoother; trends and divergences are easier to identify. Suitable for Day Trading and Swing Trading.
Long Timeframes (D1, W1): OBV line is the smoothest, trends are most apparent. Shows macro, long-term money flow shifts. Divergences or trendline breaks on longer timeframes are generally considered more significant.
How Global Traders Play It?
Since there are no parameters to argue about, usage focuses on the core concepts: confirmation, divergence, and OBV trendline breaks.
Traders analyze OBV on their primary trading timeframe while potentially referencing the OBV trend on a higher timeframe for context (e.g., an H1 trader might check the H4 or D1 OBV trend).
Crypto traders might pay closer attention to H1/H4 OBV due to faster market reactions. Stock/commodity traders might focus more on D1/W1 OBV.
E. Which Combos Are “Hot” & Effective? (Best Practices, Not Magic Combos)
Since OBV lacks parameters, “combos” refer to usage combinations rather than parameter sets.
The Golden Combo: Price Action + OBV Divergence/Confirmation + Other Confirmation Indicator
How to Use:
Use OBV to spot potential divergence (warning).
Wait for Price Action confirmation (e.g., reversal candlestick pattern, break of key S/R, new trend structure forming).
Optionally, add confirmation from another type of indicator (e.g., RSI exiting overbought/oversold, MACD crossover).
Effectiveness: Uses OBV for early warning, price for final confirmation, plus an extra layer of validation. This is the most robust approach used by many professional traders.
The Leading Signal Combo: OBV Trendline Break + Price Pattern
How to Use:
Watch for OBV to break its own significant trendline.
If it breaks, closely monitor the price chart for developing reversal/breakout patterns (e.g., Head & Shoulders bottom, Double Bottom, Triangle breakout).
When the price pattern confirms the break, the earlier OBV signal is validated.
Effectiveness: Offers the potential for earlier entry compared to waiting solely for price breakouts.
F. Optimal Parameter Combos? (The Final Answer on Parameters)
For OBV, the answer is simple: There are NO parameters to set!
You don’t need to worry about using 10 periods or 20. What you need is:
Understand OBV’s Core Logic: How it reflects money flow.
Master the Core Uses: Confirmation, Divergence, OBV Trendlines.
Choose Appropriate Timeframes: Match your trading style. D1 or H4 are often more reliable.
ALWAYS Combine with Price Action: OBV is supplementary; price is primary.
Practice Observation: Experience helps you better interpret subtle OBV changes.
OBV, while simple in calculation and parameter-free, is a powerful weapon in the technical analysis arsenal. It’s a classic indicator focused squarely on the core principle of “volume confirms price.”
It helps you:
Confirm Trend Health: See if volume backs the move.
Spot Potential Reversals: Detect price/volume discrepancies via divergence.
Find Early Clues: OBV trendline breaks can sometimes lead price.
Filter Trade Signals: Avoid entries where volume isn’t supportive.
For young traders looking to gain a deeper understanding of “Smart Money” movements and improve their odds in crypto and other markets, learning to use OBV is like gaining an extra pair of eyes to see the market’s “internal strength.”
Remember:
OBV’s value is in its direction and patterns, not its absolute level.
Divergence is powerful but requires confirmation.
OBV trendline breaks are an advanced technique worth watching.
Always analyze in conjunction with price and other indicators.
Hope this OBV deep dive was helpful! Go add it to your charts and start practicing how to “read the volume”! Peace out! ✌️