Physical Address
304 North Cardinal St.
Dorchester Center, MA 02124
Physical Address
304 North Cardinal St.
Dorchester Center, MA 02124
Okay Okay! What’s up, Trader Crew! Welcome back to our Technical Indicator Lab! The heavy hitter we’re decoding today was created by a true market master and is specifically designed to measure the pressure of money flowing in or out – it’s the CMF (Chaikin Money Flow) indicator!
Thought MFI was cool, combining price and volume? CMF plays a different game! It laser-focuses on one thing: Did the price close nearer its high or its low for the period? Then it mixes that with volume to judge which side – buying or selling pressure – is winning! Simply put, it tries to answer: “At the closing bell, was the money leaning towards buying or selling?”
Wanna know how CMF helps you read market sentiment, confirm trends, and even spot potential turning points? Wanna learn how to level up your game with this widely used indicator? Enough talk, let’s dive deep into CMF’s core logic and practical uses right now! Let’s Go!
CMF’s creation is tied to a big name on Wall Street.
The Inventor: Marc Chaikin – This veteran market technician, active for decades primarily in stock analysis, invented several indicators bearing his name, with CMF being one of the most famous. He also founded Chaikin Analytics.
Design Basis: Accumulation/Distribution Line (A/D Line) – Chaikin believed that while volume itself is important, what’s more crucial is where the price closes within the period’s range (High to Low).
If the close is near the period’s high, even if the price didn’t rise much overall, it suggests buying pressure (Accumulation) pushed the price up into the close.
If the close is near the period’s low, even if the price didn’t fall much, it suggests selling pressure (Distribution) pushed the price down into the close.
CMF’s Purpose: Quantifying Short-Term Money Flow Pressure – Chaikin Money Flow builds on the core A/D Line concept, but instead of being cumulative, it calculates the average money flow strength over a specific period (e.g., 20 days). He wanted an oscillator moving above and below zero to directly show the recent balance of buying vs. selling pressure.
So, CMF was designed to capture the battle between buyers and sellers near the close, combine it with volume, and quantify the net pressure of money flowing in or out over a defined period.
CMF’s calculation is simpler than MFI’s, but different from OBV’s. Its core is the “close location.”
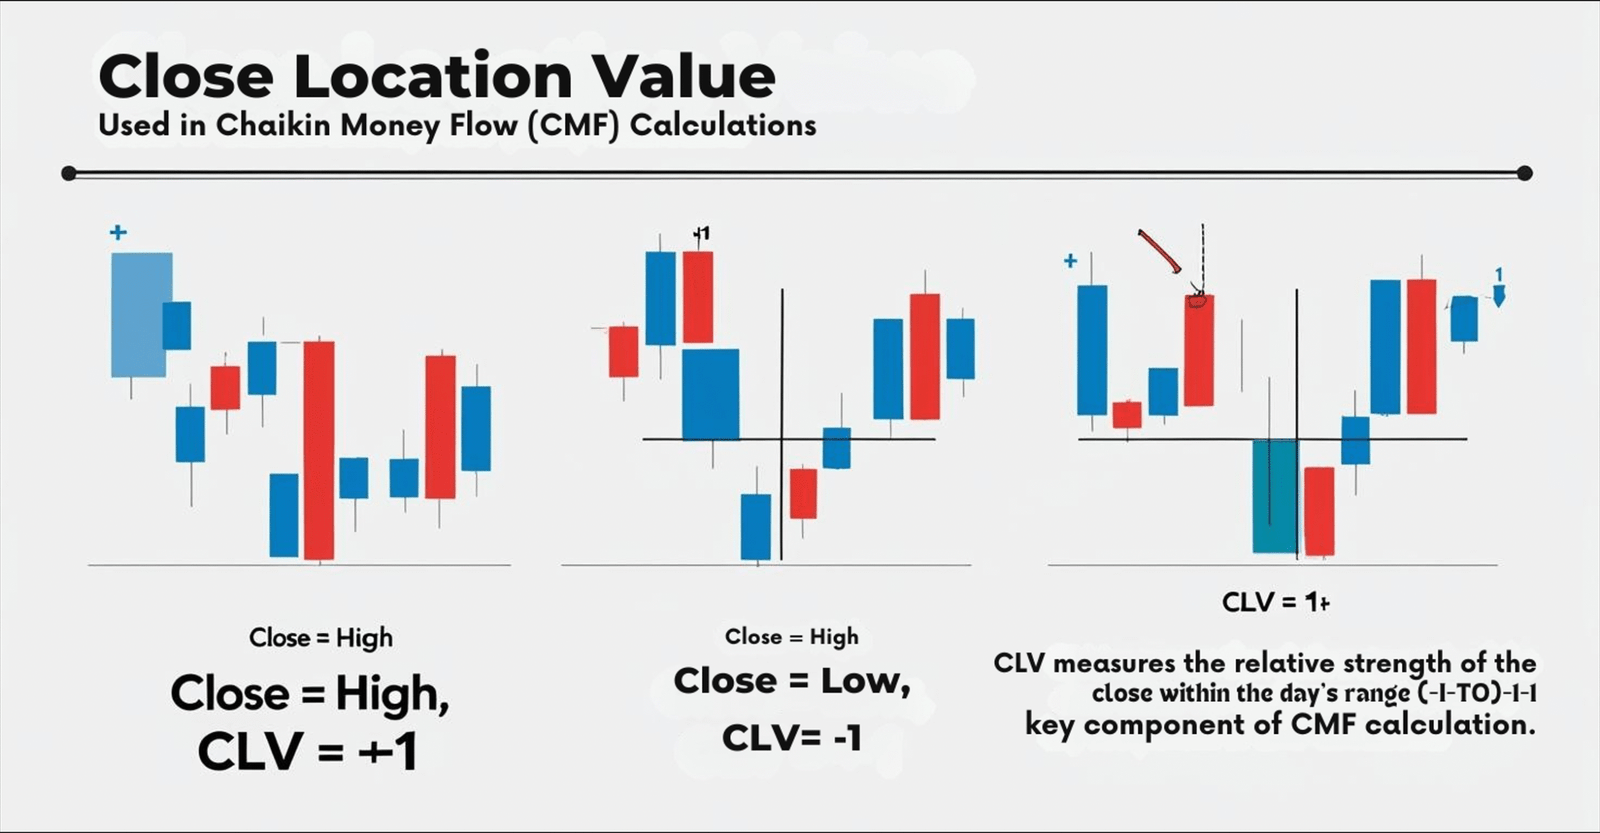
Step 1: Calculate Close Location Value (CLV)
CLV for each period = [ (Close – Low) – (High – Close) ] / (High – Low)
Let’s break it down:
(C – L) is how much price rose from the low to the close.
(H – C) is how much price fell from the high to the close.
The numerator essentially asks: Was the close closer to the high or the low?
The denominator is the total range for the period.
Result: CLV is a value between -1 and +1.
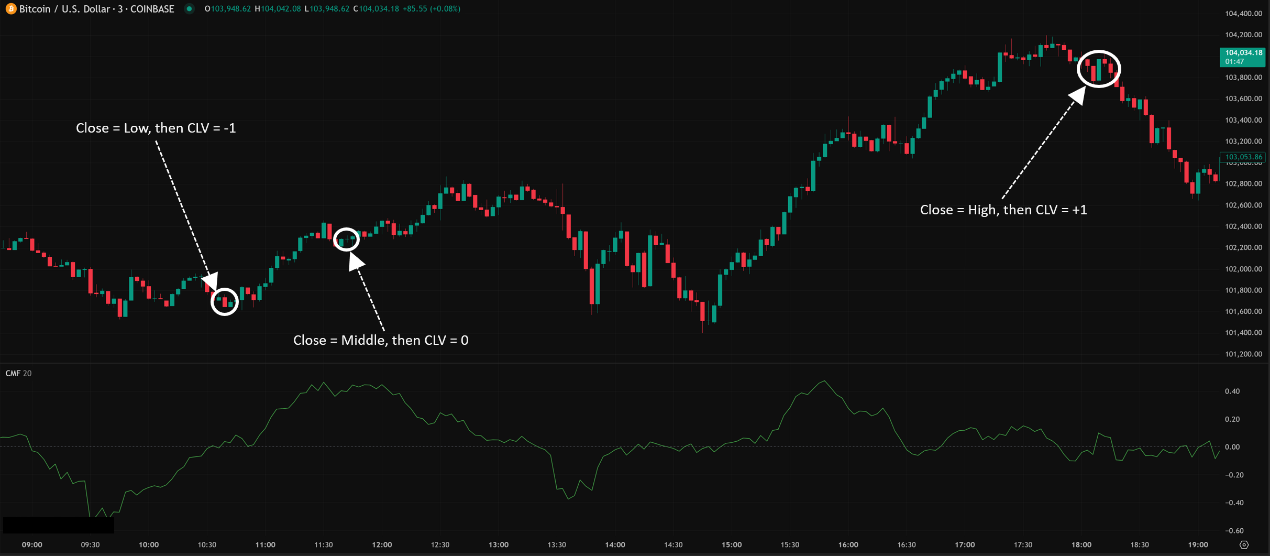
Close at the absolute High, CLV = +1.
Close at the absolute Low, CLV = -1.
Close exactly in the middle, CLV = 0.
Purpose: Quantifies the relative position of the close within the period’s range. Closer to +1 means a stronger close; closer to -1 means a weaker close.
Step 2: Calculate Money Flow Volume (MFV)
MFV for each period = Close Location Value (CLV) * Volume for that period
This step multiplies the closing strength (CLV) by volume. A strong close (+CLV) on high volume results in a large positive MFV, and vice versa.
Step 3: Calculate CMF!
Set a parameter period N (default is 20 or 21 periods).
CMF = (Sum of MFV over the last N periods) / (Sum of Volume over the last N periods)
Note: Unlike MFI, this doesn’t separate positive/negative flows first. It directly sums the MFV (which can be positive or negative) for each period and divides by the total volume for that same N-period lookback.
The Final Result: CMF is an oscillator that swings between -1 and +1 (though it rarely hits the extremes, typically fluctuating between -0.5 and +0.5), centered around the Zero Line.
CMF > 0: Suggests that, on balance, over the N periods, money flow has been positive (inflow), indicating stronger buying pressure (closes tend towards highs, backed by volume).
CMF < 0: Suggests that, on balance, money flow has been negative (outflow), indicating stronger selling pressure (closes tend towards lows, backed by volume).
The further CMF is from 0: The stronger the indicated buying or selling pressure.
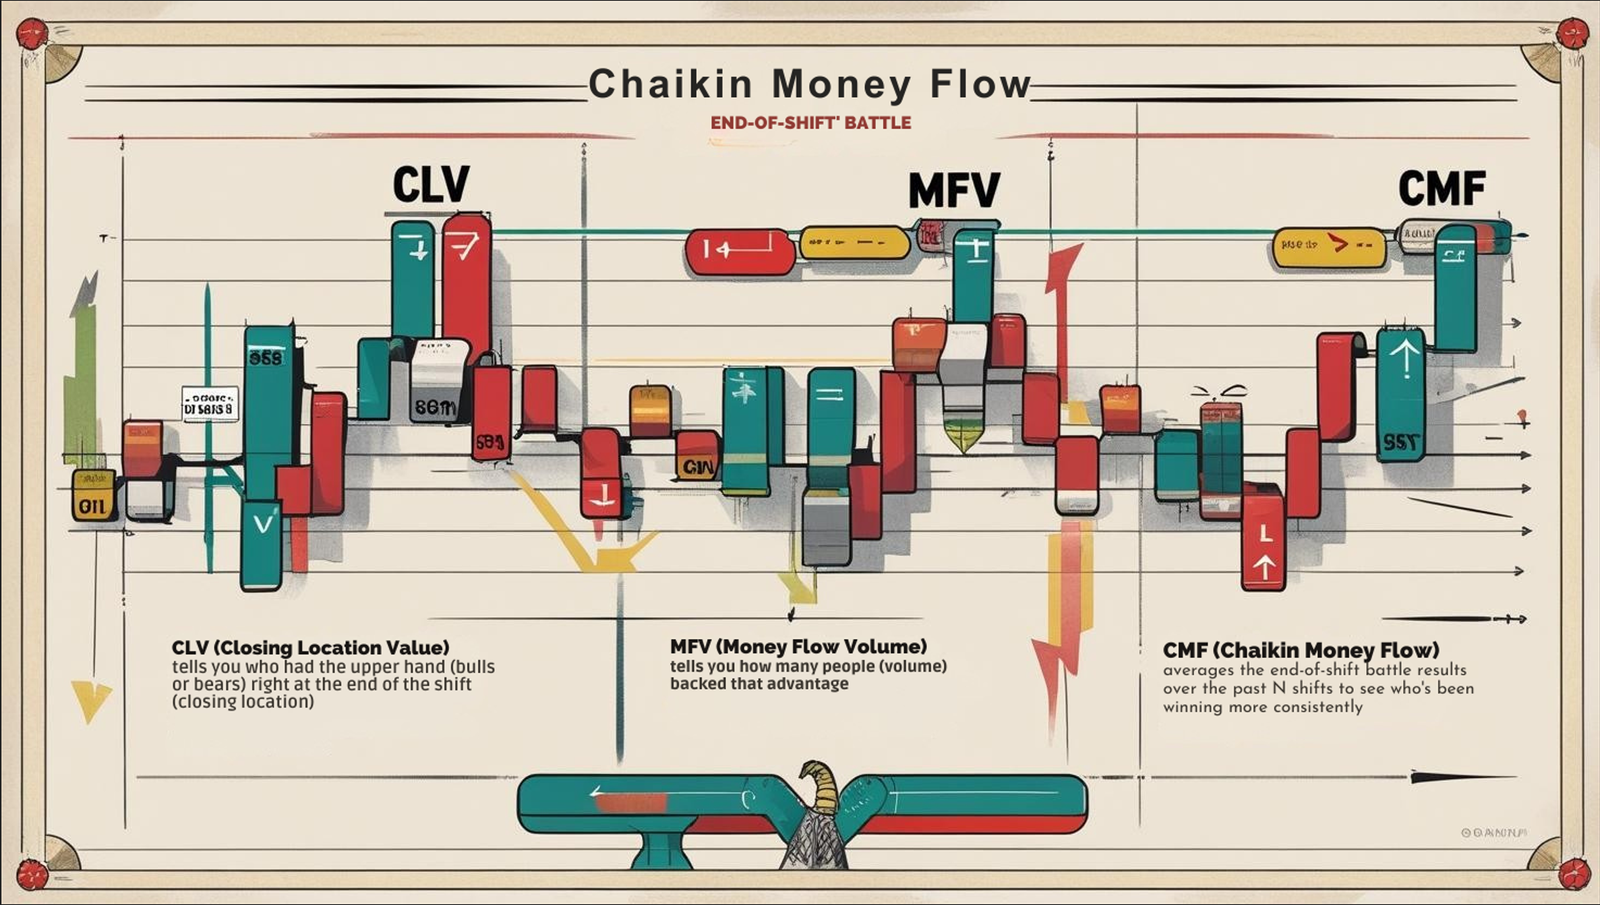
Think of the Daily “End-of-Shift” Battle:
CLV tells you who had the upper hand (bulls or bears) right at the end of the shift (closing location).
MFV tells you how many people (volume) backed that advantage.
CMF averages the end-of-shift battle results over the past N shifts to see who’s been winning more consistently.
「CMF Core Concept – CLV Explained」
Level 1: Basic Uses – Zero Line Crossover & Bull/Bear Pressure
The most direct, fundamental way to use CMF involves its relationship with the zero line:
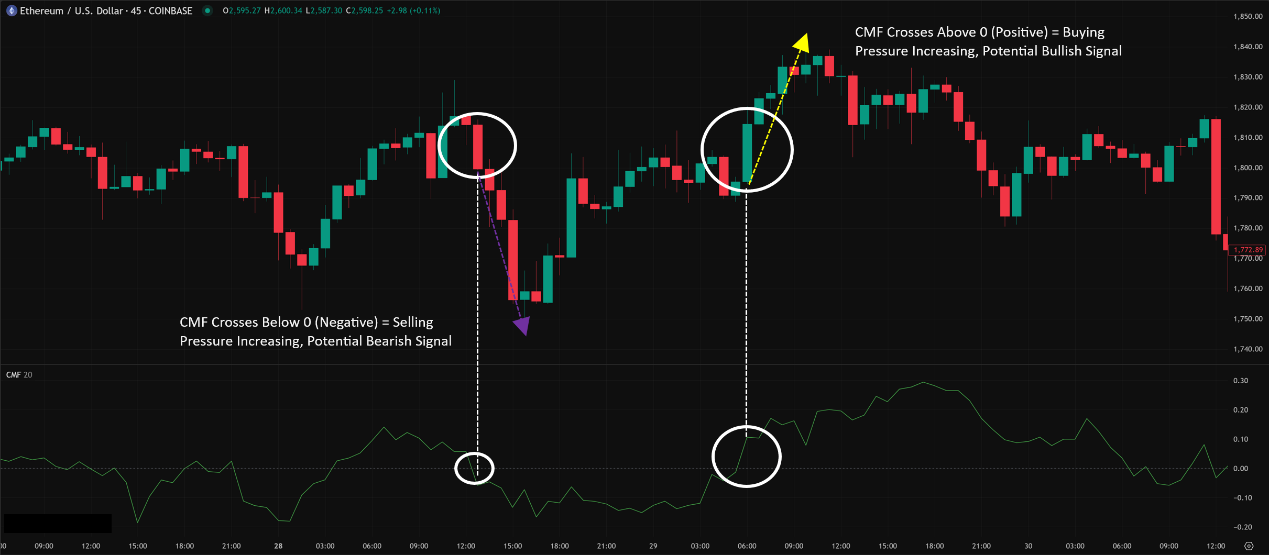
Zero Line Crossover:
CMF Crossing Above Zero: Can be interpreted as a potential buy signal or confirmation. It suggests money flow has shifted from net negative to net positive; buying pressure is starting to overcome selling pressure.
CMF Crossing Below Zero: Can be interpreted as a potential sell signal or confirmation. It suggests money flow has shifted from net positive to net negative; selling pressure is starting to overcome buying pressure.
Caution: Simple zero line crosses can be frequent, especially in choppy or sideways markets. Best used with other forms of analysis for confirmation.
Gauging Buying/Selling Pressure by Indicator Level:
CMF Consistently > 0: Confirms the market is generally dominated by buying pressure, supporting an uptrend. Higher positive values (e.g., > +0.05 or +0.1) indicate stronger buying pressure.
CMF Consistently < 0: Confirms the market is generally dominated by selling pressure, supporting a downtrend. Lower negative values (e.g., < -0.05 or -0.1) indicate stronger selling pressure.
CMF Hovering Around Zero: Suggests buying and selling pressures are relatively balanced; the market might be ranging or lacking clear direction.
「CMF Zero Line Crossover Examples」
CMF shines as a confirmation tool, and here’s how to use it more deeply:
A. Divergence: Not Primary, Still Observable
Principle: Similar to other oscillators, disagreement between price action and CMF action can serve as a warning of a potential reversal.
Patterns:
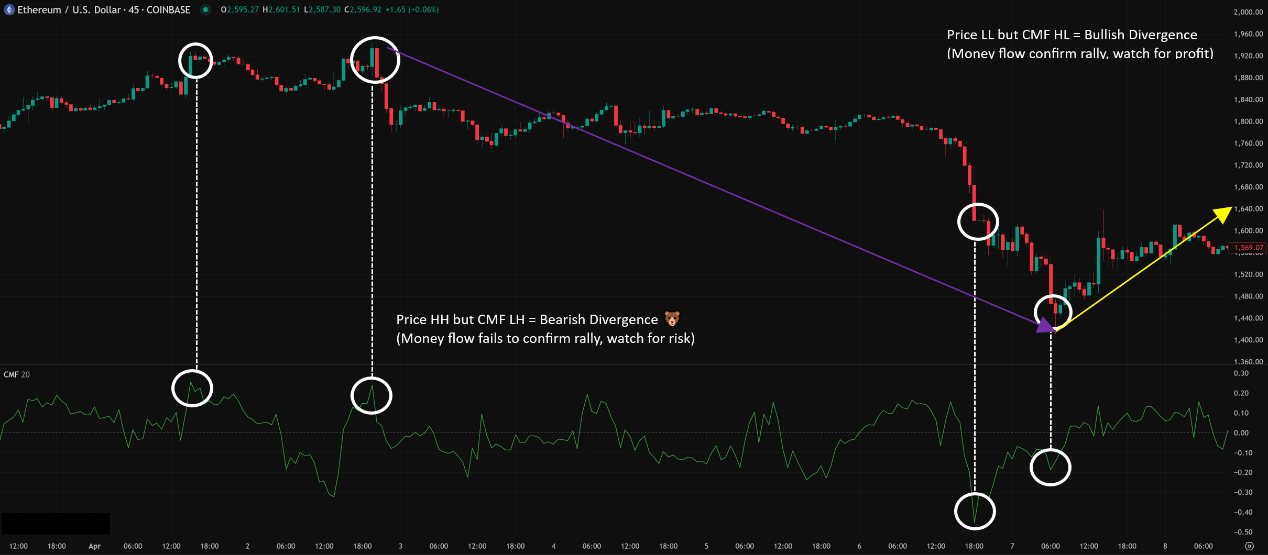
Bullish Divergence: Price makes a Lower Low (LL), but CMF makes a Higher Low (HL). Suggests that despite the lower price, selling pressure near the close (volume-weighted) isn’t increasing proportionally.
Bearish Divergence: Price makes a Higher High (HH), but CMF makes a Lower High (LH). Suggests that despite the higher price, buying pressure near the close (volume-weighted) isn’t increasing proportionally.
How to Use:
Compared to MFI or RSI, CMF divergence signals are often considered less common or less emphasized, partly because its oscillations are typically smaller, and its primary strength lies in the zero line confirmation.
However, clear, sustained divergence, especially near significant price levels, is still worth noting as an additional warning flag.
Requires Price Action Confirmation!
「CMF Bearish Divergence Example」
B. CMF as a Trend/Breakout Confirmation Tool (Confirmation Powerhouse)
This is arguably CMF’s most common and core advanced application.
How to Use:
Confirming Uptrends/Upside Breakouts: When price shows an uptrend (e.g., above a rising MA) or breaks above key resistance, if CMF is consistently above the zero line (or even rising steadily), it confirms that money flow supports the move, increasing signal reliability.
Confirming Downtrends/Downside Breakouts: When price shows a downtrend (e.g., below a falling MA) or breaks below key support, if CMF is consistently below the zero line (or even falling steadily), it confirms that money flow supports the move, increasing signal reliability.
Warning Signs:
Price breaks UP, but CMF stays below zero or quickly falls back below? Beware of a false breakout (bull trap)!
Price breaks DOWN, but CMF stays above zero or quickly bounces back above? Beware of a false breakdown (bear trap)!
Effectiveness: CMF acts like a “gatekeeper,” helping you filter out price moves that lack underlying money flow support, potentially improving trade probability.
C. Parameter Settings & Timeframes Deep Dive
Default Parameter: 20 or 21 Periods
Why? Marc Chaikin himself often used 20 or 21 periods. This length roughly covers one month of trading days (for stocks) and is generally considered good for reflecting medium-term money flow. It has become the most common market setting.
How Global Traders Play It (Global Variations & Styles):
Most Traders Stick to Default: Because CMF is primarily used for medium-term confirmation, the smoothing of 20/21 periods is usually sufficient and aligns with Chaikin’s intent. Aggressively changing parameters might dilute the indicator’s intended purpose.
Fine-Tuning by Short-Term Traders:
Parameters: Some very short-term traders (e.g., on M5, M15) might experiment with shorter periods like 9 or 14.
Reason: To make CMF react faster to recent money flow shifts and get earlier zero line crossover signals.
Trade-off: The indicator line becomes much choppier, with more “noisy” crosses around zero, requiring stronger filtering techniques.
Long-Term Analysts:
Parameters: Very rarely, periods like 50 or longer might be used to observe very long-term money flow trends, but this isn’t standard CMF usage.
Timeframe Impact:
Short Timeframes (M1-M15): CMF will hug the zero line very closely with frequent crosses, making reliable interpretation difficult due to excessive noise.
Medium Timeframes (H1-H4): CMF starts showing clearer trends, making zero line crosses relatively more reliable. Divergence also becomes more observable. Suitable as a confirmation tool for intraday and short-term swing traders.
Long Timeframes (D1, W1): CMF best fulfills its role as a medium-term money flow indicator. On Daily or Weekly charts, CMF consistently above or below zero provides stronger trend confirmation. Divergences on these timeframes also carry more weight.
D. Which Combos Are “Hot” & Effective? (Effective Combos & Best Practices)
CMF is an excellent confirmation tool and should be used alongside other indicators or analysis methods.
The Go-To Combo: Price Action (Trendlines/Patterns/Key Levels) + CMF Confirmation
How to Use:
Analyze the price chart first: Draw trendlines, identify chart patterns (H&S, double tops/bottoms, flags, triangles), find key S/R levels.
When price gives a breakout signal or a trend continuation signal, check CMF:
Upside break / uptrend continuation? Is CMF > 0?
Downside break / downtrend continuation? Is CMF < 0?
If CMF confirms, signal reliability increases. If CMF disagrees or contradicts, be more cautious.
Effectiveness: Price action leads, CMF filters signals lacking money flow support. This is the most robust method and aligns best with CMF’s design.
The Momentum Combo: CMF + Oscillator (e.g., RSI, Stochastics, MACD)
How to Use:
Use RSI or Stochastics to identify overbought/oversold conditions.
Use MACD for trend momentum and crossover signals.
Use CMF as a final confirmation: E.g., if RSI exits oversold, MACD gives a bullish cross, and CMF simultaneously crosses above zero or holds above zero, the buy signal is strengthened.
Effectiveness: Combines different indicator types to validate trade signals from multiple angles.
The Volume Indicator Combo: CMF + OBV/MFI
How to Use: Compare signals from different volume-based indicators. E.g., if OBV breaks its trendline upward and CMF also crosses above zero, it might be a stronger buy signal. Be aware that different volume indicators can sometimes give conflicting signals, requiring trader judgment.
E. Optimal Parameter Combos? (The Parameter Sweet Spot Again!)
For CMF, the answer is relatively clear:
Highly Recommended / Most Common: 20 or 21 periods. This aligns best with Marc Chaikin’s original intent and is the most widely accepted setting, especially on Daily charts. It provides adequate smoothing for medium-term confirmation.
If You Must Try Shorter (e.g., for H1 or lower trading): You could experiment with 14 periods as a compromise. Going much shorter (like 9) might introduce too much noise.
Longer Periods (e.g., 50): Not standard usage, likely to lag too much for CMF’s intended purpose.
How to Choose?
Strongly Recommended: Start with 20 or 21. Use it on Daily and H4 charts to get a feel for its behavior.
Understand the Indicator’s Purpose: CMF is primarily for confirmation, not for catching extreme highs/lows or super-fast reactions. The default settings usually serve this role best.
Avoid extreme parameter changes unless you have very specific reasons backed by thorough testing.
Chaikin Money Flow (CMF) is a highly practical volume indicator, unique in its combination of the closing price’s location within the period’s range and volume to determine the short-to-medium term balance of buying vs. selling pressure.
It helps you:
Gauge Money Flow Direction: By observing its position relative to the zero line.
Confirm Trends and Breakouts: Acting as a crucial filter for price action signals.
Provide Additional Warnings: Divergence can be observed, though not its primary function.
Quantify the Closing Battle: Reflecting market sentiment near the end of the trading period.
For young traders wanting to add more nuanced money flow analysis to their decisions, especially for confirming trends and breakout signals, CMF is definitely an indicator worth adding to your arsenal.
Remember:
CMF is primarily a confirmation tool, not a primary signal generator.
The Zero Line is its most important reference.
20/21 periods are the standard and recommended parameters.
Always, always, always combine with Price Action analysis!
Alright! Hope this comprehensive breakdown of CMF gives you a much deeper understanding! Apply it to your analysis workflow and see how it helps improve your odds! Catch you on the next one! Keep trading smart!