Physical Address
304 North Cardinal St.
Dorchester Center, MA 02124
Physical Address
304 North Cardinal St.
Dorchester Center, MA 02124
Yeah! What’s up, Trend Riders and Crypto Explorers! Our technical analysis journey hits another station! After dissecting CMF last time, today we’re digging into what you could call CMF’s “daddy,” or another OG indicator for tracking money flow – say hello to the Accumulation/Distribution Line (A/D Line)!
Heard the name “Accumulation/Distribution” and immediately got the vibe of what it’s trying to do? Exactly! This line’s goal is to analyze the closing price position within the daily range, combined with volume, to tell you if the “big players” or “smart money” behind the scenes are quietly accumulating shares (Accumulation) or secretly distributing them (Distribution)!
It’s similar to OBV in that it accumulates volume, but the calculation is different; it’s also the foundation for CMF, but its form and usage are distinct. Wanna know how the A/D Line helps you see the real story behind price ups and downs? Want to learn how to use it to confirm trends and spot potential divergence signals that might even lead price? Alright, buckle up! Let’s break down the A/D Line’s history, core logic, and practical techniques all at once! Let’s dive in!
The concept behind the A/D Line has quite a history and is linked to several heavyweights in technical analysis.
Conceptual Roots: Larry Williams & Co. – While many associate the A/D Line with Marc Chaikin (CMF’s inventor), the idea of using the closing price’s position within the daily range to gauge buying/selling pressure dates back to earlier analysts like Larry Williams. They recognized that just looking at volume up or down wasn’t enough; the “power” of the closing price was key.
Marc Chaikin’s Role: Popularizer & Foundation Builder – Marc Chaikin built upon this concept, formalizing and popularizing the A/D Line formula. Crucially, he used it as the calculation base for two of his other famous indicators: Chaikin Money Flow (CMF) and the Chaikin Oscillator. So, while Chaikin wasn’t necessarily the first person with the core idea, he was instrumental in the A/D Line’s prevalence and further development.
Core Philosophy: Closing Confirms Strength – The philosophy behind the A/D Line is: no matter how wildly the market fluctuates during the day, the final closing price reflects the ultimate outcome of the day’s battle.
If the close is near the high, it means buyers ultimately controlled the session’s end, regardless of intraday dips.
If the close is near the low, it means sellers had the upper hand at the close.
Purpose: Cumulatively Tracking Price x Volume “Money Pressure” – The A/D Line aims to combine this “closing strength” with the day’s volume and then accumulate it continuously over time. This creates a line showing whether buying pressure (accumulation) or selling pressure (distribution) has been dominant over the long haul.
Therefore, the A/D Line was developed to provide a continuously tracked, cumulative method for observing money flow changes based on closing price location and volume, hoping to capture the true intentions of larger market participants.
The A/D Line calculation shares core steps with CMF, but the final step is crucially different:
Step 1: Calculate Close Location Value (CLV)
CLV for each period = [ (Close – Low) – (High – Close) ] / (High – Low)
(This step is identical to CMF’s, resulting in a value between -1 and +1 measuring closing strength.)
Special case: If High = Low (e.g., limit move or no range), CLV = 0.
Step 2: Money Flow Multiplier
This is effectively just the CLV. This multiplier determines the proportion of the day’s volume considered “buying volume” vs. “selling volume.”
Step 3: Money Flow Volume for the Period
Money Flow Volume = Money Flow Multiplier (CLV) * Volume for the period
(This step is also the same as calculating MFV for CMF.)
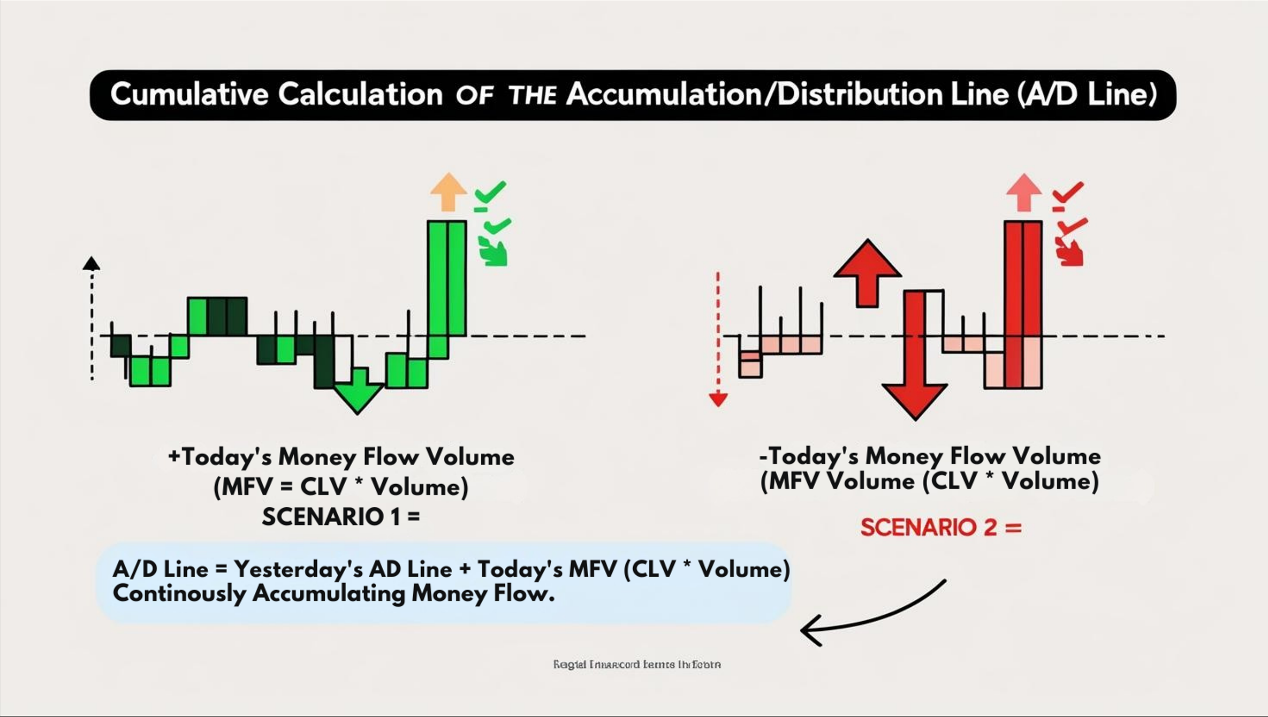
Step 4: Calculate the A/D Line! (The Key Difference!)
The A/D Line is a Cumulative indicator!
Today’s A/D Line Value = Yesterday’s A/D Line Value + Today’s Money Flow Volume
Starting Point: The first day’s A/D Line can be set to 0 or that day’s Money Flow Volume.
Meaning: It continuously adds (or subtracts, if MFV is negative) the daily calculated “Money Flow Volume” (based on closing position and volume) to the previous day’s total, forming a running tally line.
Core Point: Like OBV, the Absolute Value of the A/D Line is Meaningless!
Whether the A/D Line reads 5 million or 1 billion doesn’t matter in itself.
What’s important is the trend direction of the A/D Line and its relationship to the price trend! Is it going up or down? Is it confirming price action? Is there divergence?
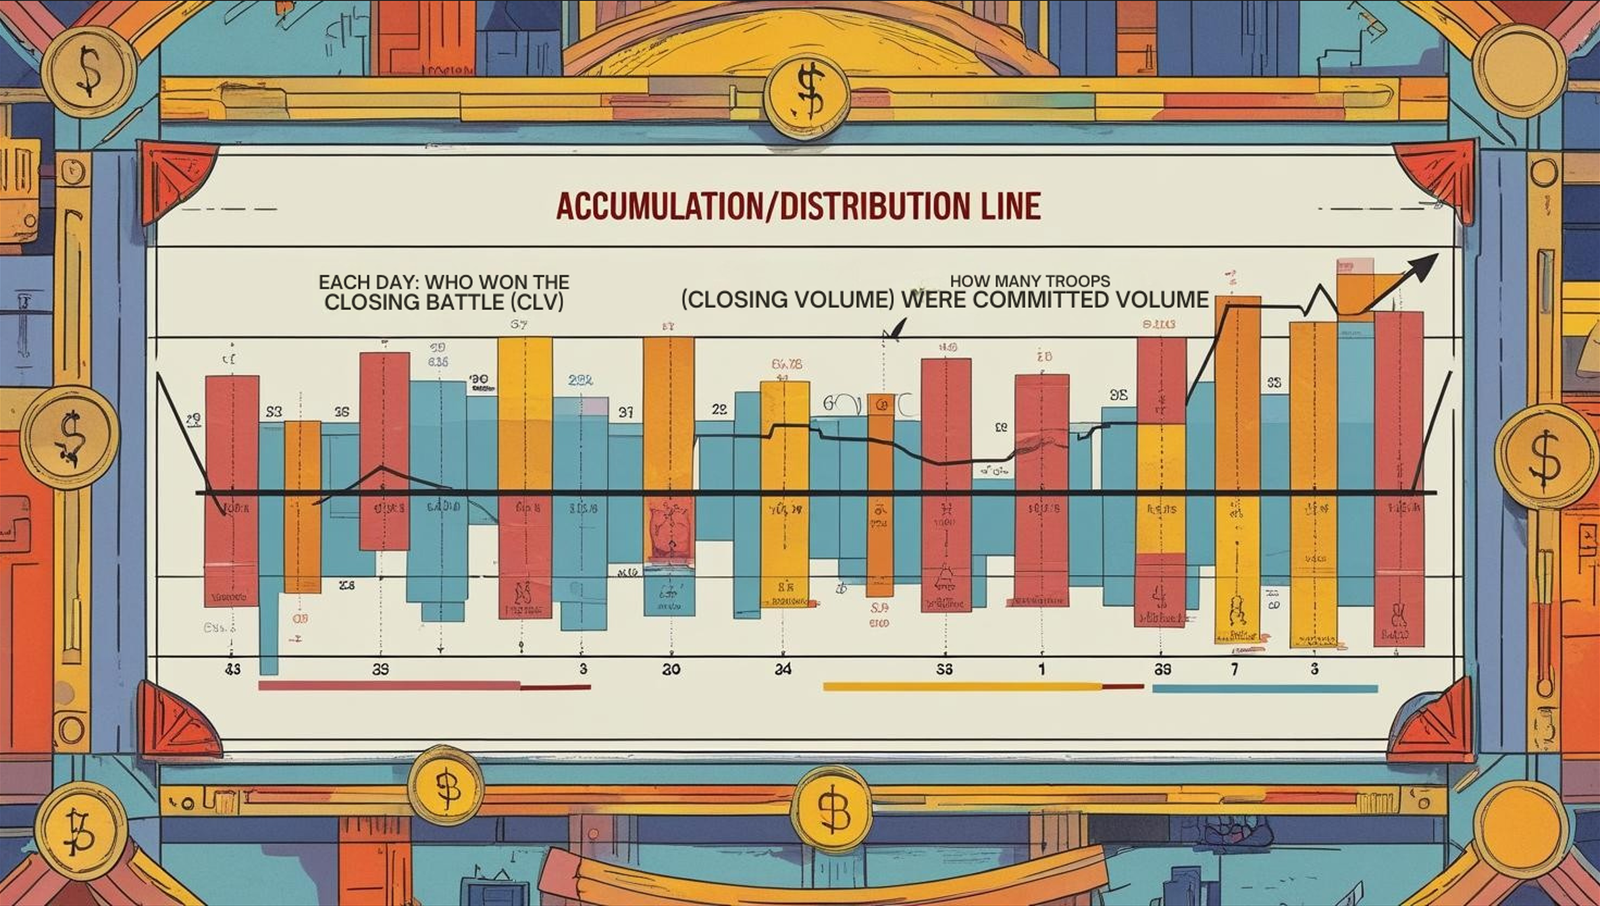
Think of Daily “Battle Reports”:
Each day’s Money Flow Volume is like a report combining “who won the closing battle (CLV)” and “how many troops were committed (Volume).”
The A/D Line is the “running scorecard,” adding or subtracting the results of each daily report to see who (bulls or bears) has accumulated more victories over time.
「A/D Line Cumulative Calculation Concept」
The uses of the A/D Line are somewhat similar to OBV, focusing on trend confirmation and divergence.
Level 1: Basic Uses – Trend Confirmation & Divergence (The Core Applications)
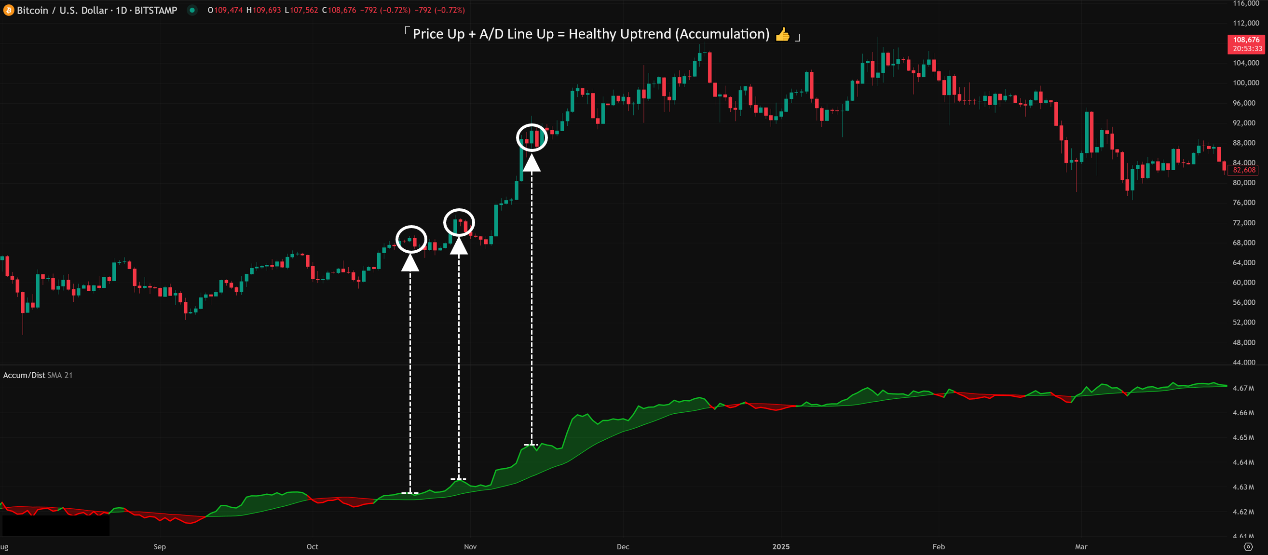
Principle: A healthy trend should see the A/D Line moving in sync with price action.
How to Use:
Price Rising + A/D Line Also Rising: Uptrend is supported by money flow, considered healthier. Indicates closes tend towards highs, backed by volume.
Price Falling + A/D Line Also Falling: Downtrend is confirmed by money flow, trend likely to continue. Indicates closes tend towards lows, backed by selling volume.
Warning Sign: If price and the A/D Line move in opposite directions, that’s divergence! (Covered next).
「A/D Line Trend Confirmation Example (Uptrend)」
2. Divergence: A/D Line’s Most Valuable Signal!
Principle: When price makes a new high/low, but the A/D Line fails to follow suit, creating divergence, it suggests the money flow behind the price move might be flawed. This is a potential major warning of a trend reversal.
Two Main Types:
Bullish Divergence:
Pattern: Price makes a Lower Low (LL), but the A/D Line refuses to make a new low, forming a Higher Low (HL) instead.
Meaning: Although price broke down, the selling pressure near the close (volume-weighted) isn’t as strong as perceived, or buying interest (closing nearer highs) is actively accumulating at lows. Potential bottoming signal.
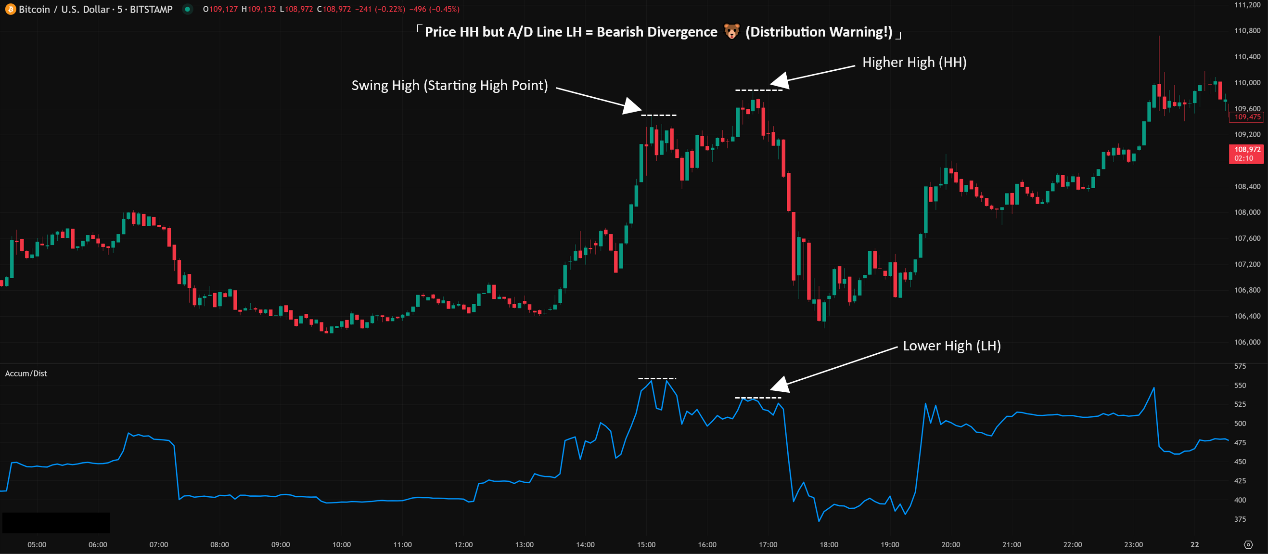
Bearish Divergence:
Pattern: Price makes a Higher High (HH), but the A/D Line fails to make a new high, forming a Lower High (LH) instead.
Meaning: Although price broke out, the buying power near the close (volume-weighted) isn’t keeping pace, or distribution (closing off the highs) might be occurring into strength. Potential topping signal.
Why So Important? Because the A/D Line incorporates the closing price location, its divergence is sometimes considered more adept than simple volume-based OBV divergence at potentially catching “smart money” actions.
Crucial Reminder: Divergence is still a WARNING, not a trade command! Requires price action confirmation!
「A/D Line Bearish Divergence Example」
The A/D Line looks simple, but how can we use it more effectively?
A. Parameter Settings & Timeframes (The No-Parameter Zone Again!)
Does A/D Line Have Parameters? Nope! Just like OBV, the A/D Line itself is a cumulative indicator with no internal period parameters to set. Its calculation only relies on H, L, C, and Volume.
The Importance of Timeframe:
Short Timeframes (M1-M15): A/D Line will be very erratic, often making it hard to discern clear trends or meaningful divergences. Lots of noise.
Medium Timeframes (H1-H4): A/D Line starts showing more defined trends and patterns. Divergence signals begin to have more reference value. Useful for observation by intraday and short-term swing traders.
Long Timeframes (D1, W1): The A/D Line’s long-term trend and major divergences are most significant here. It can reflect accumulation or distribution processes over extended periods. Long-term investors and swing traders should pay close attention.
How Global Traders Play It?
Since there are no parameters to tweak, traders worldwide focus mainly on interpreting the A/D Line’s trend and spotting divergence signals.
Emphasis is placed on the relationship between price and the A/D Line – are they in sync or diverging?
Often, traders analyze the A/D Line on their primary trading timeframe while also referencing the A/D Line on a higher timeframe to gauge the longer-term money flow context.
B. A/D Line Pattern Analysis & Trendline Breaks (Treating A/D Like Price)
The Play: Treat the A/D Line as if it were its own “price line” and apply basic charting techniques to it.
How to Use:
Draw Trendlines: Similar to OBV, you can draw trendlines on the A/D Line itself. If the A/D Line breaks its own trendline, it can sometimes serve as an early hint that the price trend might be about to change.
Identify Patterns: Some advanced traders try to identify chart patterns like double tops/bottoms on the A/D Line, but this is more subjective and requires experience.
Caution: This usage is more advanced and subjective than simply looking for divergence. Use carefully and seek confirmation.
C. A/D Line vs. OBV: Sibling Rivalry?
A/D Line and OBV share a similar goal (tracking price/volume relationships) but differ in calculation:
OBV: Simply looks at whether today’s close is higher or lower than yesterday’s close to decide whether to add or subtract the entire day’s volume. Very straightforward.
A/D Line: Looks at where the close is relative to the day’s own high-low range to determine how much of the day’s volume gets counted (and whether it’s positive or negative). Reflects intraday buying/selling battles more.
Usage Comparison:
Sometimes they give similar signals.
Sometimes they show conflicting divergences, or one shows divergence while the other doesn’t. This requires trader discretion and incorporating other information. Neither is definitively “better.”
Some feel A/D Line is more sensitive to intraday money flow, while OBV is more direct about simple up/down pressure.
D. Which Combos Are “Hot” & Effective? (Best Practices for A/D)
Since there are no parameters, we talk about combining usage methods effectively.
The Golden Combo: Price Action Confirmation + A/D Line Divergence
How to Use: This is the core, most reliable way to use the A/D Line.
Identify clear bullish or bearish divergence on the A/D Line.
Wait Patiently! Wait for a corresponding confirmation signal on the price chart:
Break of a descending/ascending trendline.
Completion of a reversal chart pattern (Double Bottom/Top, H&S Bottom/Top).
A strong reversal candlestick signal.
A decisive break of key support/resistance.
Consider acting only after price confirms the potential significance of the A/D divergence.
Effectiveness: Uses A/D divergence to create a high-potential “watchlist,” then uses price action as the final “entry trigger.”
The Confirmation Combo: Primary Trend Analysis + A/D Line Synchronicity
How to Use:
Determine the primary trend using MAs, trendlines, etc.
Observe if the A/D Line is moving in sync with the price trend.
Uptrend, A/D Line steadily rising? Good sign.
Downtrend, A/D Line steadily falling? Normal.
Trend continues, but A/D Line starts flattening or moving counter-trend? Raise caution flags – could be an early sign of weakening trend.
Effectiveness: Uses the A/D Line to verify the “quality” or underlying strength of the trend.
E. Optimal Parameter Combos? (The No-Parameter Conclusion)
Once again: The A/D Line has NO parameters! No need to agonize over 14 vs. 20.
What you need to focus on is:
The trend direction of the A/D Line.
The relationship (synchronicity or divergence) between the A/D Line and price action.
The timeframe you are analyzing (Daily, Weekly often more meaningful).
Combining with Price Action as the ultimate decision basis.
The Accumulation/Distribution Line (A/D Line) is a classic price-volume indicator whose core value lies in analyzing the closing price’s position within the daily range, multiplying by volume, and cumulatively tracking this value to reveal long-term Accumulation or Distribution pressure.
It helps you:
Confirm Trend Health: See if money flow supports the price direction.
Spot Crucial Divergence Signals: Identify inconsistencies between price and volume-weighted flow, hinting at potential reversals.
Understand the Closing Battle: Reflects intraday strength/weakness more nuancedly than OBV.
Serve as a Basis for Other Chaikin Indicators: Understanding A/D helps understand CMF and the Chaikin Oscillator.
For young traders wanting to delve deeper into price-volume relationships, especially those looking to capture “smart money” activity by analyzing closing behavior, the parameter-less A/D Line offers significant insights worth mastering!
Remember:
A/D Line is cumulative; focus on its trend and patterns.
Divergence is its most valuable signal but REQUIRES price confirmation.
No parameter headaches, but choose your timeframe wisely.
Similar goal to OBV but different calculation; can be used comparatively.
Price Action is ALWAYS King!
Alright! Hope this deep dive into the A/D Line gives you a crystal-clear understanding! Add it to your analytical toolkit and start practicing using it to see beneath the surface of the market! See ya! ✨