Physical Address
304 North Cardinal St.
Dorchester Center, MA 02124
Physical Address
304 North Cardinal St.
Dorchester Center, MA 02124
Yo! What’s up, all you sharp traders grinding in the markets! Our Tech Analysis Deep Dive today features a true OG, a granddaddy indicator that technical analysis basically wouldn’t even exist without – let’s talk Volume!
That’s right! Those vertical bars usually chilling below your price chart! A lot of beginners might just glance past them, thinking price is all that matters. Nah, nah, nah! You’re missing out! In the eyes of pro traders, Volume is like the market’s “heartbeat,” “fuel,” or “energy level”! It directly tells you the market’s activity level and how much “power” is behind those price moves!
Is that price pump legit with lots of buyers, or is it just rising on fumes? Is that price drop a panic sell-off or just drifting down with no one interested? Volume is the key to decoding this crucial subtext! Wanna know how to use this most basic yet most vital indicator to confirm trends, spot traps, and even catch reversal opportunities? Wanna know why Volume has no parameters, but pros use it like masters? Alright! Stick with us as we completely dissect Volume, this “most familiar stranger”! Let’s get loud!
Volume is basically as old as the markets themselves; there’s no single “inventor.”
A Natural Market Byproduct: Wherever there’s trading, there’s volume. Volume simply records the total number of shares, contracts, or tokens traded between buyers and sellers within a specific time period (like a day, an hour, a minute). It’s the most direct, raw reflection of market activity.
Bedrock of Dow Theory: Charles Dow, the forefather of modern technical analysis, emphasized the importance of volume in his theories. He proposed that “Volume must confirm the trend.” Meaning, a healthy uptrend should be accompanied by increasing volume; likewise for a downtrend. This concept remains a core principle of volume analysis today.
Data Provided by Exchanges: The Volume data we see on charts is typically the actual transaction data provided directly by exchanges (like NYSE, NASDAQ, Binance, Bybit).
So, Volume isn’t an indicator someone “invented,” but rather an objective record of market activity. How to interpret it, however, is where the art of technical analysis comes in.
The “design” of the Volume indicator itself is incredibly simple: plotting the total transaction volume over time.
Data Source: Exchanges record the quantity of each transaction.
Time Aggregation: All transaction volumes within a specific time period (e.g., 5 minutes, 1 hour, 1 day) are summed up.
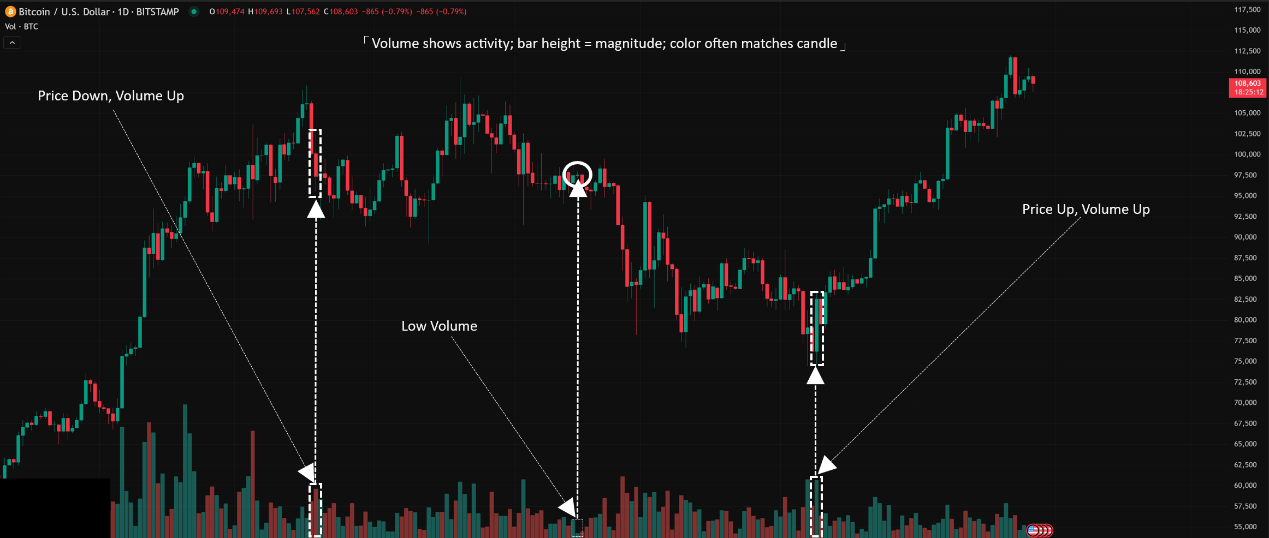
Visualization: It’s typically displayed below the price chart as vertical bars (a Bar Chart).
The height of the bar represents the total volume during that period. Taller bar = higher volume; shorter bar = lower volume.
The color of the bar usually corresponds to the price candle for easy comparison:
If the price closed higher for the period (Close > Open), the Volume bar might be green (or another color indicating ‘up’).
If the price closed lower for the period (Close < Open), the Volume bar might be red (or another color indicating ‘down’).
Important: The color is just a visual aid related to price direction. The Volume value itself represents total traded volume – it doesn’t distinguish between buys and sells! A tall red Volume bar doesn’t mean “selling volume”; it means total volume was high on a day/period when the price closed lower (could be panic selling, but could also involve heavy buying absorbing the sell pressure).
Core Point: Volume Shows “Activity” and “Participation”!
High Volume: Lots of buying and selling, market is active, high interest at current price levels.
Low Volume: Trading is sparse, market might lack direction, or participants are waiting on the sidelines.
Things to Note:
Stocks vs. Futures vs. Crypto: Stock Volume is usually shares traded. Futures Volume is contracts traded. Crypto Volume is tokens traded (sometimes quoted in USDT/USD value too).
Tick Volume vs. Real Volume: In some markets (especially certain FX brokers), you might see Tick Volume (number of price ticks), not actual traded volume. Be mindful when interpreting. Crypto and stock exchanges usually provide Real Volume.
Crypto 24/7: Crypto markets don’t have fixed open/close times. Volume is continuous. Be aware of the cutoff time (e.g., UTC 00:00) when interpreting daily volume.
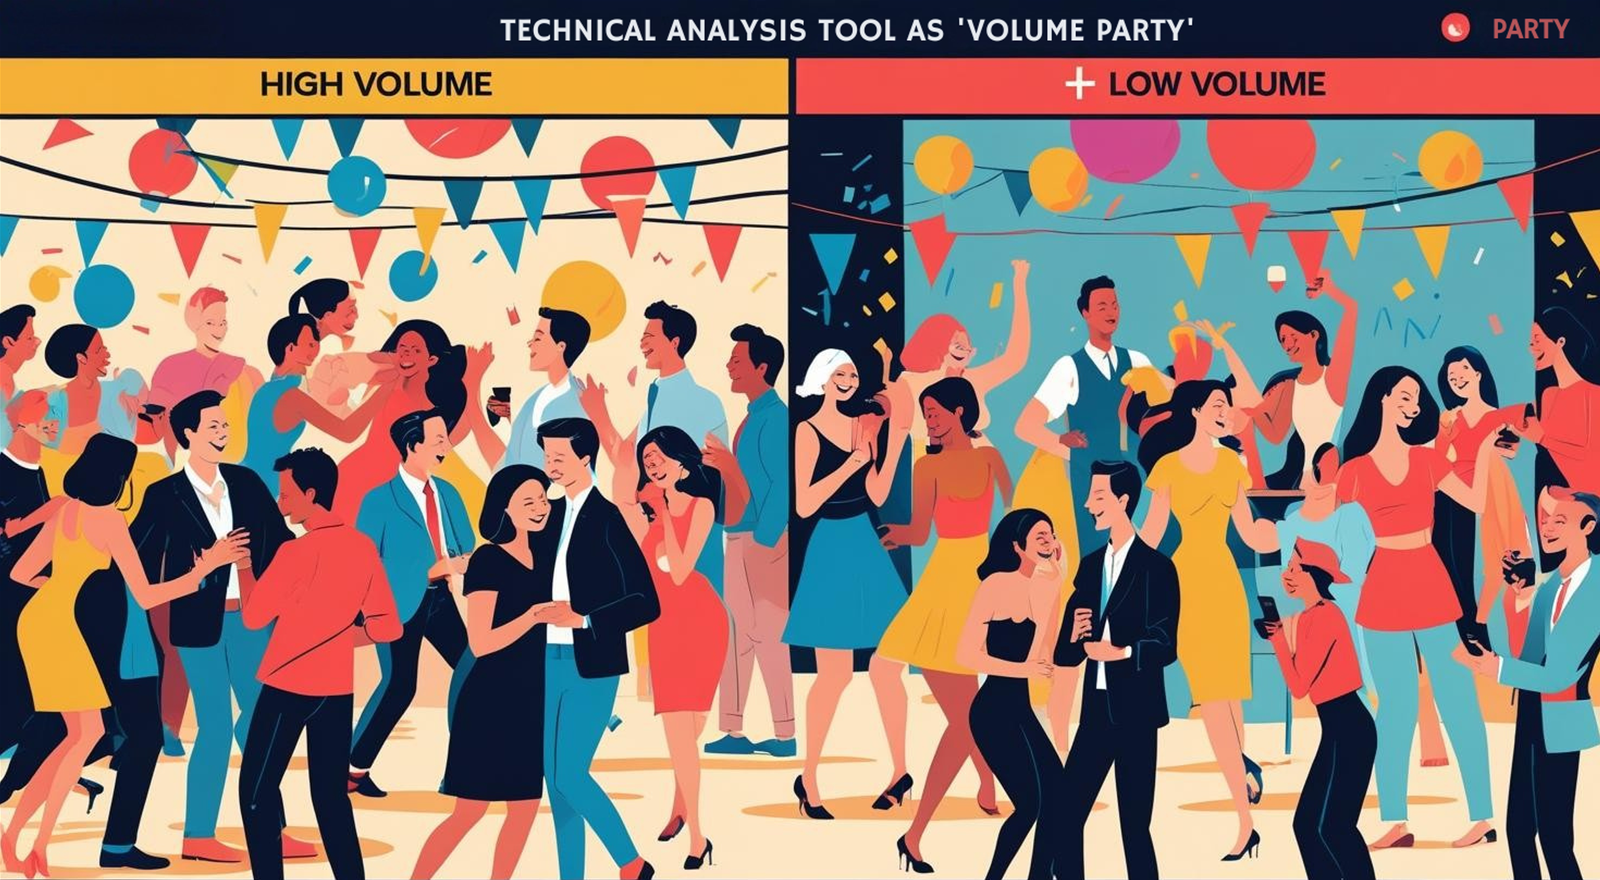
Think of a Party:
Volume is the number of people at the party and how loud it is.
High Volume = Party is lit, lots of people dancing, talking, interacting.
Low Volume = Party is chill, maybe fewer people, or everyone’s just scrolling on their phones.
「Basic Volume Indicator Explained」
Level 1: Basic Usage – The Core Price-Volume Principles
The absolute basics involve understanding the classic relationships between price and volume:
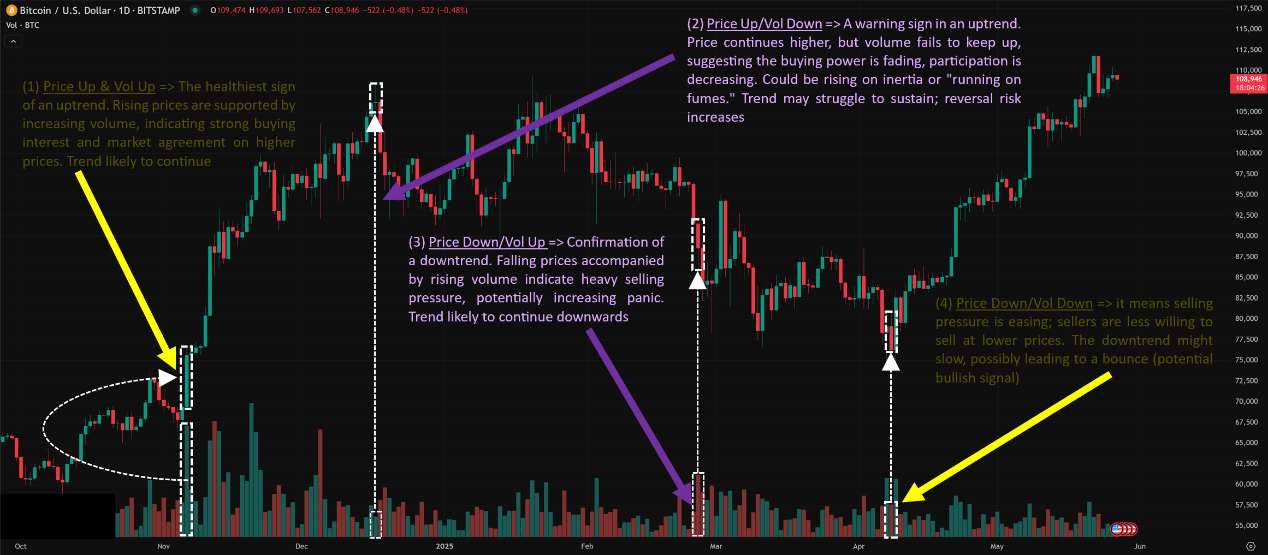
Price Up, Volume Up:
Interpretation: The healthiest sign of an uptrend. Rising prices are supported by increasing volume, indicating strong buying interest and market agreement on higher prices. Trend likely to continue.
Example: When price breaks above key resistance, a significant increase in volume strongly confirms the breakout’s validity.
Price Up, Volume Down: ⚠️
Interpretation: A warning sign in an uptrend. Price continues higher, but volume fails to keep up, suggesting the buying power is fading, participation is decreasing. Could be rising on inertia or “running on fumes.” Trend may struggle to sustain; reversal risk increases.
Example: Price makes a new high, but the corresponding Volume bar is lower than the one at the previous high.
Price Down, Volume Up: (Confirmation for a downtrend)
Interpretation: Confirmation of a downtrend. Falling prices accompanied by rising volume indicate heavy selling pressure, potentially increasing panic. Trend likely to continue downwards.
Example: When price breaks below key support, a sharp increase in volume suggests the downtrend may accelerate.
Price Down, Volume Down: / ⚠️
Interpretation: Ambiguous situation.
Could mean selling pressure is easing; sellers are less willing to sell at lower prices. The downtrend might slow, possibly leading to a bounce (potential bullish signal).
Could also simply mean lack of interest – few buyers and few sellers. Price might continue to drift lower or go sideways.
Example: Price keeps falling, but Volume bars get progressively shorter.
Price Sideways, Volume Down: (Consolidation)
Interpretation: Market is entering a consolidation phase. Buyers and sellers are temporarily balanced, participation drops as traders wait for direction. This is often the “calm before the storm,” potentially building energy for the next breakout.
Example: Price moves within a narrow range, and Volume bars below remain consistently low.
Price Sideways, Volume Up: ⚠️ (Potential Turning Point)
Interpretation: A more unusual signal. Price isn’t moving much, but volume suddenly increases significantly. Suggests heavy turnover or a battle between bulls and bears at this price level. Could be accumulation before an upside break or distribution before a downside break.
Example: Price is flat, but suddenly a few unusually tall Volume bars appear.
「Four Basic Price-Volume Patterns」
Pros don’t just see volume going up or down; they analyze its patterns and combine it with other analysis.
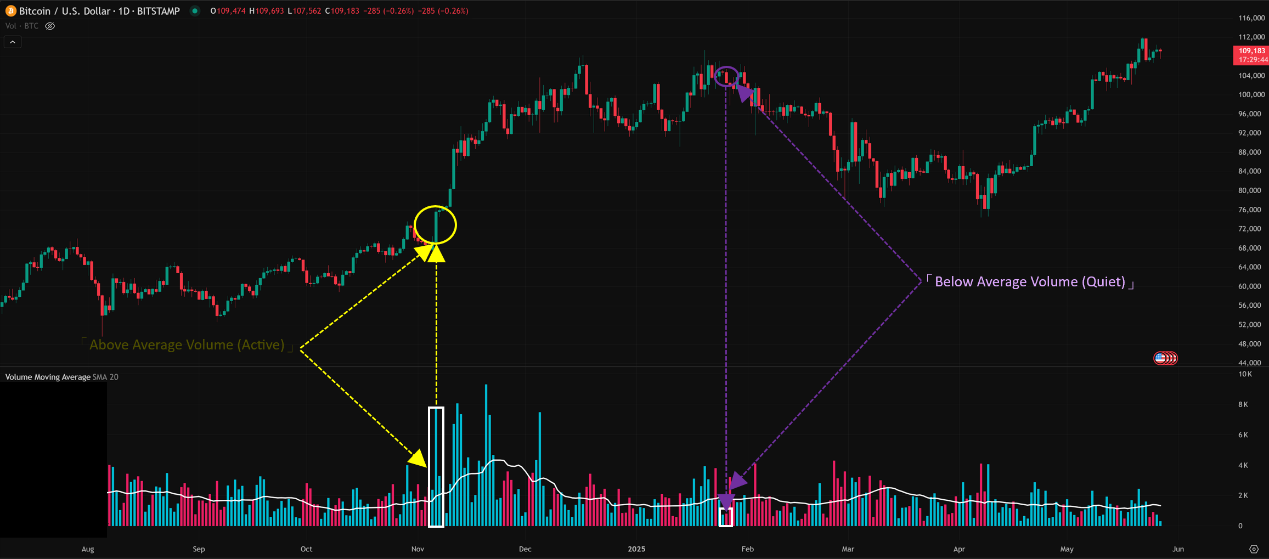
A. Volume Parameters? Not Really! But How to Quantify? -> Volume MA!
The Core Problem: The Volume indicator itself has no calculation period. A Volume bar is just the total volume for that period. So how do you judge if today’s volume is “high” or “low”?
The Solution: Volume Moving Average (VMA)
The Play: Add a Simple Moving Average (SMA) line directly onto the Volume indicator chart, typically using 20 or 50 periods.
How to Use:
Baseline Comparison: This VMA line represents the average volume over the past N periods.
Judging Relative Size:
Current Volume bar is above the VMA line: Today’s volume is higher than the recent average (significantly active).
Current Volume bar is below the VMA line: Today’s volume is lower than the recent average (relatively quiet).
Effectiveness: Provides an objective benchmark to identify relatively “unusual” volume days, making analysis more quantifiable.
「Volume Indicator with Moving Average (VMA)」
B. Volume Spike Analysis: Climax or Exhaustion?
Definition: A Volume bar that is suddenly, unusually tall, far exceeding the recent average (VMA).
Interpretation (Requires Price Context!):
Spike during Uptrend + Big Price Rise / Long Upper Wick: Could be a Buying Climax. Massive buying interest, but potentially the final burst of euphoria. Increased risk of a short-term top.
Spike during Downtrend + Big Price Drop / Long Lower Wick: Could be a Selling Climax / Capitulation. Massive panic selling, but might also represent a one-off release of selling pressure. Potential short-term bottoming signal.
Spike during Breakout of Key Level: Usually a strong confirmation of the breakout (see Level 1).
Spike during Sideways Range: Suggests heavy turnover or battle. Watch the subsequent price direction for clues about accumulation/distribution.
Key: A spike itself doesn’t guarantee reversal. Context (where in the trend it occurs) and the corresponding candlestick pattern are crucial.
C. Volume Dry-Up Analysis: Resting or Losing Steam?
Definition: Volume remains consistently very low, well below the recent average (VMA).
Interpretation:
Volume Shrinks on Pullback in Uptrend: Healthy sign. Suggests the pullback is just profit-taking, not heavy selling pressure. Trend likely to resume. Potential add-on opportunity.
Volume Shrinks on Rally in Downtrend: (Favorable for bears) Healthy sign for the downtrend. Suggests the bounce lacks buying conviction. Trend likely to resume downwards. Potential shorting opportunity.
Volume Shrinks during Consolidation: Typical ranging behavior. Market is “building energy,” waiting for direction. A volume expansion accompanying a price breakout is the entry signal.
Volume Shrinks after a Breakout: ⚠️ Warning sign. If volume doesn’t follow through after a breakout and instead dries up, it suggests lack of conviction. Increased risk of a false breakout.
D. Timeframe Interpretation Differences
Volume has no parameters, but the Timeframe you view Volume on matters immensely!
Short Timeframes (M1-M15): Many frequent Volume bars. Activity reflects immediate order flow. A spike on M5 might just be one large order and have little impact on the bigger picture.
Medium Timeframes (H1-H4): Volume becomes more meaningful, reflecting sentiment and flow over several hours. Spikes or dry-ups on H1/H4 are more noteworthy.
Long Timeframes (D1, W1): Volume reflects participation and conviction over a full day or week. Daily volume anomalies (e.g., extremely high “blow-off” volume, extremely low “listless” volume) are often more valuable for identifying medium-to-long term turning points.
E. Which Combos Are “Hot” & Effective? (Effective Volume Patterns & Combos)
Volume is a confirmation and warning indicator; always combine it with price action or other tools.
The King Combo: Price Patterns/Key Level Breaks + Volume Confirmation
How to Use:
Identify key opportunities on the price chart: Trendline breaks, H&S completion, triangle breakouts, key S/R tests.
Check the Volume! Did volume significantly increase (above VMA) during the breakout/pattern completion?
If yes, the probability of success for the breakout/reversal increases dramatically. If volume is weak, beware of false signals.
Examples: Head & Shoulders bottom neckline break accompanied by a huge volume spike -> Strong buy signal. Double top formation where the right peak has significantly lower volume than the left peak -> Bearish signal.
The Volume Indicator Combo: Volume + OBV/A/D Line/MFI/CMF
How to Use: Use raw Volume as the primary activity gauge, then use indicators like OBV/A/D/MFI/CMF to interpret the direction of money flow behind that volume.
Example: You see a Volume Spike. Then check if A/D Line is also making a new high/low, or if MFI/CMF confirms the buying/selling pressure. Multiple indicators confirming each other adds weight.
Volume + Oscillators (RSI/Stochastics): Confirming Reversals from OB/OS
How to Use: RSI enters oversold territory, price forms a Hammer candle. If that Hammer occurred on relatively high volume (suggesting buyers stepped in), the bounce potential is higher. Conversely, a Shooting Star in the overbought RSI zone on high volume increases the topping risk.
F. Best Parameter Combos? (The Volume MA Parameter)
Volume itself has no parameters.
If you use a Volume Moving Average (VMA) as a reference:
Common Periods: 20 or 50.
20-Period VMA: Reflects roughly one month’s average volume, common for medium/short-term analysis.
50-Period VMA: Reflects roughly 2.5 months’ average volume, provides a longer-term baseline, smoother but lags more.
How to Choose?
Depends on your analysis timeframe. Shorter-term might use 20, longer-term 50.
No absolute best. See which VMA line on your chart seems to effectively distinguish “normal” from “abnormal” volume.
Often useful to plot both to see short-term vs. long-term average volume.
The Volume indicator, though simple and parameter-free, is an absolutely indispensable cornerstone of technical analysis. It’s the most direct reflection of market activity and participation, crucial for judging the credibility of price action.
It helps you:
Confirm Trend Strength: Price + Volume agreement is key.
Validate Breakout Authenticity: Real breakouts need volume fuel.
Identify Potential Turning Points: Through analyzing volume climaxes or exhaustion.
Gauge Market Sentiment: Panic or greed? Active or waiting? Volume tells stories.
Provide a Baseline: Use VMA to quantify relative volume levels.
For all young traders wanting to trade smarter and see the market more clearly, learning to read Volume is a mandatory step in leveling up from novice to pro! Never ignore those bars below the price chart!
Remember:
Volume is the “fuel” confirming the “engine” (price).
No parameters, but use VMA for comparison.
Price-volume relationships are core, but interpret with candle patterns and market context.
Volume on different timeframes tells different stories.
It’s a confirmation/warning tool, not a standalone system.
Alright! Hope this “deep background check” on Volume helps you out! Integrate it into your daily analysis and start listening to the market’s “heartbeat”! See ya next time! Keep analyzing!