Physical Address
304 North Cardinal St.
Dorchester Center, MA 02124
Physical Address
304 North Cardinal St.
Dorchester Center, MA 02124
Okay Crew! Settle in! Time to seriously upgrade our technical analysis arsenal! We’ve talked about Volume, OBV, A/D Line – all tracking trading volume. But the tool we’re diving into today takes volume analysis to a whole different dimension – it’s the game-changing Volume Profile Fixed Range (VPFR) indicator!
Stop just staring at those volume bars at the bottom! VPFR isn’t about when the volume happened; it tells you ‘at what price’ the most volume traded! It’s like getting an X-ray of the market, clearly showing you where the “battlegrounds” are (high volume areas) and where the “no man’s land” is (low volume areas).
Wanna know how to use VPFR to pinpoint Support/Resistance (S/R) with insane precision? Wanna figure out where the major players might have positioned themselves (their cost basis)? Wanna judge if a trend has real conviction? This tool is blowing up in crypto, futures, and stock trading, and you absolutely CANNOT afford to miss out! Let’s unlock the incredible power of VPFR together! Let’s break it down!
Volume Profile isn’t an indicator “invented” by a single person; it’s more like an evolution and visual upgrade in how we analyze volume.
Conceptual Roots: Market Profile® – While not exactly the same, the Volume Profile concept is closely related to Market Profile®, developed by Pete Steidlmayer in the 1980s. Market Profile® used letters (TPOs – Time Price Opportunities) to track how long price spent at different levels, also aiming to find the Value Area and Point of Control.
Product of Technological Advancement: As computing power increased and data became more accessible, analysts could directly process and visualize the actual volume traded at each specific price level, not just time spent there. Volume Profile is the manifestation of this analytical approach.
Different Profile Types:
Volume Profile Visible Range (VPVR): Automatically analyzes the volume distribution for all the candles visible on your current chart screen.
Volume Profile Session Volume (VPSV): Analyzes the volume distribution for each trading session (e.g., daily, weekly).
Volume Profile Fixed Range (VPFR): This is our star today! It allows you to manually select a specific time range (like a particular uptrend, downtrend, or consolidation zone) and analyzes the volume distribution only within that range. Maximum flexibility!
Purpose: Shifting from “Time Dimension” to “Price Dimension” – Traditional volume looks at volume over time. Volume Profile looks at volume at specific price levels. It answers not “How much volume traded on Monday?” but “How much total volume traded at the $40,000 price level?”
So, VPFR emerged to give traders a more precise, flexible tool to analyze, within a specific market behavior period, which price levels were the real high-traffic zones.
The core of VPFR is taking the volume from your selected range and plotting it horizontally next to the price axis, not vertically below it!
Step One: You Choose the Range!
This is the most critical first step for VPFR. You manually draw a range on your chart, from a starting point (candle) to an ending point (candle). You frame the exact price action you want to analyze!
Step Two: Volume Segmentation
The indicator takes every single candle within your chosen range.
It then looks inside each candle to see how much volume occurred at different price increments within that candle (this requires more granular data, like tick data or M1 data, depending on the platform).
Step Three: Aggregation at Price Levels
It sums up all the volume that traded at the same price level (or within a very small price bucket) across all the candles in your selected range.
For example, it adds up all volume traded between $40,000.00 – $40,000.99 within your range.
Step Four: Plotting the Histogram
On the right side of the chart (or left, depending on settings), it draws a horizontal bar (Histogram Bar) for each price level.
The length of the bar represents the total volume accumulated at that price level. Longer bar = more volume; shorter bar = less volume.
Often, bars are colored to distinguish buying volume (Up Volume) vs. selling volume (Down Volume) (based on tick data direction or simply candle direction), but the total length is the primary focus.
Step Five: Highlighting Key Levels
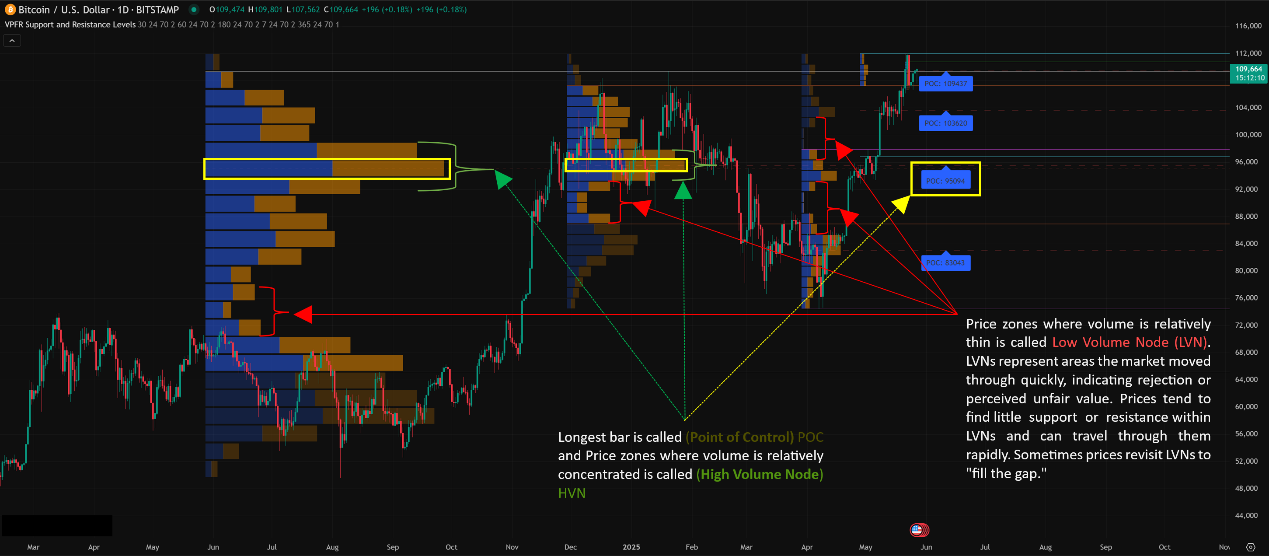
Point of Control (POC): The single price level with the highest traded volume within your selected range (i.e., the longest horizontal bar). This is where the market spent the most time and had the most agreement/disagreement. Usually marked with a distinct colored line.
Value Area (VA): The price range where the bulk of the trading volume occurred. Traditionally defined as the range containing 70% of the total volume in the selected range (this percentage is adjustable). Often highlighted with different background shading.
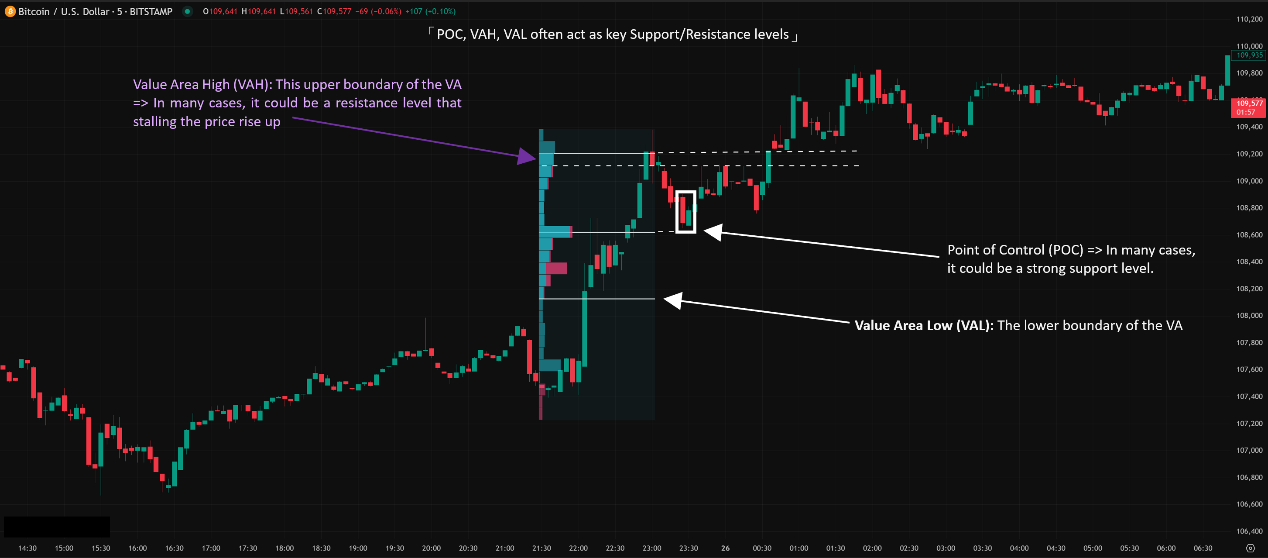
Value Area High (VAH): The upper boundary of the VA.
Value Area Low (VAL): The lower boundary of the VA.
High Volume Node (HVN): Price zones where volume is relatively concentrated (forming a “peak” in the histogram). The POC is the largest HVN. HVNs represent areas of market acceptance, where consolidation or strong support/resistance often forms.
Low Volume Node (LVN): Price zones where volume is relatively thin (forming a “valley” in the histogram). LVNs represent areas the market moved through quickly, indicating rejection or perceived unfair value. Prices tend to find little support or resistance within LVNs and can travel through them rapidly. Sometimes prices revisit LVNs to “fill the gap.”
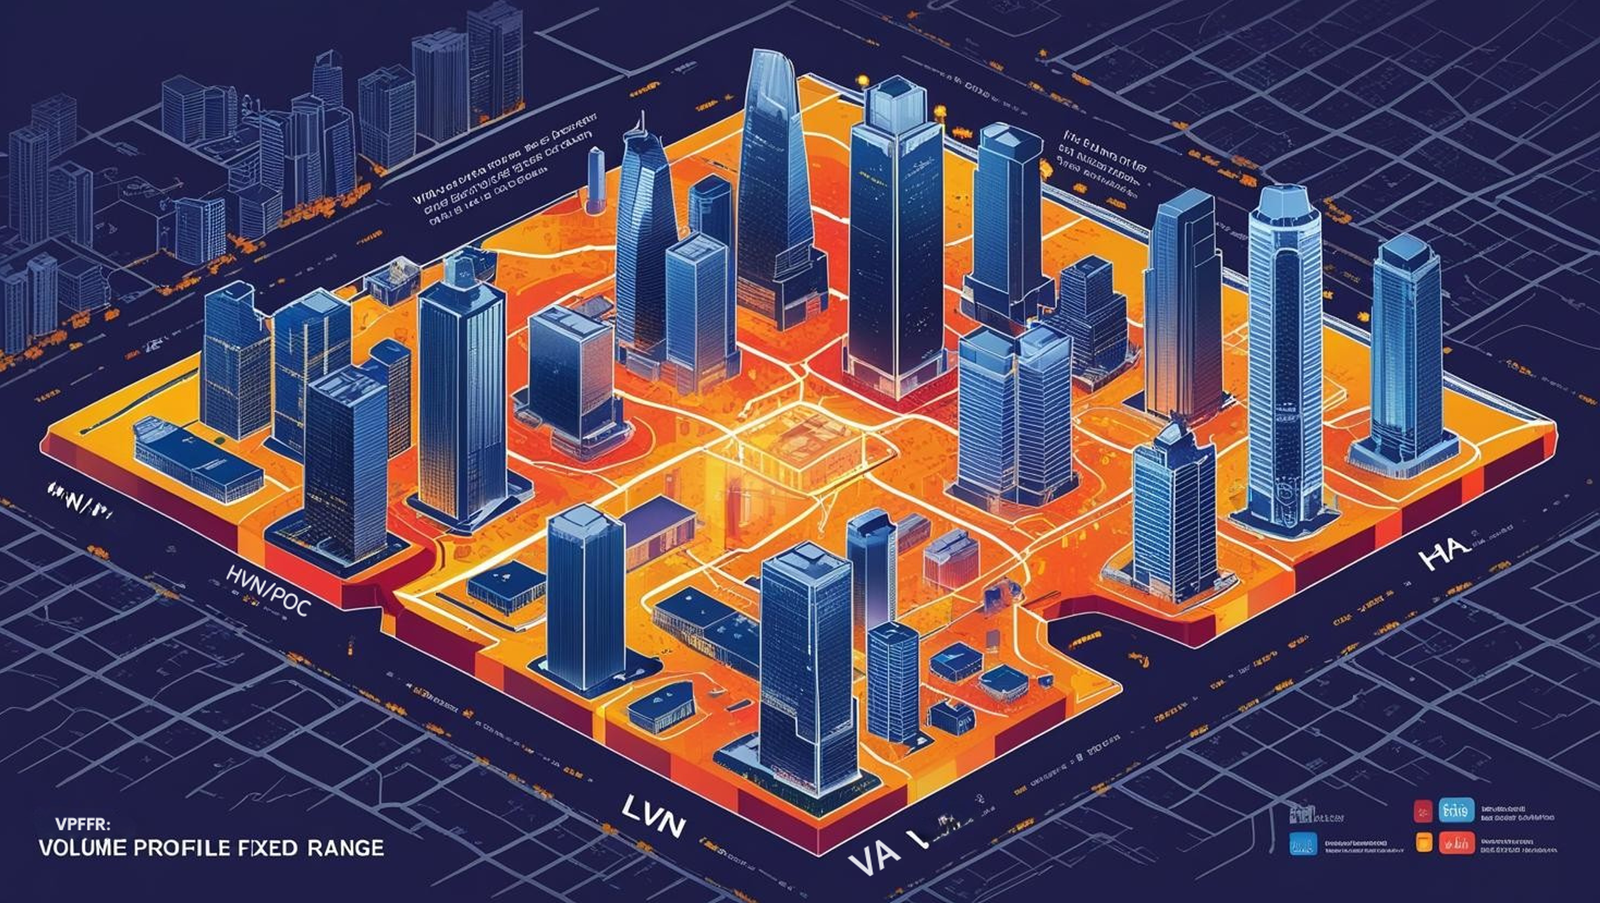
Think of a City Heatmap:
VPFR is like a “population density map” for the city (your selected price range).
HVN/POC: Downtown, busy districts, major transit hubs – where most people gather and activity happens.
VA: The main commercial and residential zones where ~70% of the activity occurs.
LVN: Parks, suburbs, or expressways – areas people pass through quickly without lingering.
「VPFR Core Components Explained」
VPFR’s power lies in the incredibly intuitive price level information it provides.
Level 1: Basic Usage – Precision Support & Resistance
This is VPFR’s most direct and commonly used function:
POC as a “Magnet Zone” and S/R:
The POC is where the most volume traded, representing the strongest “memory” and “agreement” level for the market within that range.
Magnetic Effect: Price often tends to gravitate back towards the POC.
Support/Resistance: The POC frequently acts as strong support (if price is above it) or resistance (if price is below it). How price reacts when testing the POC is critical.
VAH and VAL as Range Boundary S/R:
VAH (Value Area High) typically acts as resistance. Price rallying to VAH might stall. A firm hold above VAH could signal market acceptance of higher value, potentially continuing the trend.
VAL (Value Area Low) typically acts as support. Price falling to VAL might find buyers. A firm break below VAL could signal market rejection of the previous value area, potentially continuing the downtrend.
HVNs as Potential S/R Zones:
Other High Volume Nodes (HVNs) can also be viewed as potential support or resistance zones. Price often moves between different HVNs.
Usage Summary:
Select the VPFR tool and draw it across the price swing or consolidation area you’re interested in.
Identify the POC, VAH, and VAL.
Watch how price reacts when it pulls back or rallies to these levels. Combine with candlestick patterns to judge potential entries, exits, or stop placements.
「Using VPFR (POC, VAH, VAL) for S/R Example」
Once you’ve mastered basic S/R, you can interpret deeper messages.
A. Reading Profile Shapes:
The overall shape of the VPFR histogram reveals insights about the market state during that period:
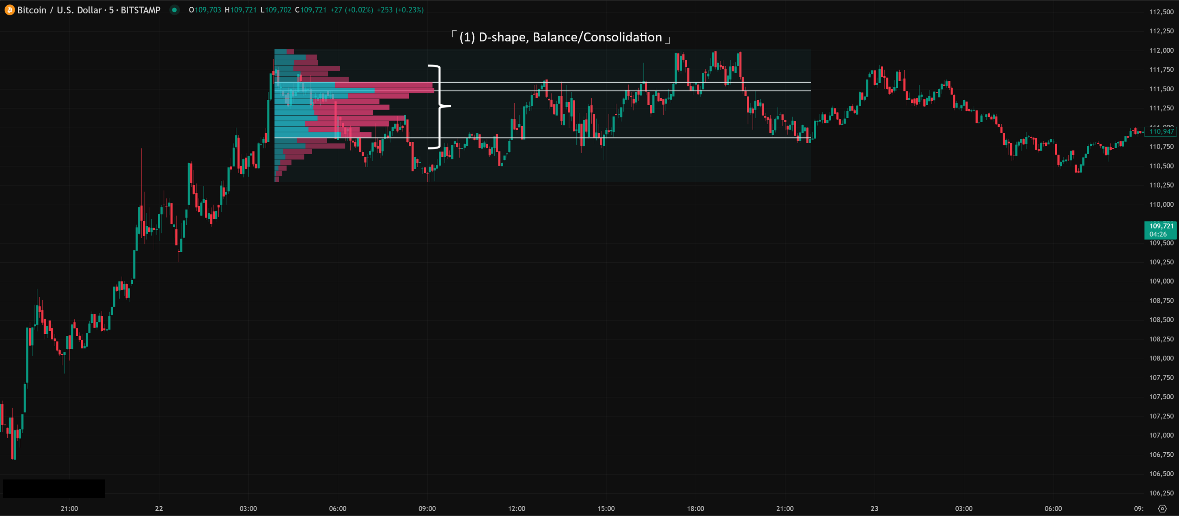
D-shape Profile:
Shape: Like a capital ‘D’, fat in the middle (POC centered), relatively symmetrical top and bottom.
Meaning: Represents market balance. Price is oscillating within a widely accepted value area; buyers and sellers are evenly matched. Typically seen in sideways consolidation.
Implication: Watch for price to break out above VAH or below VAL, potentially signaling the start of a new trend.
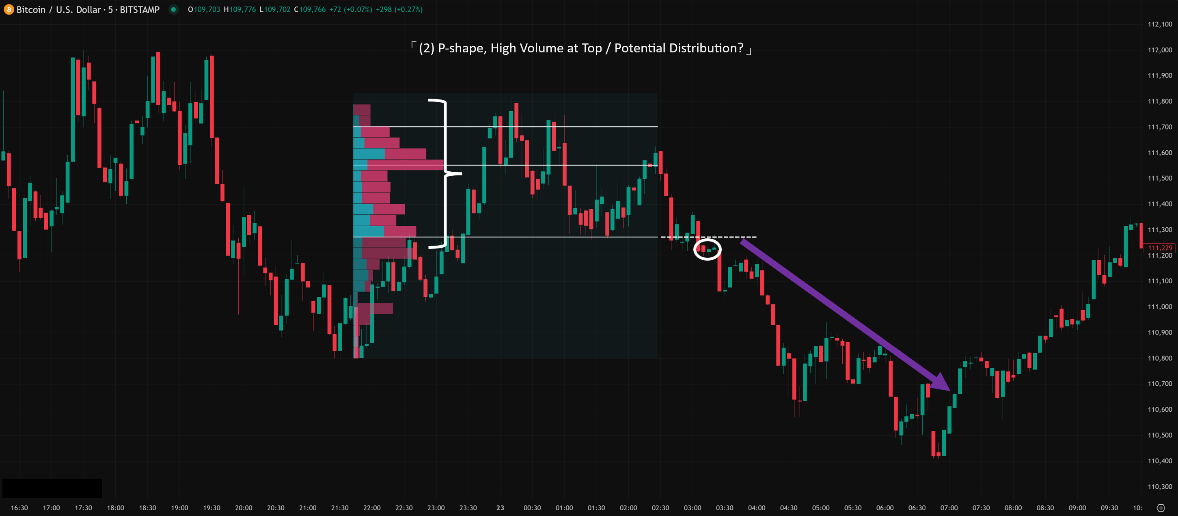
P-shape Profile:
Shape: Like a capital ‘P’, volume concentrated towards the top (POC is high).
Meaning: Could represent a short squeeze or profit-taking/liquidation at the end of a rally. Price moved up quickly, then heavy volume/turnover occurred at the highs.
Implication: If a P-shape forms at the top of a rally, be cautious of a potential reversal. Breaking below the P-shape’s VAL could confirm downside.
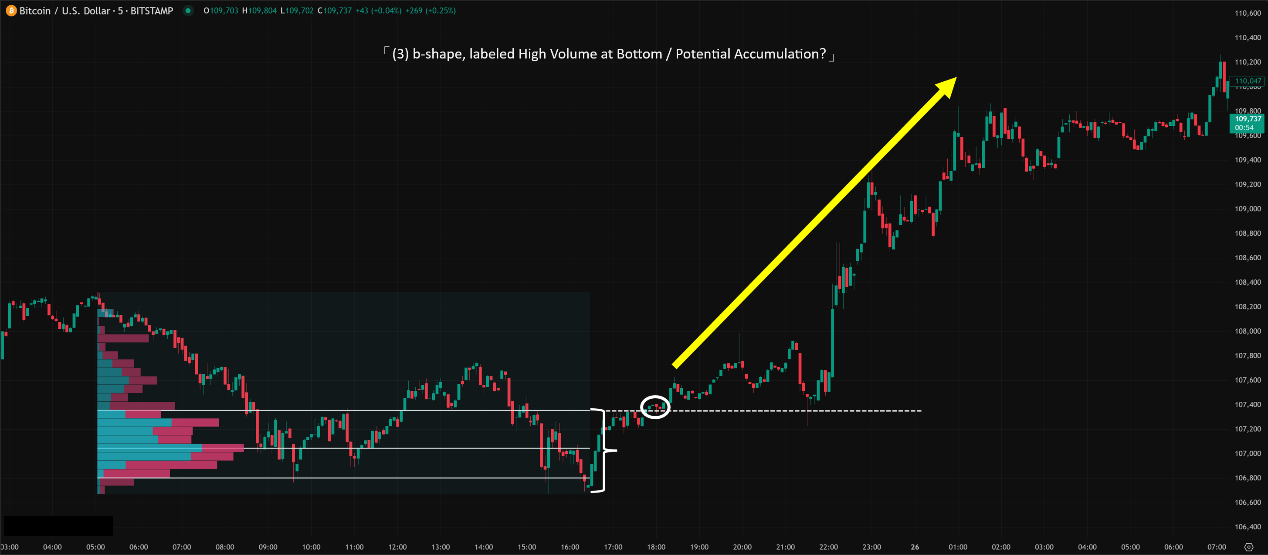
b-shape Profile:
Shape: Like a lowercase ‘b’, volume concentrated towards the bottom (POC is low).
Meaning: Could represent accumulation after a panic sell-off, or distribution during a weak bounce. Price moved down quickly, then heavy volume/turnover occurred at the lows.
Implication: If a b-shape forms at the bottom of a decline, look for signs of accumulation. Breaking above the b-shape’s VAH could confirm upside.
B-shape Profile:
Shape: Like a capital ‘B’, has two or more distinct high-volume areas (HVNs), potentially separated by an LVN.
Meaning: Represents the market potentially moving between two balance areas during a trend, or a wider consolidation with two main areas of contention.
Implication: Note which HVN price is currently trading within and whether it’s attempting to move towards the other HVN or break out of the entire B-shape structure.
「Common VPFR Profile Shapes (D, P, b)」
B. High vs. Low Volume Node (HVN vs LVN) Analysis:
HVN (High Volume Node):
Meaning: Fair value zone, acceptance area, high liquidity. Price spent significant time here; trading was active.
Usage:
Strong S/R: Price tends to slow down upon entering an HVN. The edges (especially POC) act as key S/R.
Consolidation Zone: Price often ranges within an HVN.
Targets: If price enters an HVN from below, the top of the HVN might be a target, and vice versa.
LVN (Low Volume Node):
Meaning: Unfair value zone, rejection area, low liquidity. Price traversed this zone quickly; little interest in trading here.
Usage:
Fast Track: Once price enters an LVN, it often moves quickly through it to the next HVN. Little S/R within.
Breakout Target: If price breaks out of an HVN, the next target is often the next HVN across the LVN.
Potential “Gap Filling”: Sometimes price revisits LVNs to “test” or “fill” this low-liquidity area.
Stop Loss Caution: Setting stops within LVNs can be risky as price can easily slice through them.
C. Combining VPFR into Trading Strategies:
Strategy 1: Range Trading
Identify a D-shape Profile.
Look for buy setups near VAL (with candle confirmation), targeting VAH or POC.
Look for short setups near VAH (with candle confirmation), targeting VAL or POC.
Place stops outside the VA range.
Strategy 2: Breakout Trading
Identify a D-shape or HVN consolidation.
Wait for a volume-confirmed (using traditional volume bars) breakout above VAH or below VAL.
Enter on a successful retest of VAH/VAL/POC as S/R.
Target the next significant HVN or use other methods.
Strategy 3: Trend Pullback Entry
Draw VPFR over a clear uptrend/downtrend leg.
Wait for price to pull back (uptrend) or rally (downtrend) to the POC, VAL/VAH, or another significant HVN within that leg.
Enter on a confirming reversal candlestick pattern.
Strategy 4: LVN Passage Trade
Identify when price confirms a breakout from an HVN and enters an LVN.
Anticipate a quick move through the LVN.
Target the edge of the next HVN.
Higher risk strategy requiring quick execution and good judgment.
D. Parameter Settings & Time Intervals (VPFR Specifics)
Main Parameter: The Fixed Range YOU Choose!
This has the biggest impact! Which period do you select?
Common Choices:
The most recent swing: (Swing High to Swing Low / Swing Low to Swing High) – Analyze pullback S/R for that move.
A clear consolidation box: Analyze the POC/VA of the range to anticipate breakout direction and subsequent S/R.
Specific trading sessions: (e.g., London, NY) – Though VPSV might be easier for this.
Specific event periods: (e.g., around a major news release).
Secondary Parameters (Platform Internals):
Number of Rows / Row Size: Determines the “resolution” of the VP histogram.
More Rows / Smaller Size: Higher resolution, more detail, but potentially more noise, less clear HVN/LVNs.
Fewer Rows / Larger Size: Lower resolution, smoother look, clearer HVN/LVNs, but might miss finer details.
Default/Recommendation: Many platforms offer “Auto” calculation or default to around 70-100 rows. Usually fine without much tweaking unless you have specific needs.
Value Area Percent:
Default: 70%. This is the traditional Market Profile® standard, roughly representing one standard deviation, the perceived “fair value” zone.
Adjustments: Some might use 68% (stricter 1 std dev) or 80% (looser). Changing this affects VAH/VAL locations. Beginners should stick to 70%.
Timeframe on Chart:
The chart timeframe you draw VPFR on can influence the granularity of data used.
E.g., Drawing VPFR over the last month on a Daily chart uses Daily candle data. Drawing over the same month on an H1 chart uses much more H1 candle data, potentially yielding a more detailed profile.
Recommendation: Typically draw VPFR on your primary trading timeframe to analyze the specific range you’re interested in (e.g., H1 trader draws on H1 chart over the last swing).
E. Which Combos Are “Hot” & Effective? (Effective Application, Not Settings)
VPFR’s power isn’t in a specific “parameter combo” but in how you select the range and interpret the resulting profile.
Hottest Use 1: Consolidation Breakout Strategy
How: Identify clear range -> Draw VPFR over range -> Find POC, VAH, VAL -> Wait for volume-confirmed break of VA -> Enter on successful retest of VAH/VAL/POC.
Effect: Uses VP analysis of the range to improve breakout timing and entry points.
Hottest Use 2: Trend Pullback Precision Entry
How: Identify clear trend -> Draw VPFR over the trend leg -> Find POC & key HVNs -> Wait for price pullback/rally to these high-volume zones -> Enter on candle confirmation.
Effect: Stops guessing pullback levels; enter where the market has shown significant interest, improving win rate for trend trades.
Hottest Use 3: Mapping High/Low Liquidity Zones for Trade Planning
How: Draw VPFR over a larger area to map HVNs and LVNs -> Expect price to slow/consolidate in HVNs and accelerate through LVNs -> Use this to set more logical profit targets (e.g., edge of next HVN) and stop-loss placements (avoiding LVNs).
Effect: Provides a better roadmap for potential price paths.
F. Best Parameter Combos? (The Verdict on Settings)
Core Parameter: It’s the Fixed Range you manually select! There’s no “best,” only what’s most relevant to your analysis goal.
Internal Parameters:
Row Size/Number of Rows: Use platform Auto or default (e.g., 70-100 rows) is usually sufficient. Don’t overthink it unless needed.
Value Area Percent: Stick to the default 70% unless you have a very specific, well-tested reason to change it.
Conclusion: The magic of VPFR lies in range selection and profile interpretation, not parameter tweaking!
Volume Profile Fixed Range (VPFR) is an incredibly powerful advanced analysis tool. By liberating volume from the time axis and plotting it against price, it gives you an unprecedentedly clear view of:
Where the market really cares about trading (POC, HVNs).
The generally accepted value range (VA).
The “vacuum” zones price can slice through (LVNs).
It helps you:
Pinpoint S/R levels with high precision.
Understand market structure and balance points.
Judge potential breakout direction and strength.
Plan more logical entries, stops, and targets.
Interpret the results of money flow battles over specific periods.
For young traders looking to elevate their analysis beyond basic indicators and gain deeper insights into price-volume dynamics, VPFR is an absolute “must-learn” technique!
Remember:
VPFR shows volume distribution at price levels.
POC, VA, HVN, LVN are the core elements to interpret.
Choosing the right Fixed Range is key to its effective use.
Internal parameters are usually fine on default.
ALWAYS combine with Price Action and other analysis tools!
Alright! Hope this super-detailed guide to VPFR helps you master this awesome tool! Go fire up your TradingView (or other platform that offers VPFR) and start practicing using volume distribution to see the market! See ya next time! Trade safe, trade smart!