Physical Address
304 North Cardinal St.
Dorchester Center, MA 02124
Physical Address
304 North Cardinal St.
Dorchester Center, MA 02124
Yo! What’s up, Trend Chasers and Market Explorers! Time for another tech analysis gear upgrade! We’ve looked at price, volume, money flow… think we can dig even deeper? Wanna know if price movements are “smooth” or “efficient”? Today, we’re unlocking a rather unique indicator designed specifically to measure the efficiency of price movement – introducing the EOM (Ease of Movement), sometimes called EMV (Ease of Movement Value) indicator!
Sounds a bit abstract, right? “Ease of Movement”? Exactly! The core idea behind this indicator is: if the price moves a lot but on very little volume, it means the move was “easy” with little resistance (High EOM); conversely, if the price barely moves despite huge volume, it means the move was “difficult” with lots of resistance (Low EOM).
Wanna know how to use EOM to judge the “health” of a trend? How to use its MA line to find signals? Why some say it can help filter out false breakouts? Okay! Stay tuned, ’cause we’re about to dive deep into the world of EOM and figure out how to measure the market’s “smoothness”! Let’s flow!
The creation of EOM is credited to another giant in the technical analysis field.
The Inventor: Richard W. Arms Jr. – Yes, the very same Richard Arms who invented the famous Arms Index (TRIN)! He introduced the Ease of Movement concept in the late 1960s and detailed it in his writings.
Design Philosophy: Quantifying the Efficiency of Price-Volume Relationship – Arms felt that simply looking at price changes or volume size wasn’t enough. He wanted to know: how much volume does it take to move the price a certain amount? Or, put another way, how far can the price move for a given amount of volume? This is the concept of “efficiency.”
High Efficiency (High EOM): Price makes a significant move on relatively low volume. This might indicate little disagreement or resistance in that direction.
Low Efficiency (Low EOM): Requires very high volume to produce even a small price move. This might indicate a strong battle or high resistance at that price level.
Purpose: Identifying the Path of Least Resistance – EOM attempts to calculate the ratio between price movement range and volume to find the direction where price moves most easily. Theoretically, a healthy trend should progress with relative “ease.”
So, EOM was designed to provide a quantitative measure to assess the efficiency of price changes relative to the volume required, thereby judging trend strength and potential resistance.
EOM’s calculation is a bit involved with several steps, but understanding the core logic is key.
Step 1: Calculate Midpoint Move
Midpoint Move = [ (Today’s High + Today’s Low) / 2 ] – [ (Yesterday’s High + Yesterday’s Low) / 2 ]
This measures how much the center of the daily price range has moved, reflecting the shift and magnitude of the price’s “center of gravity.”
Step 2: Calculate Box Ratio
Box Ratio = [ (Today’s Volume / Scale Factor) ] / (Today’s High – Today’s Low)
Breaking it down:
The numerator standardizes volume (dividing by a large Scale Factor, like 1M or 100M, just to make the number smaller for comparison with price).
The denominator is the price range for the day.
The whole ratio means: How much (standardized) volume was required per point of price range? A higher ratio means more volume was needed to move price; a lower ratio means less volume moved price significantly.
Note: The Scale Factor is usually internal to the platform; users don’t need to set it. If Range = 0, Box Ratio might default to 1 to avoid division by zero.
Step 3: Calculate the EOM Value!
Single Period EOM = Midpoint Move / Box Ratio
Core Logic:
If the Midpoint Move is large (price center shifted a lot) AND the Box Ratio is small (didn’t require much volume per point), the resulting EOM value will be large (positive or negative). Price moved easily!
If the Midpoint Move is small (price center barely budged) AND the Box Ratio is large (took a lot of volume), the resulting EOM value will be close to 0. Price movement was difficult!
Step 4: Smoothing
The single-period EOM values can be very volatile. Therefore, they are typically smoothed using a Moving Average to create the EOM line we see on charts.
The most common method is a 14-period Simple Moving Average (SMA).
The Final Result: The EOM indicator on our chart is usually a line oscillating around a Zero Line.
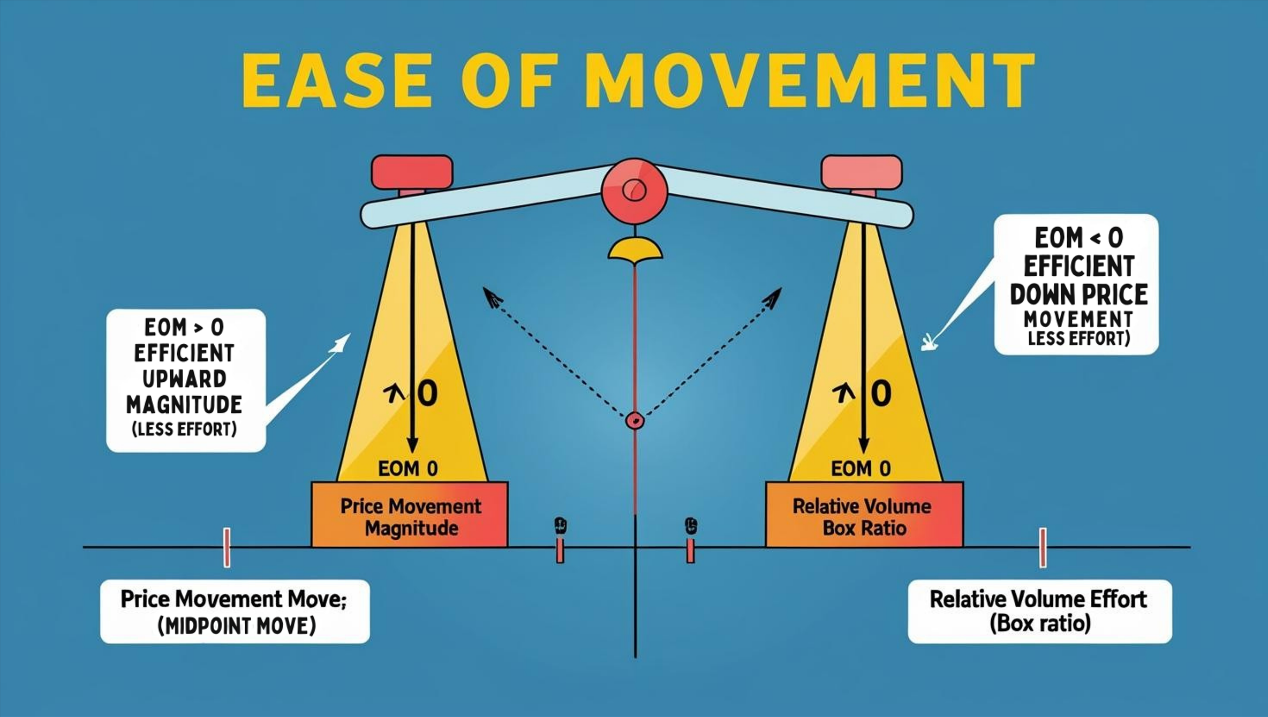
EOM > 0: Indicates price tends to move upwards with relative ease (requiring proportionally less volume). Higher positive values = easier upward movement.
EOM < 0: Indicates price tends to move downwards with relative ease. Lower negative values (more negative) = easier downward movement.
EOM near 0: Indicates the price movement requires significant volume; movement is difficult. Could be consolidation or a struggling trend.
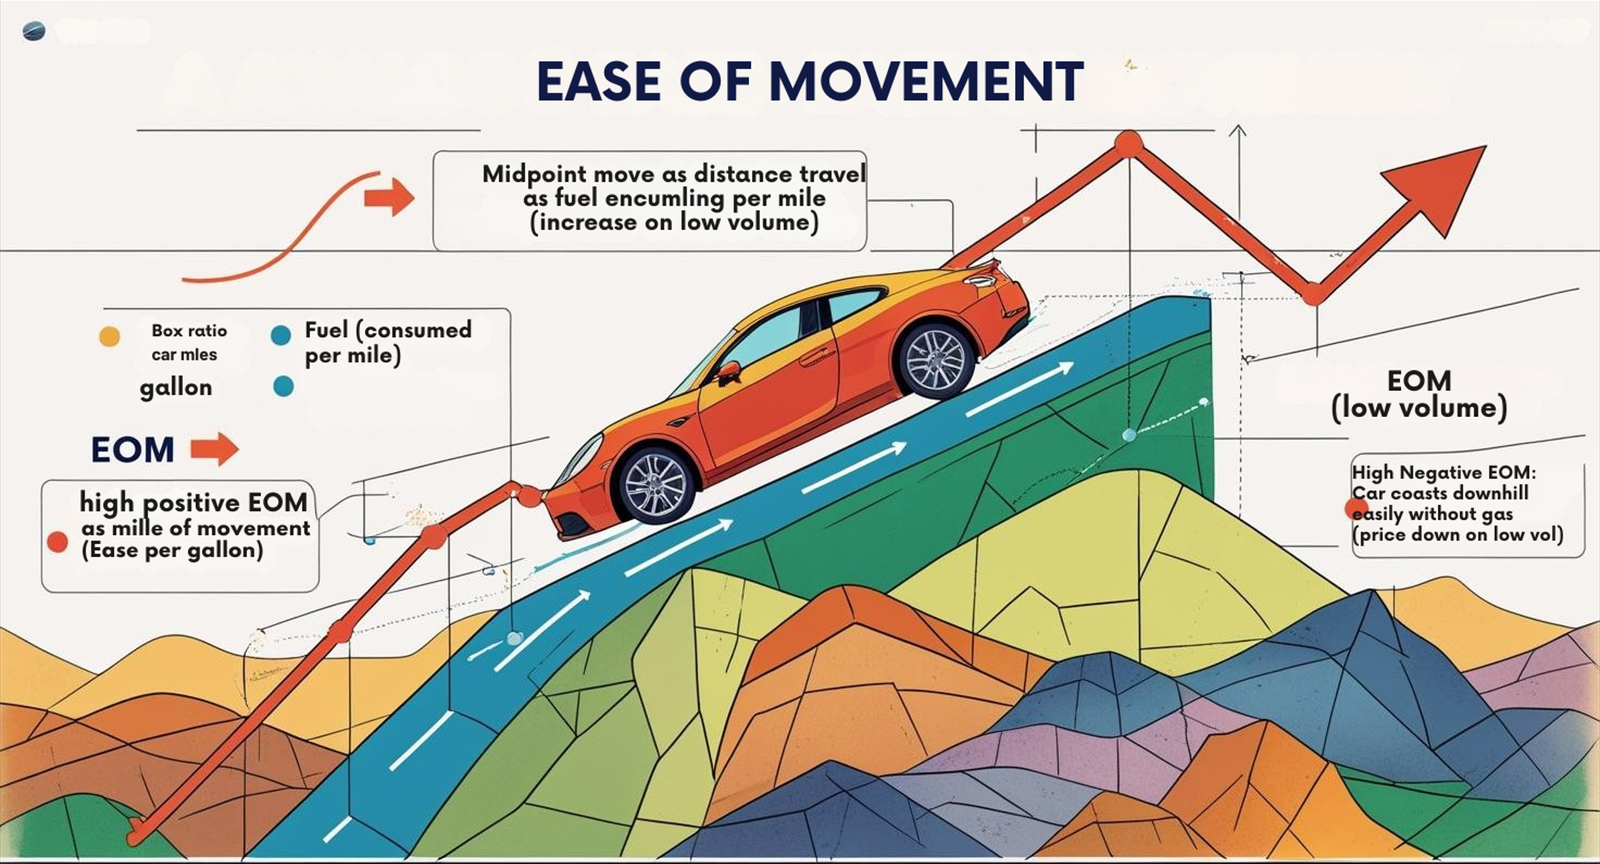
Think of Driving a Car:
Midpoint Move: Distance traveled.
Box Ratio: Fuel consumed / Miles per gallon (inversely).
EOM: Like “Miles traveled per gallon” (efficiency).
High Positive EOM: Car is fuel-efficient going uphill (price up on low vol).
High Negative EOM: Car coasts downhill easily without gas (price down on low vol).
EOM near 0: Car is a gas guzzler, needs lots of fuel (volume) to move even a little (price struggles).
「EOM Indicator Concept Explained」
EOM’s usage primarily revolves around gauging trend efficiency and sometimes using MA crossovers (though interpreted differently than typical oscillators).
Level 1: Basic Usage – Zero Line & Trend Efficiency
Zero Line Crossover:
EOM Crossing Above Zero: May indicate price is beginning to move upward more easily, a potential bullish signal or confirmation.
EOM Crossing Below Zero: May indicate price is beginning to move downward more easily, a potential bearish signal or confirmation.
Note: Like many oscillators, zero line crosses can be frequent, especially in ranging markets. Best used as a supplementary signal.
Gauging Trend Efficiency:
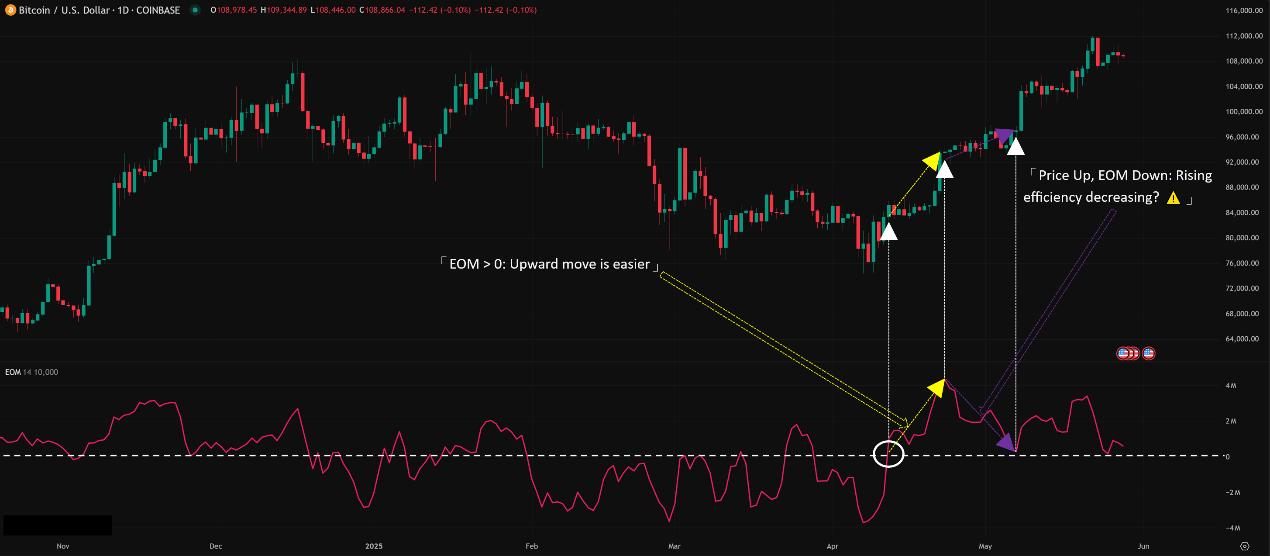
Price Rising + EOM Consistently > 0 (or Rising): Healthy uptrend; price is rising efficiently without excessive volume churn.
Price Falling + EOM Consistently < 0 (or Falling): Healthy downtrend; price is falling with relatively little resistance.
Price Rising + EOM Falling (but > 0) or Near 0: ⚠️ Warning! Uptrend might require increasingly more volume to sustain, efficiency is decreasing, potentially signaling trend weakening or struggle.
Price Falling + EOM Rising (but < 0) or Near 0: ⚠️ Warning! Downtrend might be meeting increasing support, efficiency of decline is decreasing, potentially signaling a slowdown or end of the down move.
「EOM Zero Line & Trend Efficiency Example」
Level 2: Advanced Plays – MA Crossovers & Confirmation Signals
The most common specific trading signals for EOM involve its relationship with its MA line.
A. EOM and its Moving Average Crossovers (The Primary Signal Method – Clarified):
The Core Play (Standard Interpretation): Unlike many oscillators where you add another MA to the indicator for crossovers, the standard EOM line displayed on charts is typically already a smoothed version (e.g., a 14-period SMA of the raw EOM values). Therefore, the most common usage involves observing:
The EOM (14) line’s position relative to the Zero Line.
The trend/slope of the EOM (14) line itself.
(Adding another, shorter MA on top of the EOM (14) for crossovers is technically possible but not the standard application and often less reliable).
Refined Core Play 1: Using the Smoothed EOM Trend:
Observe the overall direction of the EOM(14) line. Upward slope suggests increasing upward efficiency; downward slope suggests increasing downward efficiency.
Drawing trendlines on the EOM(14) line itself; breaks can be early signals.
Refined Core Play 2 (Less Common): EOM(1) vs. EOM(14):
If the platform allows plotting the unsmoothed, single-period EOM, some might compare it to the smoothed EOM(14). Crossovers could be used as signals, but this is rare and platform-dependent.
Most Standard Usage: Focus remains on EOM(14) vs. Zero:
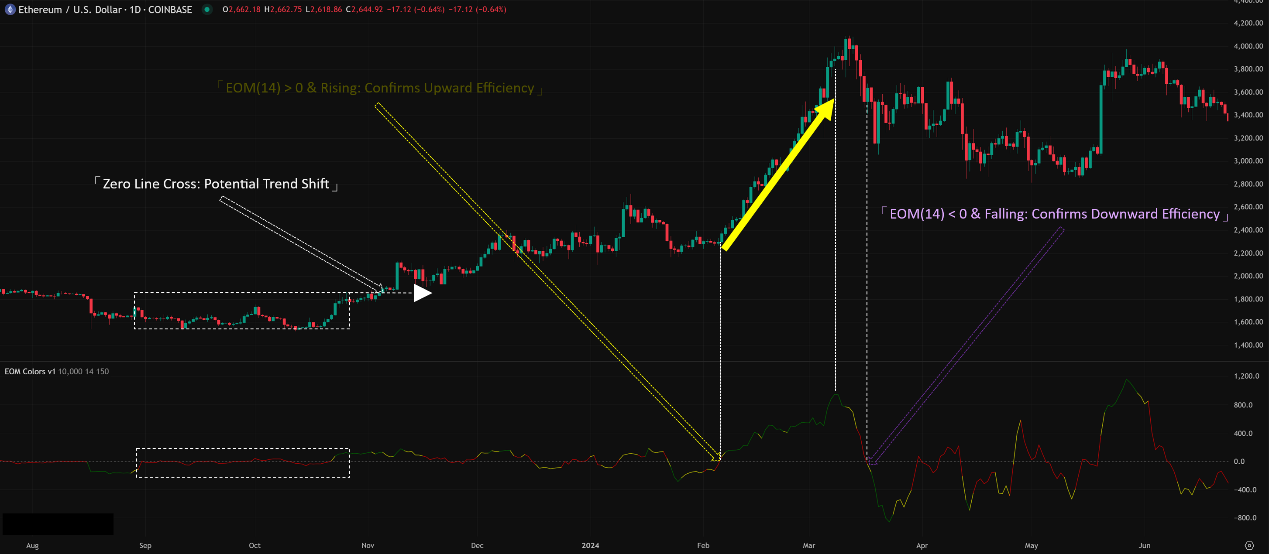
EOM(14) > 0 and Rising: Bullish confirmation, uptrend is efficient.
EOM(14) < 0 and Falling: Bearish confirmation, downtrend is efficient.
EOM(14) Crossing Zero: Potential trend change signal.
「Meaning of EOM(14) Relative to Zero Line」
B. Observing Divergence (Gauging Efficiency Disagreement):
Principle: When price makes a new high/low, but the EOM(14) fails to confirm this with increased efficiency (i.e., doesn’t make a corresponding new high/low).
Patterns:
Bullish Divergence: Price Lower Low (LL), EOM(14) Higher Low (HL). Suggests it’s taking increasingly more volume/effort to push prices lower; downward efficiency is decreasing.
Bearish Divergence: Price Higher High (HH), EOM(14) Lower High (LH). Suggests it’s taking increasingly more volume/effort to push prices higher; upward efficiency is decreasing.
How to Use: As a warning signal of potential trend exhaustion. If price is rising, but EOM shows it’s becoming more “difficult,” be cautious. Vice versa for downtrends. Requires Price Action Confirmation!
C. EOM as a Breakout Confirmation Filter:
How to Use: When price attempts to break a key level (S/R, trendline, range), check the status of EOM(14):
Upside Breakout + EOM(14) Clearly > 0 and/or Rising: Breakout may be more reliable as the upward move has relative ease.
Upside Breakout + EOM(14) Near 0 or < 0: ⚠️ Caution, potential false breakout; the move lacks efficiency and might be struggling.
Downside Breakout + EOM(14) Clearly < 0 and/or Falling: Breakout may be more reliable.
Downside Breakout + EOM(14) Near 0 or > 0: ⚠️ Caution, potential false breakout (bear trap); the downward move might be meeting resistance/lack of ease.
Effectiveness: Uses EOM’s “efficiency” reading to filter out breakouts that might be forced or lack conviction.
D. Parameter Settings & Time Intervals (EOM Parameter Nuances)
Core Parameter: Smoothing MA Period
Default / Most Common: 14-period SMA. This is the standard proposed by Richard Arms and widely used, providing a medium-short term efficiency view.
How Global Traders Play It?
Standard Sticklers: Many traders use the default 14 periods, accepting it as a smoothed indicator.
Fine-Tuning Experimenters:
Shorter Periods (e.g., 9, 10): Makes the EOM line react faster to recent efficiency changes. Might suit short-term traders but increases noise and whipsaws around zero.
Longer Periods (e.g., 20, 30): Creates a smoother EOM line, better reflecting medium-term efficiency trends. Fewer signals but potentially more stable. Suits swing or trend traders.
Reality Check: Compared to RSI or MACD, fewer traders drastically alter EOM’s parameter; 14 remains dominant.
Timeframe:
EOM is sensitive to volume data and price range.
Short Timeframes (Intraday): EOM can be very volatile, especially during low volume periods or when the price range is extremely narrow. Indicator readings might become unstable or produce extreme values. Use with extreme caution.
Higher Timeframes (H4, D1, W1): Generally perform better. On these timeframes, the daily or weekly range and volume are more representative, leading to more meaningful and stable EOM trends and zero line relationships.
E. Which Combos Are “Hot” & Effective? (Effective EOM Strategies)
EOM’s effectiveness lies in its unique “efficiency” perspective. The best combos integrate this view into your analysis workflow.
Most Robust Use: EOM(14) as Trend Confirmation/Filter
Execution:
Determine the primary trend using other methods (MAs, trendlines).
Consider longs primarily when EOM(14) > 0.
Consider shorts primarily when EOM(14) < 0.
Be cautious or avoid trades if price direction conflicts with EOM efficiency direction (e.g., price up, EOM near 0 or falling).
Effectiveness: Adds confidence to trend-following trades, filters out potentially inefficient or trapping moves.
Breakout Confirmation Enhanced: Price Breakout + Volume Spike (Traditional Vol) + EOM > 0 (for Up) / < 0 (for Down)
Execution: Combine three confirmations. Price breaks key level, traditional volume bar shows significant increase, AND EOM confirms the move was relatively “easy” in that direction.
Effectiveness: Provides very strong confirmation for breakout trades.
Divergence + Price Confirmation (Standard Approach)
Execution: Identify divergence on EOM(14), then wait for confirming price action (candle patterns, structure breaks) before entering.
Effectiveness: Acts as an early warning system for potential trend exhaustion.
F. Best Parameter Combos? (The EOM Parameter Verdict)
Core Smoothing MA Period:
Strongest Recommendation / Standard: 14-period SMA. Start here in almost all cases.
Reasonable Tweak Range: 9 to 21 periods. If, after testing, a slightly shorter or longer period better suits your specific instrument and style, experimentation within this range is plausible. Drastic deviations are generally not recommended.
Timeframe:
Highly Recommended: Prioritize H4, D1, W1. EOM generally provides more stable and reliable signals on these higher timeframes.
Intraday Use: Proceed with extreme caution due to potential noise and instability.
Conclusion: EOM’s power isn’t in complex parameter combos, but in understanding its “efficiency” concept and using the standard 14-period EOM as a confirmation tool, preferably on higher timeframes.
Ease of Movement (EOM / EMV) is a unique technical indicator combining price range movement and volume to measure the relative efficiency or ease of price changes.
It helps you:
Judge the efficiency of trend progression: Is it moving easily or struggling?
Confirm trend and breakout signals: Does the “ease” support the price move?
Provide warnings of potential trend exhaustion: Via declining efficiency or divergence.
Identify the path of least resistance: EOM far from zero suggests easier movement.
For young traders looking to dig deeper into price-volume relationships and understand the “quality” of a trend beyond just direction, EOM offers a distinct analytical dimension.
Remember:
EOM’s core is efficiency: High EOM = easy, near 0 = difficult.
14-period SMA is the standard smoothing parameter.
The Zero Line is a key reference.
Divergence and changes in efficiency are key observations.
Best used on H4 or higher timeframes generally.
Combine with Price Action and other indicators for confirmation!
Alright! Hope this deep exploration of EOM gives you a fresh perspective on measuring trend “quality”! Add it to your watchlist and see how it helps you gauge the real strength behind market moves! See ya! Trade efficiently!