Physical Address
304 North Cardinal St.
Dorchester Center, MA 02124
Physical Address
304 North Cardinal St.
Dorchester Center, MA 02124
Yo Yo Yo! What’s good, my fellow Market Alchemists and Crypto Crusaders! ⚡️ Get ready for another deep dive into the TA toolbox! We just talked about the OG Fibonacci Retracements, where you gotta find the right swing points to draw those magic lines. But let’s be real, sometimes the market’s moving fast, or maybe you’re just starting out and not super confident picking those highs and lows. What if… what if the machine could do it for you?
Enter the Auto Fibonacci Retracement indicator! ✨ This is basically your standard Fibo tool hooked up with an algorithm that tries to automatically identify significant swing highs and lows and draws the retracement levels for you, saving you time and maybe some guesswork!
But is it really that simple? Can you trust the algo? How does it actually work? What are its settings, and how do the pros really use it (or not use it)? Alright, let’s get into the nuts and bolts of Auto Fib Retracements and see if this automated assistant deserves a spot in your trading setup! Let’s automate this analysis!
Unlike fundamental indicators invented by market legends, Auto Fibonacci isn’t a concept invented by one person. It’s a software feature, an evolution driven by technology and user demand.
Built on Fibonacci’s Legacy: The core principles are still rooted in Leonardo Fibonacci’s sequence and the Golden Ratio (0.618, 0.382, etc.). The retracement levels themselves (23.6%, 38.2%, 50%, 61.8%) are the standard ones.
The “Auto” Evolution: As charting platforms became more powerful, developers looked for ways to automate common TA tasks. Manually drawing Fibs, especially for beginners or across many charts, can be time-consuming and subjective (which swing high/low do I pick?). Auto Fib was created to address this.
Driven by Demand: Traders wanted a quicker, potentially more objective way to apply Fibonacci levels. Charting platforms responded by creating algorithms that attempt to identify significant swing points automatically based on specific rules.
Goal: Speed, Convenience, Objectivity (Potentially): The primary aim of Auto Fib tools is to instantly plot potentially relevant Fibonacci levels based on recent price action, removing the need for manual drawing and the user’s subjective choice of anchor points.
Therefore, Auto Fibonacci Retracement isn’t a new theory, but a technological implementation designed to make applying the existing Fibonacci Retracement theory faster and easier.
The magic (or sometimes, the frustration) lies in the algorithm that automatically picks the start and end points (the 0% and 100% levels). While the exact code varies between platforms (TradingView, MT4/5, etc.), the general logic usually involves:
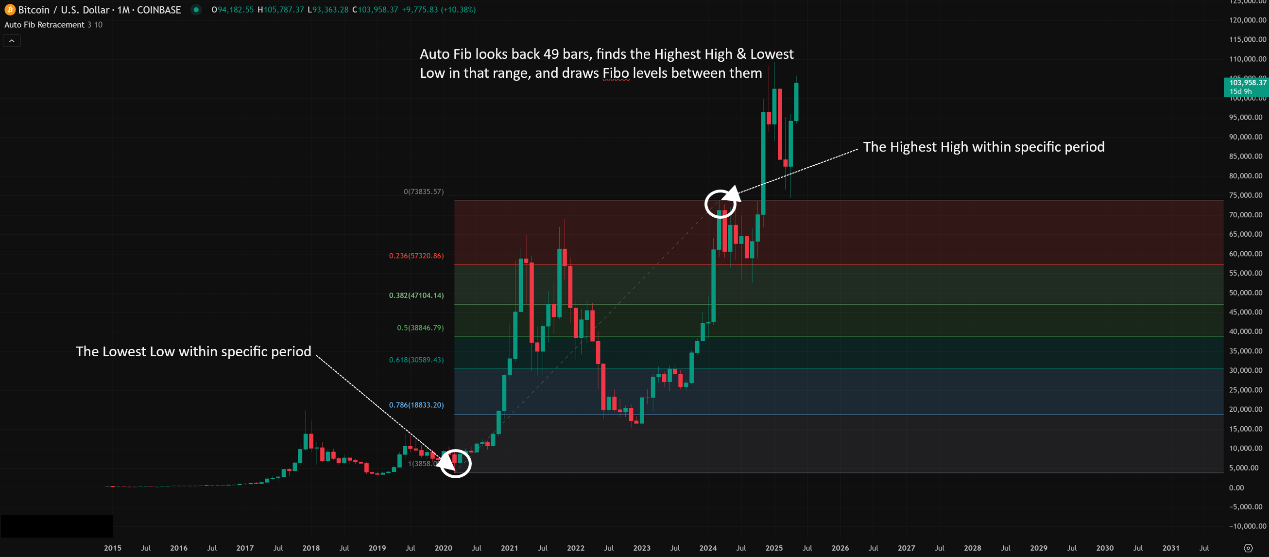
Lookback Period (The Main Setting!): The indicator looks back over a specified number of recent price bars (e.g., the last 100 bars). This is the primary parameter you can usually adjust.
Identifying Highs and Lows: Within that lookback period, the algorithm identifies the absolute highest high price and the absolute lowest low price.
Anchoring the Fibonacci: These highest high and lowest low points within the lookback period become the automatic anchor points for the 0% and 100% levels.
In an apparent uptrend within the lookback period (overall price moved up), it typically anchors 0% at the lowest low and 100% at the highest high.
In an apparent downtrend within the lookback period, it typically anchors 100% at the highest high and 0% at the lowest low.
Drawing the Levels: Once the 0% and 100% anchors are set, the indicator automatically draws the standard Fibonacci retracement levels (23.6%, 38.2%, 50%, 61.8%, etc.) between them.
Dynamic Updates (Usually): As new price bars form, the indicator constantly re-evaluates the highest high and lowest low within its lookback window. If a new absolute high or low is made within that window, the anchor points (and thus all the Fibonacci levels) will automatically redraw.
Think of it like Auto-Focus on a Camera:
You point the camera (your chart view).
The camera’s algorithm looks at the scene (the lookback period) and tries to find the most prominent subjects (highest high / lowest low) to focus on.
It automatically adjusts the focus (draws the Fibonacci levels).
If something new and more prominent enters the scene (new high/low), the auto-focus might shift (the Fibonacci redraws).
「How Auto Fibonacci Selects High/Low」
Level 1: Basic Usage – Quick S/R Check & Idea Generation
Instant S/R Levels:
The biggest advantage is speed. Add the indicator, and boom – you instantly have potential S/R levels plotted based on recent price action.
Use these auto-drawn levels (especially 38.2%, 50%, 61.8%) just like manually drawn ones: look for price reactions, potential bounce/rejection points, and candlestick confirmations.
Quick Trend Context:
The direction the Auto Fib is drawn (Low-to-High or High-to-Low) instantly tells you the indicator’s assessment of the dominant trend within its lookback period.
Idea Generation:
It can quickly highlight potential pullback zones you might have missed, serving as a starting point for further analysis.
Level 2: Advanced Plays – Verification, Parameters & Knowing When to Override
This is where you need to be smart and not just blindly trust the automation.
A. CRITICAL STEP: Verify the Algorithm’s Swings!
The Problem: Algorithms follow rules, but they don’t understand market context like a human eye can. The highest high or lowest low in the lookback period might be an insignificant spike or not part of the structurally most important recent swing.
Your Job: ALWAYS visually inspect the swing points the Auto Fib has chosen. Ask yourself:
“Do these high and low points represent the major, relevant swing I actually want to analyze right now?”
“Did it ignore a more recent, smaller swing that might be more relevant for my short-term trade?”
“Did it pick an old swing high/low that’s no longer relevant because the market structure has clearly changed?”
Action: If the auto-drawn levels look “off” or don’t align with the price action you deem most important, DO NOT rely on them solely.
B. Understanding and Tuning the Lookback Parameter (The Main Control!)
This is the most crucial setting for Auto Fib. It determines which swing the algorithm identifies.
Shorter Lookback (e.g., 10-20 bars): Will focus on very recent, smaller price swings. Useful for short-term traders, scalpers, or analyzing minor pullbacks within a larger trend. Levels will change frequently.
Medium Lookback (e.g., 30-60 bars): Will capture more intermediate swings. Suitable for swing traders or analyzing larger corrective moves.
Longer Lookback (e.g., 100+ bars): Will identify major, longer-term swing highs and lows. Useful for position traders or understanding the macro retracement picture. Levels will be more stable but might miss recent action.
How Traders Use It:
Adapting to Style: Day traders might use shorter lookbacks on H1/M15 charts. Swing traders might use medium lookbacks on H4/D1 charts. Position traders might use long lookbacks on D1/W1 charts.
Adapting to Market: In very volatile, fast-moving markets (hello, Crypto!), a shorter lookback might be needed to keep up. In slower, trending markets, a longer lookback might capture the primary trend better.
Experimentation & Visual Backtesting: The best way is to try different lookback settings on your preferred assets and timeframes and see visually which setting consistently picks swings that make sense to you and provide useful levels.
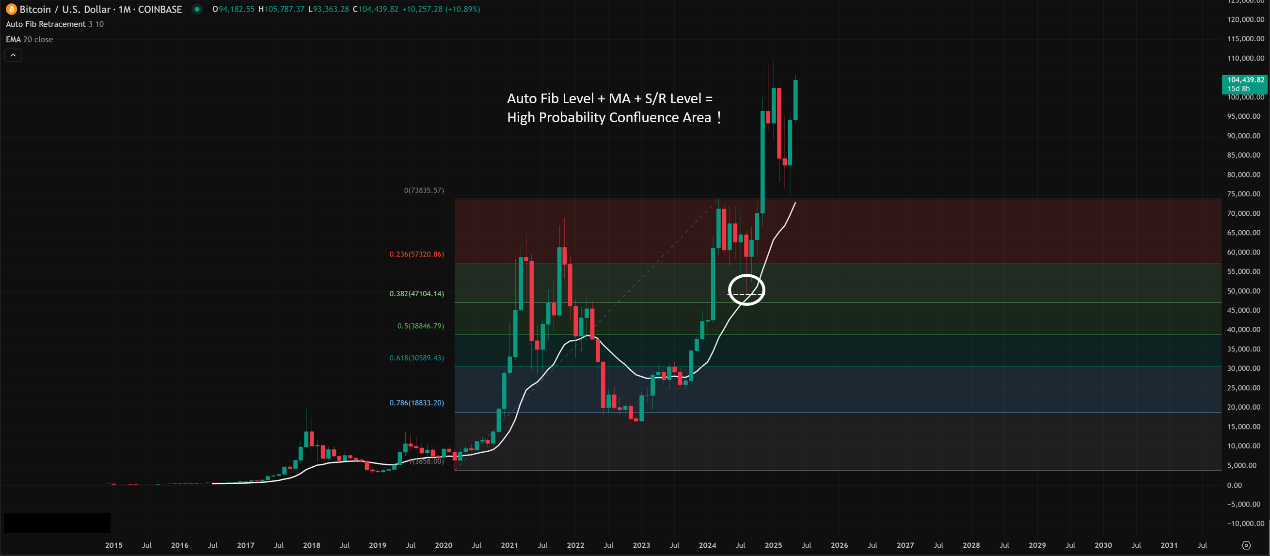
C. Confluence STILL Reigns Supreme!
Just because the levels are drawn automatically doesn’t make them magic. Their reliability skyrockets when they align with other S/R factors.
Workflow:
Let Auto Fib draw the initial levels.
Look for confluence: Does the auto-drawn 38.2% line up with a 50 MA? Does the auto-drawn 61.8% match a previous support level or a VPOC? Does the 50% level coincide with a trendline?
Prioritize trades at confluence zones indicated by the Auto Fib levels.
「Confluence with Auto Fibonacci Levels」
D. Knowing When to Switch to Manual Fibonacci:
Don’t be a slave to the algo! If the Auto Fib consistently picks swings that don’t make sense for your current analysis (e.g., it’s stuck on a huge old swing when you need to analyze the immediate pullback), turn it off or hide it, and draw the Fibo manually!
Manual drawing gives you complete control to select the exact swing high and low that are most relevant to your specific trade idea or analysis context.
Primary Parameter: Lookback Period / Depth / Length
This controls how many bars the indicator looks back to find the highest high and lowest low. This is the setting you’ll likely adjust most often.
Common Defaults: Vary widely by platform! Could be 14, 20, 50, 60, 100… Check your platform’s default.
No “Best” Value: Highly dependent on timeframe, market volatility, and personal preference (what kind of swings you want to capture).
Secondary Parameters (Less Common / Platform Specific):
Deviation / Depth (for ZigZag based Auto Fibs): Some Auto Fibs use a ZigZag indicator logic underneath. These parameters control how sensitive the ZigZag is to price reversals when identifying swings. Deeper settings = fewer, larger swings identified.
Source: Usually defaults to High/Low prices for finding swings.
Style Settings: Colors, line thickness, which Fibo levels to display (most platforms let you toggle 23.6, 38.2, 50, 61.8, 78.6, etc.). Ensure 38.2, 50, 61.8 are enabled!
Timeframe:
Auto Fib works on all timeframes.
Higher Timeframes (H4, D1, W1): Tend to produce more significant, stable swings and thus more reliable Auto Fib levels (when the lookback is appropriate).
Lower Timeframes (M15, M5): Levels will redraw much more frequently due to noise and smaller swings being picked up by shorter lookbacks. Can be useful for scalping S/R but requires active monitoring and verification.
Which Combos Are “Hot” & Effective? (Best Practices for Auto Fibonacci)
Again, no magic settings, but effective workflows exist.
Effective Workflow 1: Quick S/R Scan + Verification
Use Auto Fib (with a reasonable default or preferred lookback) for an instant overview of potential S/R on any chart.
Quickly verify: Does the chosen swing make sense visually?
If yes, look for price reactions + confluence + candle patterns near the key levels (38.2, 50, 61.8).
Effective Workflow 2: Adaptive Lookback Based on Context
If analyzing a major trend pullback, temporarily use a longer lookback to capture the main swing.
If analyzing a minor consolidation breakout, use a shorter lookback focused just on that range.
Actively adjust the lookback to match the specific price action you are analyzing.
Effective Workflow 3: MTF Auto Fibonacci Comparison
Apply Auto Fibonacci with appropriate (likely different) lookback settings on multiple timeframes (e.g., D1, H4, H1).
Look for situations where an H1 Auto Fibonacci level lines up within a D1 Auto Fibonacci ‘s Golden Pocket – powerful confluence.
Best Parameter “Combo”?
Lookback Period: Start with the platform default. Observe its behavior. If it consistently picks swings that are too large/old for your needs, decrease it. If it picks too small/insignificant swings, increase it. Visual testing is key. A range of 30-60 might be a decent starting point for swing analysis on H1/H4, but adjust based on results.
Displayed Levels: Ensure 38.2%, 50%, 61.8% are visible. Toggling 78.6% can be useful for deep pullbacks. 23.6% is often less critical.
Timeframe: Prioritize H4, D1 for more reliable swings, use lower timeframes with adjusted lookbacks and caution.
The “Hottest” approach isn’t a fixed setting, but using Auto Fib smartly: let it do the quick draw, then use your brain to verify, find confluence, and switch to manual when necessary.
Auto Fibonacci Retracement is a convenience tool. It leverages the power of standard Fibonacci analysis but automates the often subjective and time-consuming process of selecting swing points.
Pros:
Speed: Instantly plots levels.
Objectivity: Removes user bias in picking highs/lows (based on its rules).
Convenience: Great for quickly scanning multiple charts or timeframes.
Cons / Cautions:
Algorithm Limitations: May not always pick the most relevant swing points in context.
Requires Verification: NEVER blindly trust the auto-drawn levels. Always visually check.
Dynamic Redrawing: Can be confusing if levels constantly shift (though this reflects changing price action within the lookback).
Parameter Sensitivity: The lookback period significantly impacts results.
For young traders, Auto Fibonacci can be a great starting point to quickly see potential Fibo levels. But true mastery comes from understanding why those levels might matter (confluence, price action) and knowing when the algorithm needs a human override (manual drawing).
Remember:
It automates the drawing, not the analysis.
The lookback period is the key setting to understand.
ALWAYS visually verify the chosen swing points.
Confluence makes auto-drawn levels much stronger.
Don’t be afraid to go manual when needed.
Alright! Hope this deep dive into Auto Fib gives you the full picture – the good, the bad, and the algorithmic! Try it out on your platform, play with the lookback, but keep that critical thinking cap on! See ya! Happy trading!