Alright, all you Trend Spotting Snipers, Crypto “early bird” hunters, and friends looking to get ahead of the curve at market turning points! Today, we’re decoding a unique indicator that doesn’t look at how high or low the price is, but rather how long it’s been since the last new high/low – the Aroon indicator! Its name means “Dawn’s Early Light” in Sanskrit, and it was designed precisely to help you catch the “dawn” of a new trend!
What the heck is Aroon? How’s it different from other oscillators?
The Aroon indicator was developed in 1995 by the technical analysis master Tushar Chande. Unlike many oscillators focusing on overbought/oversold levels (like RSI, Stochastics), Aroon’s core purpose is to measure trend strength and direction through the dimension of time!
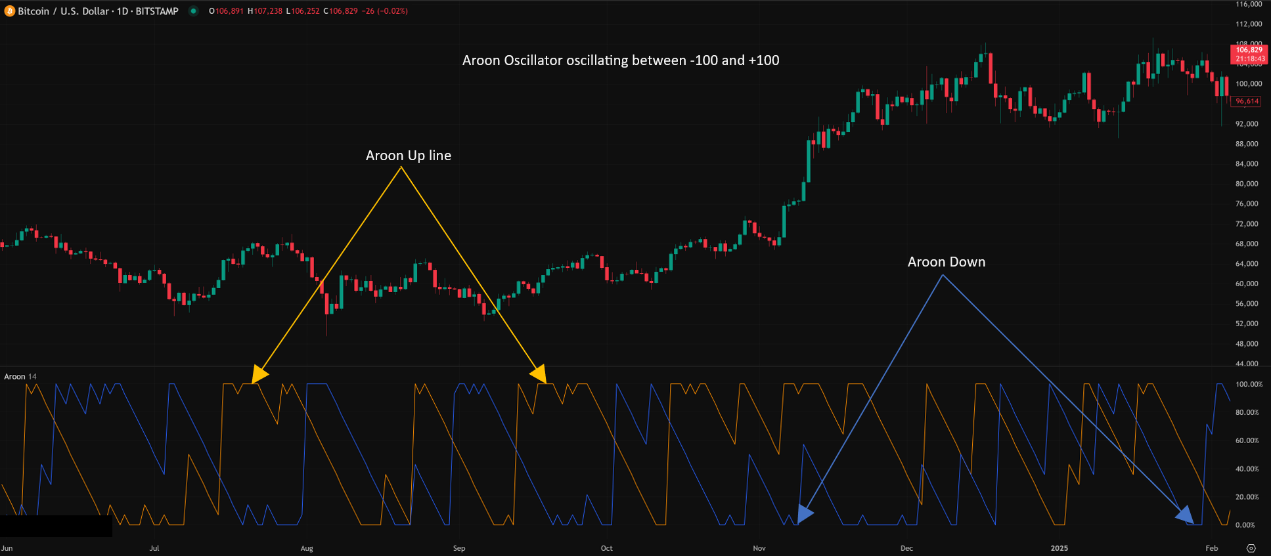
It primarily consists of two lines oscillating between 0 and 100:
- Aroon Up: Yello line (usually). Measures the number of periods since the price last made a new high. The closer the line is to 100, the more recently a new high was made. Closer to 0 means it’s been a long time.
- Aroon Down: Blue line (usually). Measures the number of periods since the price last made a new low. Closer to 100 means a new low was made more recently. Closer to 0 means it’s been a while.
There’s also the Aroon Oscillator:
- It’s simply Aroon Up – Aroon Down. Values range from -100 to +100.
- Above 0 → Bullish strength is dominant.
- Below 0 → Bearish strength is dominant.
- Crossing the 0 line can act as a signal.
「Aroon Indicator Structure: Up (Time Since High), Down (Time Since Low)」
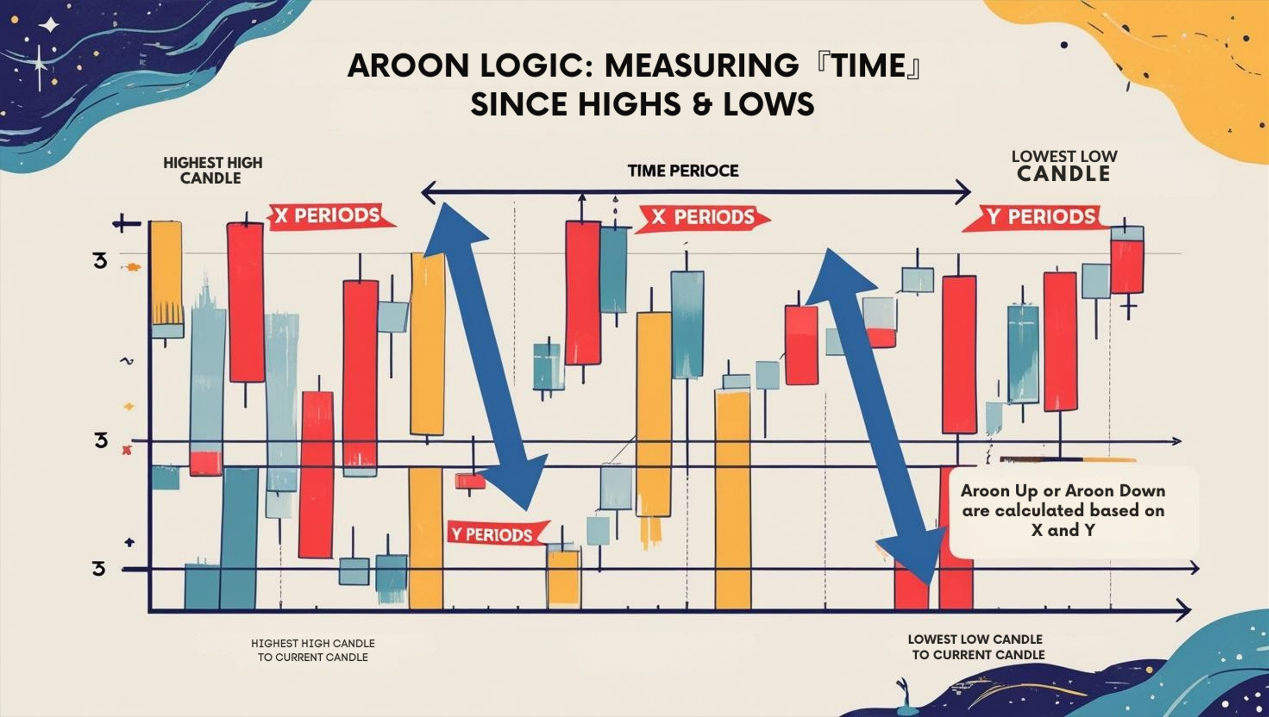
Why Look at “Time”? Aroon’s Design Logic:
Chande reasoned that a strong trend should consistently make new highs (uptrend) or new lows (downtrend).
- If Aroon Up frequently stays high (near 100), it suggests the market has enough strength to repeatedly break upwards.
- If Aroon Down frequently stays high (near 100), it suggests the market has enough strength to repeatedly break downwards.
- Conversely, if a line stays low (near 0) for a long time, it means there hasn’t been enough force to make new highs/lows recently, indicating potential consolidation.
Core Calculation Concept (Get the feel, not the exact formula):
Aroon Up = [(N – Periods Since New High) / N] * 100
Aroon Down = [(N – Periods Since New Low) / N] * 100
(Where N is the calculation period)
Example using 14-period Aroon:
- If the high occurred today (0 periods ago), Aroon Up = [(14 – 0) / 14] * 100 = 100.
- If the high occurred 7 days ago (7 periods ago), Aroon Up = [(14 – 7) / 14] * 100 = 50.
- If no new high occurred within the last 14 days (high was 14 or more periods ago), Aroon Up = [(14 – 14) / 14] * 100 = 0.
Aroon Down is calculated the same way, using the lowest low.
「Aroon Logic: Measuring ‘Time’ Since Highs & Lows」
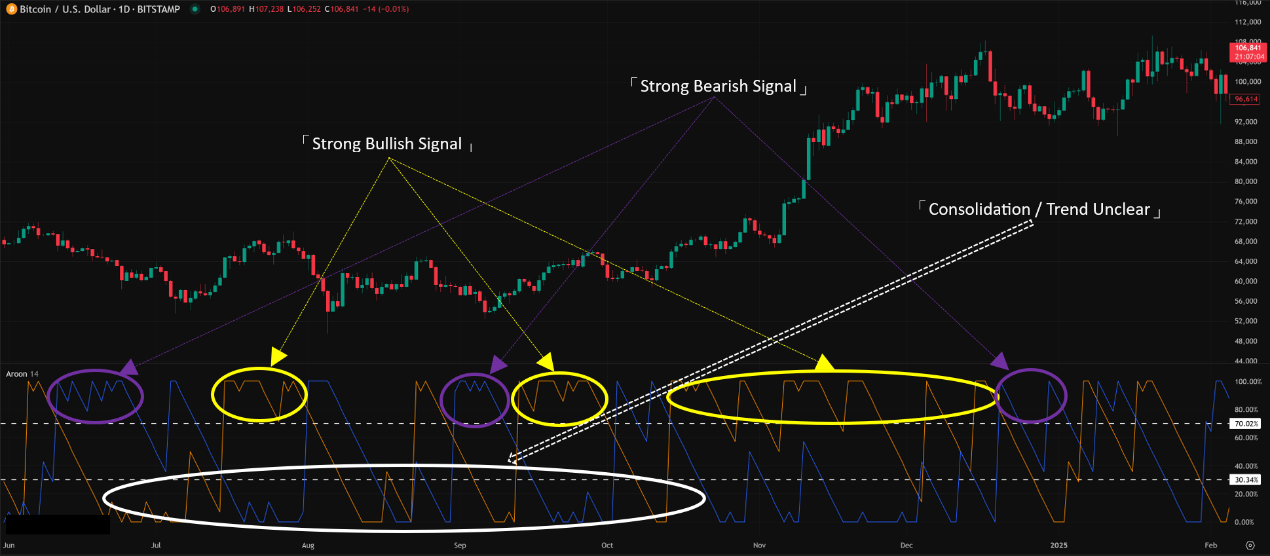
Aroon Basic Plays (Beginner’s Checkpoints):
- Gauge Trend Strength via Levels:
- Aroon Up > 70: Suggests a recent new high, uptrend might be strong.
- Aroon Down > 70: Suggests a recent new low, downtrend might be strong.
- Aroon Up < 30: It’s been a while since a new high, upside momentum might be weakening.
- Aroon Down < 30: It’s been a while since a new low, downside momentum might be weakening.
- Both lines below 30 (or 50): Market likely consolidating, lacking clear direction.
「Reading Aroon Levels: The 70/30 Zones are Key」
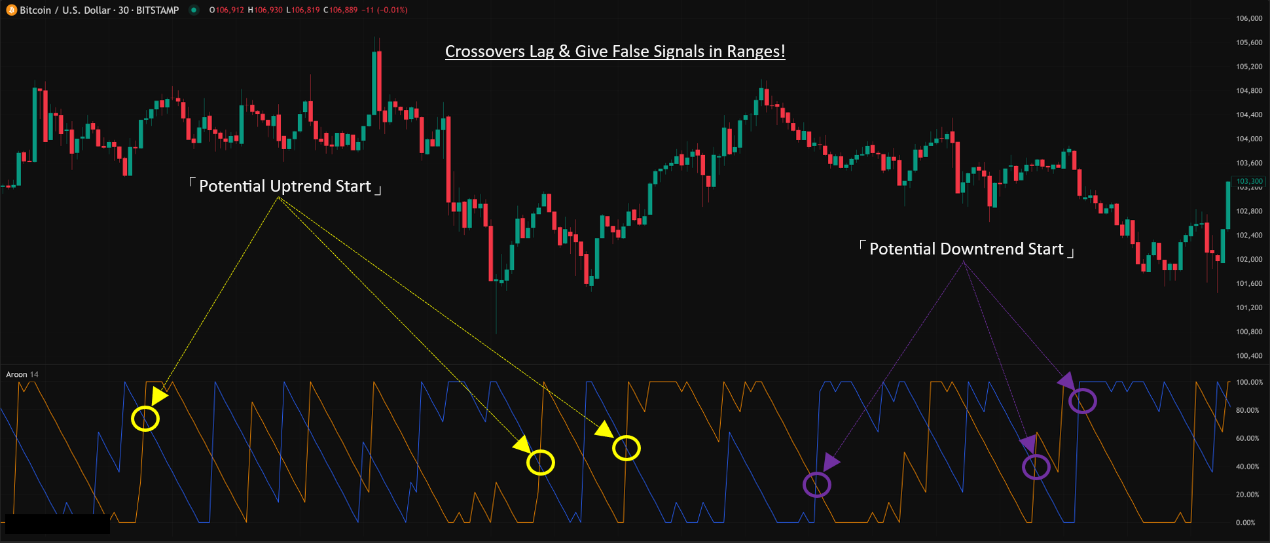
2. Watch Crossovers for Potential Turns (Be Careful!):
-
- Aroon Up (Yello) crosses ABOVE Aroon Down (Red): Potential signal that an uptrend might be starting.
- Aroon Down (Blue) crosses ABOVE Aroon Up (Green): Potential signal that a downtrend might be starting.
- Important Warning: Like many indicators, Aroon crossovers generate lots of false signals in ranging markets! Also, because Aroon focuses on time, its crossovers might lag behind price action itself. Trading crossovers alone is high risk! Best used as confirmation for other signals.
「Aroon Crossovers: Early Clues to Trend Shifts?」
3. Look for Parallel Movement:
-
- If Aroon Up stays high (e.g., >70) while Aroon Down stays low (e.g., <30), moving roughly parallel → Confirms a strong uptrend.
- If Aroon Down stays high while Aroon Up stays low, moving roughly parallel → Confirms a strong downtrend.
4. Using the Aroon Oscillator:
-
- Oscillator > 0: Bullish forces dominate.
- Oscillator < 0: Bearish forces dominate.
- Crossing the 0 Line: Corresponds to Aroon Up/Down crosses, can be used as reference.
- Extreme Values (+100 / -100): Indicate a very strong one-sided trend (just made a new high/low).
Aroon Advanced Plays & Parameter/Timeframe Breakdown (Pro Insights):
Advanced Aroon usage mainly involves leveraging its “time” aspect and combining it effectively with other tools.
Core Parameter: Period (N)
- Aroon has one primary parameter: the lookback period N.
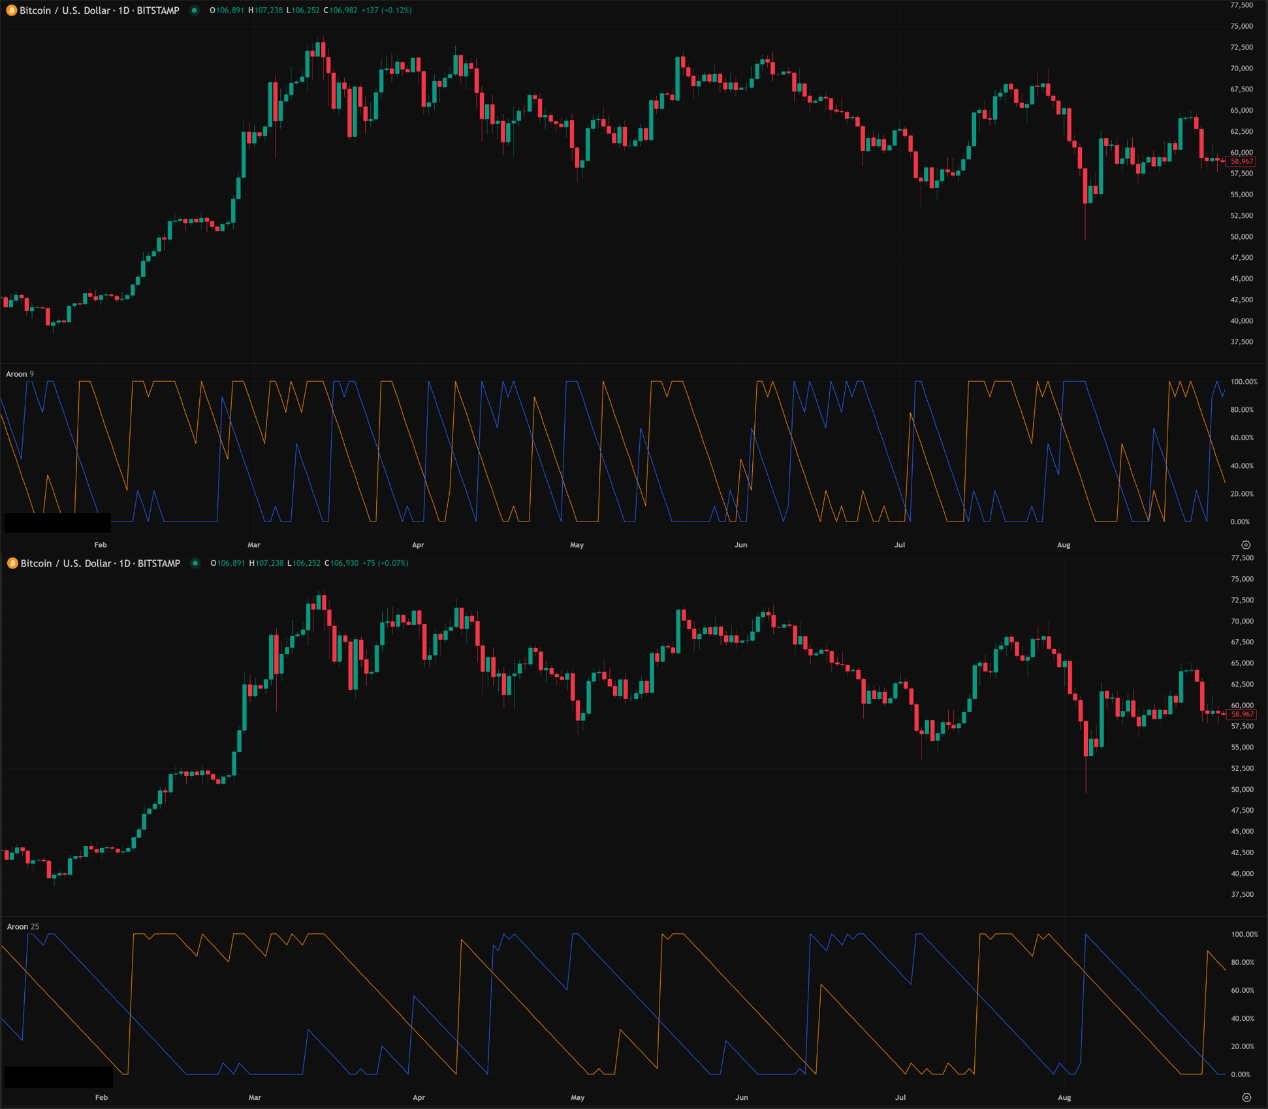
- Default Parameters: Most common are 14 or 25.
- 14 Period: Reacts faster, more sensitive to short-term trend changes. Suited for catching shorter swings or use on lower timeframes (e.g., H1, H4). But relatively more false signals.
- 25 Period: Reacts slower, smoother, better reflects medium-term trends. Suited for Daily or Weekly charts, or traders wanting to filter more short-term noise. Signals are relatively more reliable but lag more.
- Impact of N:
- Smaller N: Aroon Up/Down lines hit 100/0 faster, react quickly to recent highs/lows. But just a couple of days without a new high/low can cause them to drop, leading to choppy signals in ranges.
- Larger N: Needs a more sustained period of new highs/lows to stay near 100. Less sensitive to short-term flips. Better at showing longer trends, but much slower to react to reversals.
「Aroon Period Impact: Short = Fast+Sensitive vs. Long = Slow+Stable」
Parameter Settings Analysis & “Hottest” Combo Discussion:
- The 14 vs. 25 Choice:
- No absolute “best,” depends on your trading style and timeframe.
- Day Trader / Short Swing (H1/H4): Might prefer 14 for faster signals, but MUST use strong filtering conditions (e.g., combine with VWAP, MA trend).
- Mid/Long-Term Swing / Trend Trading (Daily/Weekly): Might prefer 25 for more reliable trend confirmation, filtering noise.
- Any More “Unique” Combos?
- Aroon parameter discussion is usually simpler than for MAs. But some experimental uses might include:
- Very Long Period (e.g., 50): Used on Weekly charts to identify very long-term trend states (any new highs/lows within the past year?).
- Combining Different Period Aroons? E.g., Aroon(14) for short-term, Aroon(50) for long-term, similar to multiple timeframe analysis. But the chart could get cluttered.
- Conclusion: The “hottest” combo is usually choosing between 14 and 25 based on your trading horizon. The key isn’t a “unique” parameter, but how you interpret and apply Aroon’s signals.
Timeframe Analysis:
- Ultra Short-Term (M1, M5, M15):
- Performs very poorly! On these timeframes, random price noise creates frequent, meaningless new highs/lows. Aroon Up/Down lines will often spike to 100, crossovers happen constantly but signify nothing. The “time accumulation” concept is lost.
- Conclusion: Aroon wasn’t designed for these noise zones.
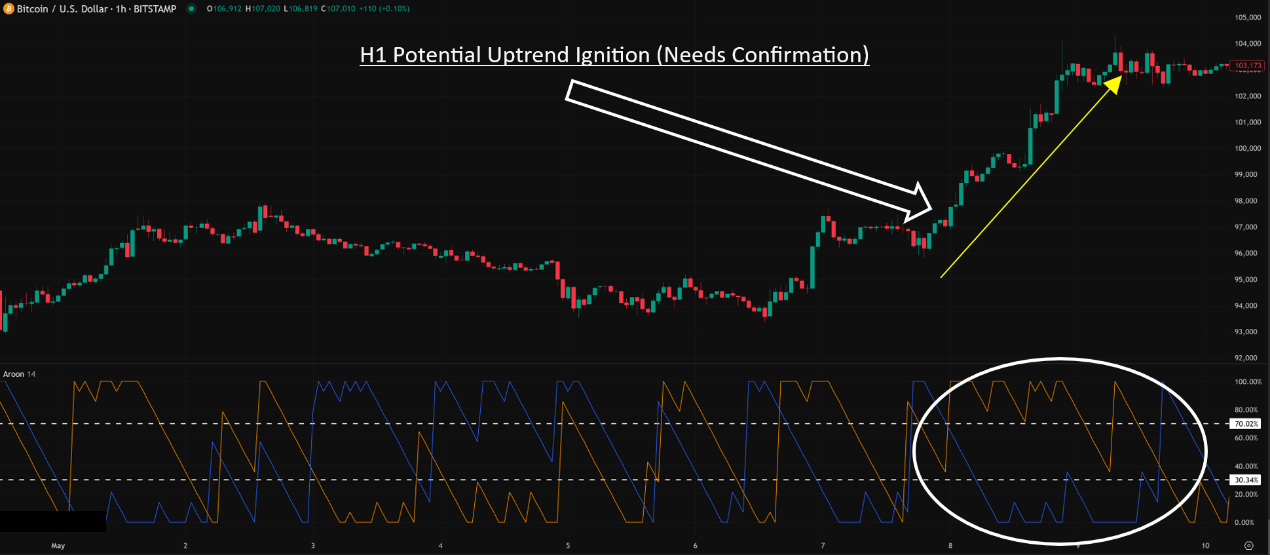
- Intraday / Short Swing (H1, H4):
- Starts becoming observable, especially H4.
- How to Use:
- Use Aroon(14) to gauge if a short-term trend might be initiating. E.g., after consolidation, Aroon Up breaking above 50/70 and crossing Aroon Down could be an early sign of bullish momentum.
- Confirm! Confirm! Confirm! Here, Aroon signals absolutely require confirmation from other indicators (e.g., breaking key resistance, MA golden cross, volume surge).
- If both Aroon lines stay low (<50), it suggests intraday chop; avoid trend strategies.
「Aroon on H1 Chart: Early Trend Initiation Clues?」
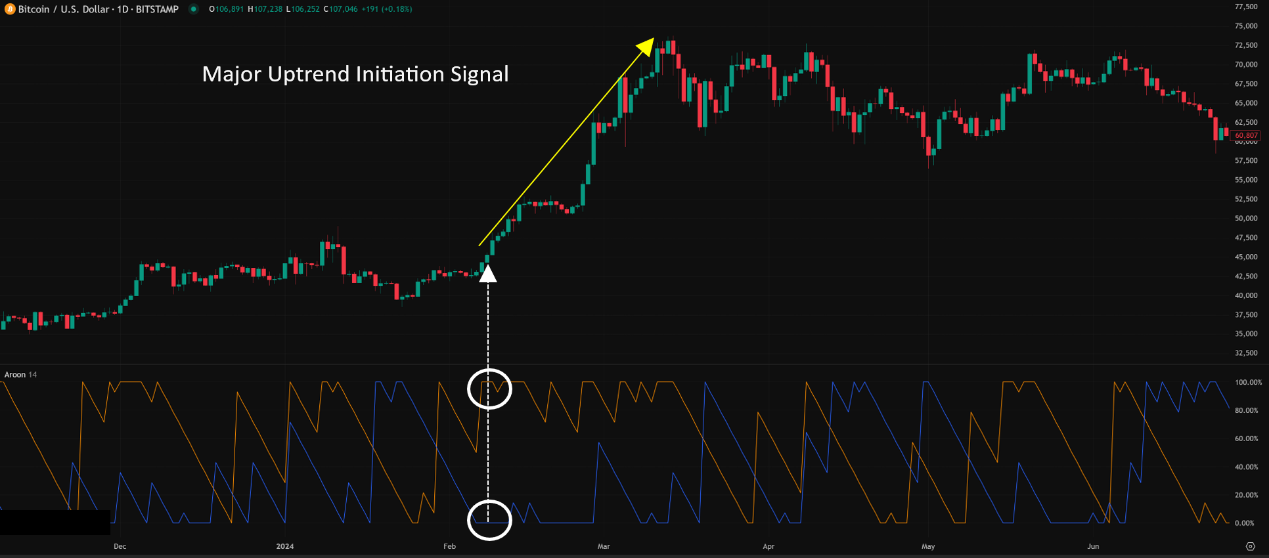
- Swing / Long-Term (Daily, Weekly):
- Aroon’s main stage! Where its power is most evident!
- How to Use:
- Use Aroon(25) to gauge major trend establishment and strength. Aroon Up consistently > 70 and Aroon Down < 30 confirms a strong uptrend. Vice versa for downtrends.
- Catching Early Trend Stages: After a long consolidation (both lines low), if one line (e.g., Aroon Up) breaks out strongly above 50/70 first, it can be a significant early signal of a new trend emerging.
- Identifying Potential Trend Exhaustion: After a strong trend, if the dominant Aroon line (e.g., Aroon Up in an uptrend) starts falling from highs, while the other line (Aroon Down) starts rising from lows and eventually crosses over, it’s a warning sign.
「Aroon on Daily Chart: Identifying Major Trend Starts」
Summary: Which Parameter Combo + Timeframe is Hottest & Most Effective? How to Use It?
- Parameters: “Hottest” is sticking to the mainstream – 14 (Short/Mid) or 25 (Mid/Long). Choose based on your style and timeframe.
- Timeframe: Daily / Weekly works best, best reflects design intent. H4 is useful support. H1 or lower is high risk, needs heavy confirmation.
- Hottest / Most Effective Usage = Understand its “Time” Core, Use as “Trend ID” and “Early Warning” Tool:
- Main function is identifying trend initiation and persistence: Watch for Aroon lines breaking key levels (50/70) and staying high/low.
- Don’t blindly trust crossovers! They lag and are unreliable in ranges. Use only as auxiliary observation points.
- Combine with ADX: Use Aroon for direction (Up > Down or Down > Up), then confirm trend strength with ADX (>25). This is a classic combo!
- Combine with Price Action: Aroon Up breaks 70 + Price breaks key resistance = Stronger signal.
- Identify Ranges: Both Aroon lines hovering low (<30 or <50) = Avoid!
Aroon: Not a Crystal Ball, But the Trend’s “Rooster Call”
With its unique “time-based” perspective, Aroon offers a way to gauge trend strength and potential early shifts. Its pros:
- Unique concept, focusing on time, not just price level.
- Good at identifying early signs of new trends.
- Can effectively identify consolidation zones.
But note the cons:
- Lagging: Especially the crossover signals.
- Whipsaws in Ranges: Crossovers are highly unreliable.
- Lines can “stick” at 100/0: During strong trends, lines might stay pinned, losing sensitivity.
- Needs Confirmation: Limited value when used alone.
「Aroon: Herald of the Trend’s Dawn (Look Through the Fog)」

Aroon is an indicator that requires some thought to understand and apply effectively. Master its time-based logic, and it can help you become more alert when a trend is just beginning to stir.
Next Steps:
- Add the Aroon indicator to your charts, try both 14 and 25 periods.
- Observe on H4, Daily, Weekly charts how Aroon Up/Down reflect the “time distance” from recent highs/lows.
- Note what happens in the market when an Aroon line breaks above 70 or below 30.
- Try combining Aroon with ADX or your favorite MAs.
- Backtest! Verify if the 14 or 25 period works better for your specific strategies.
Hope you all learn to hear the “dawn’s call” of the trend and catch every wave! 🌅📈✨