Physical Address
304 North Cardinal St.
Dorchester Center, MA 02124
Physical Address
304 North Cardinal St.
Dorchester Center, MA 02124
Alright! What’s good, Chart Wizards and Crypto Explorers! Time to level up your TA game again! Today, we’re decoding a tool that sounds pretty pro – the Auto Pitchfork! Think of it like automatically drawing angled parallel lines on your chart, creating a channel that tries to help you capture the trend’s trajectory and potential turning points! ️
Feel like drawing Fibs or trendlines is sometimes too subjective? Auto Pitchfork aims to tackle that by using an algorithm to automatically find key anchor points and draw the whole channel structure for you. Not only can it provide dynamic support and resistance, but it can also help gauge trend strength and potential acceleration or deceleration!
Wanna know how to use this “auto-fork”? How it finds its points automatically? How it differs from manual drawing? What settings work best for you? Okay! Focus up, ’cause we’re doing a full breakdown of Auto Pitchfork, from its origins to real-world application! Let’s fork the market!
The roots of Auto Pitchfork trace back to a master with unique insights into “median line theory.”
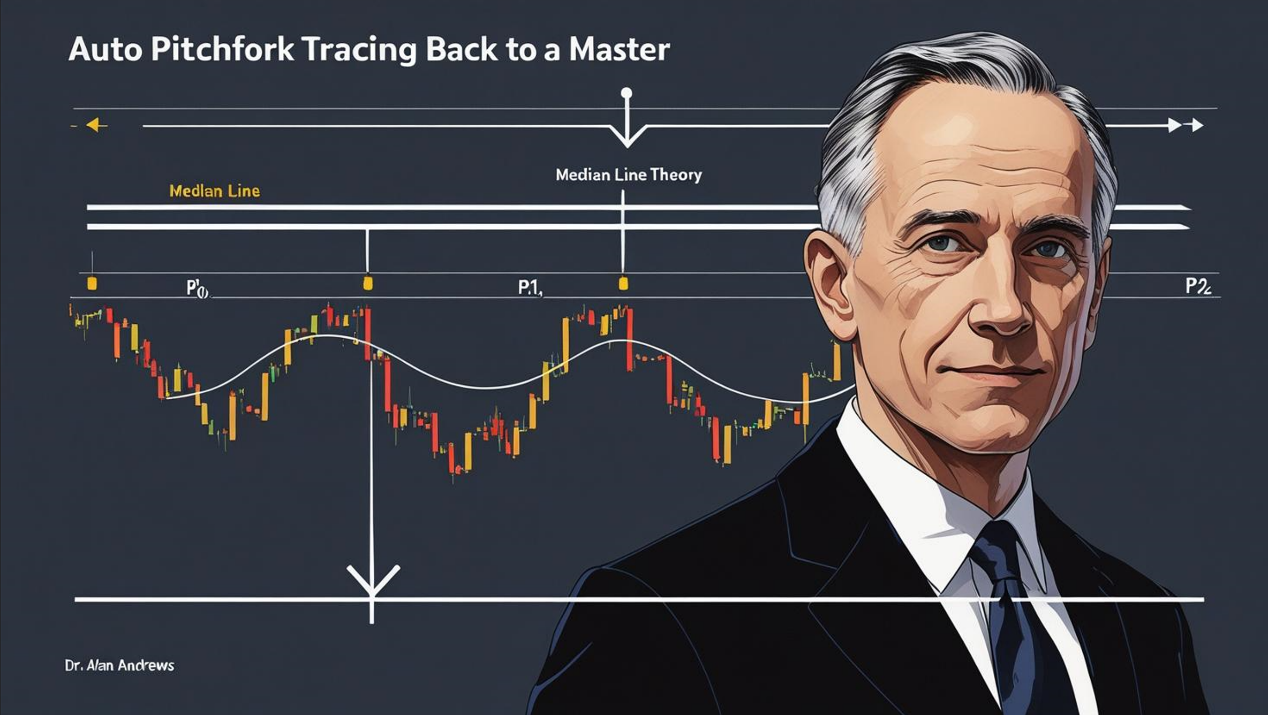
The Grandmaster: Dr. Alan Andrews – While Auto Pitchfork is a modern software feature, its core structure – Andrews’ Pitchfork – was invented by Dr. Alan Andrews. He was a physicist and engineer who later applied his understanding of cycles and vibrations to market analysis.
Core Philosophy: Median Line Theory – Andrews believed price tends to oscillate around a Median Line determined by significant turning points. He proposed that once three consecutive major pivots (P0, P1, P2) of a trend are identified, a median line can be drawn, and price has a high probability (around 80%) of returning to this median line.
The Pitchfork Structure: Andrews used three points to draw the pitchfork:
Point 0 (P0): A significant trend starting point (e.g., a major Swing Low or Swing High).
Point 1 (P1): The first major peak (in an uptrend) or trough (in a downtrend) after P0.
Point 2 (P2): The first major pullback low (uptrend) or bounce high (downtrend) after P1.
A line drawn from P0 through the midpoint between P1 and P2 forms the Median Line (ML).
Two additional lines are drawn parallel to the ML, starting from P1 (Upper Median Line, UML) and P2 (Lower Median Line, LML). These three lines form the standard Andrews’ Pitchfork.
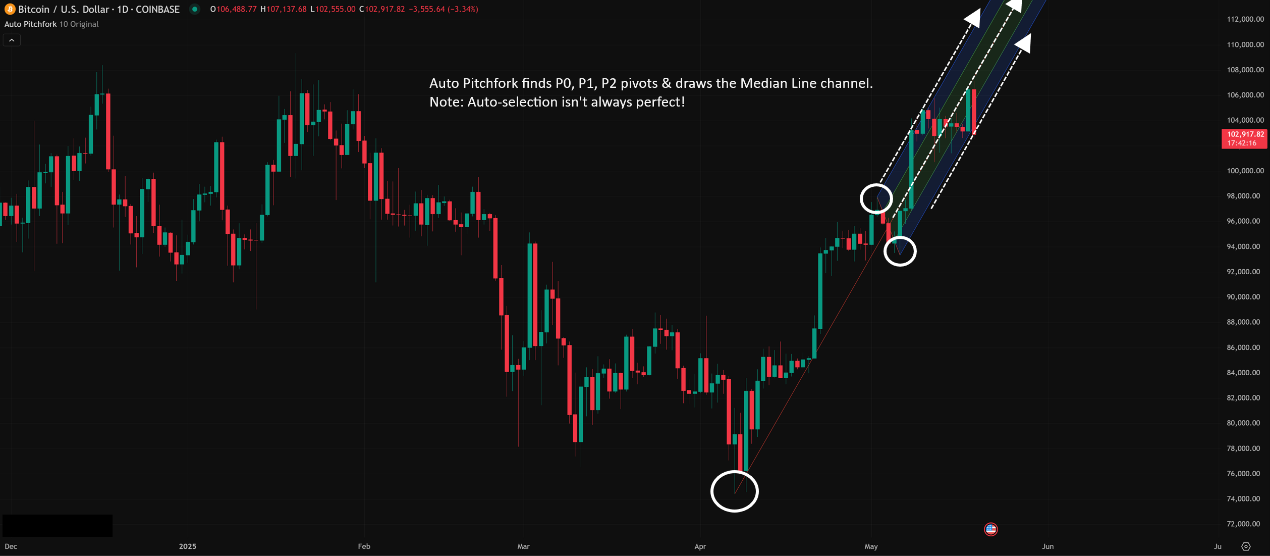
The “Auto” Evolution: Similar to Auto Fibo, Auto Pitchfork is charting software’s attempt to use algorithms (often based on Zig Zag or similar swing point identification logic) to automatically identify these three key anchor points (P0, P1, P2) and draw the entire Pitchfork structure for you, saving the manual point selection step.
Purpose: Automatically Drawing Potential Trend Channels & S/R – Auto Pitchfork aims to provide a quick and convenient way to automatically generate potential trend channels and dynamic support/resistance levels based on Median Line Theory.
So, Auto Pitchfork automates Dr. Alan Andrews’ Median Line Theory and Pitchfork analysis method using computer algorithms for easier application by traders.
The key to Auto Pitchfork is how it automatically selects the P0, P1, and P2 points. This process is similar to how Auto Fibo selects highs/lows but more complex, as it needs to find three points with a specific relationship.
Step One: Identifying Swing Points
The indicator usually employs logic similar to the Zig Zag indicator or other swing high/low identification algorithms.
It uses built-in parameters (like Deviation, Depth, Lookback Period) to filter price fluctuations and find “significant” turning points on the chart.
Step Two: Finding a “Valid” P0-P1-P2 Sequence
This is the trickiest part, and algorithms can vary between platforms.
A common logic might be:
Find a clear starting point P0 (e.g., the lowest low or highest high within a lookback period).
From P0, find the first subsequent opposing turning point P1 that meets the parameter criteria.
From P1, find the first subsequent turning point P2 that moves in the same direction as the P0-P1 move but doesn’t exceed P0, and meets the criteria.
Example (Finding an Upward Pitchfork):
P0: A significant Swing Low.
P1: The first significant Swing High after P0.
P2: The first significant Swing Low after P1 (but this low must be higher than P0).
The algorithm attempts to find the most recent, “reasonable” P0-P1-P2 combo based on its rules within the visible range or specified lookback period.
Step Three: Drawing the Pitchfork Lines
Once P0, P1, and P2 are selected, the drawing method is the same as manual:
Median Line (ML): Drawn from P0 through the midpoint of the line segment connecting P1 and P2.
Upper Median Line (UML): Drawn parallel to the ML, starting from P1.
Lower Median Line (LML): Drawn parallel to the ML, starting from P2.
Often, additional parallel lines (like Warning Lines at 0.5, 1.5, 2.0 distances) or Fibo levels based on the P1-P2 range are also automatically drawn.
Core Points & Potential Issues:
Subjectivity/Limitations of Auto-Selection: Will the algorithm’s chosen P0, P1, P2 always be the most significant or relevant points in your view? Not necessarily! It might pick suboptimal points or miss the structure you see.
Repainting Issue: If the underlying swing point identification method (like Zig Zag) repaints, the entire Pitchfork might redraw or adjust its angle when new price action changes the confirmation status of P2 (or even P1)! Like Zig Zag, this means you cannot fully trust the most recently drawn form for immediate signals.
Think of Auto-Routing with GPS:
You tell the GPS your start (P0), first must-visit spot (P1), and second must-visit spot (P2).
The GPS (Auto Pitchfork Algo) automatically plots a route (draws the lines).
But sometimes, due to updated traffic (new candles) or its own algorithm limits, the GPS might pick a route you don’t think is the best (draws a Pitchfork you disagree with).
「Auto Pitchfork Point Selection & Drawing Concept」
How to use this auto-fork? The applications are similar to a manually drawn Pitchfork, but require an extra layer of verification.
Level 1: Basic Usage – Channel S/R & Trend Following
Median Line (ML) as “Gravity Line” & S/R:
According to Andrews’ theory, price tends to revert to the Median Line.
When the ML slopes up, pullbacks to the ML may find support.
When the ML slopes down, rallies to the ML may face resistance.
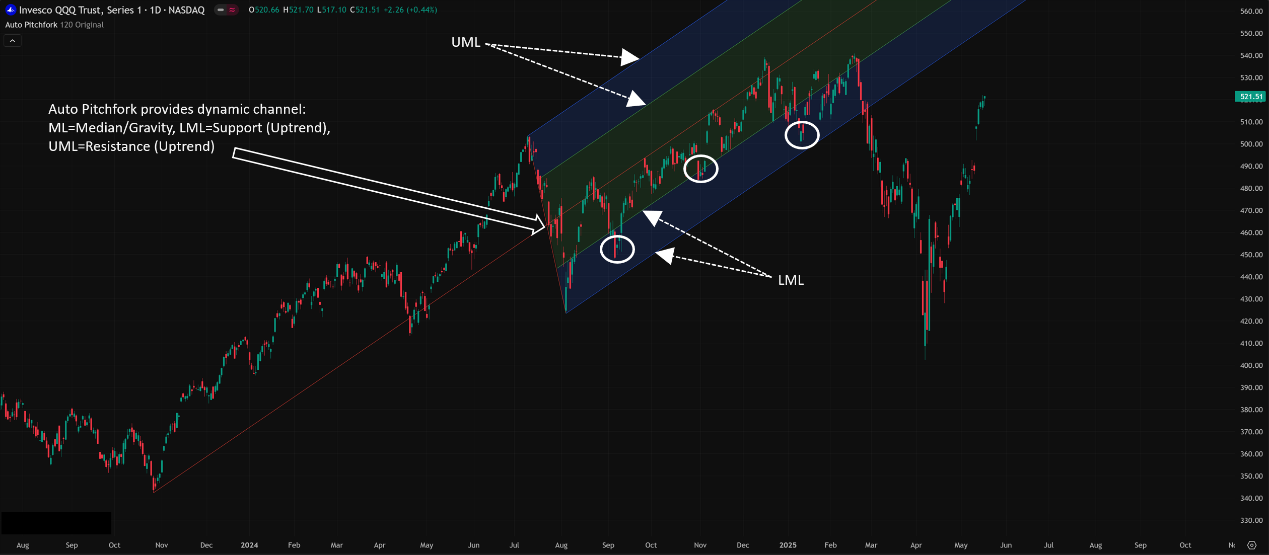
Upper/Lower Lines (UML/LML) as Channel Boundaries & S/R:
Uptrend (Upward Sloping Pitchfork):
LML often acts as the primary support line. Pullbacks to the LML are potential buying opportunities.
UML often acts as the primary resistance line or overbought line. Price reaching the UML might be a signal to take profits or expect a pullback towards the ML.
Downtrend (Downward Sloping Pitchfork):
UML often acts as the primary resistance line. Rallies to the UML are potential shorting opportunities.
LML often acts as the primary support line or oversold line. Price reaching the LML might be a signal to take profits or expect a bounce towards the ML.
Basic Trend Following: As long as price remains above the LML in an upward pitchfork, or below the UML in a downward pitchfork, the trend can be considered intact according to the channel.
「Using Auto Pitchfork (ML, UML, LML) for Channel S/R」
Level 2: Advanced Plays – Verification, Parameters, Types & Strategies
To use it like a pro, you need to know how to “manage” this automated tool.
A. Verify the Anchor Points! Verify! Verify!
Say it three times! Because algorithms are rigid, the P0, P1, P2 they select might not be the most logical ones.
Your Job: Every time the Auto Pitchfork draws or updates, use your experienced trader’s eye to critique the three points it chose:
Do these points truly capture the start, peak/trough, and first major pullback/rally of the trend leg you consider most important right now?
Were more obvious or significant swing points ignored?
Does the angle and slope of this Pitchfork look right relative to the recent price action?
If You Disagree? Don’t rely on it! You can either:
Adjust the parameters (see below) to try and guide it to better points.
Just draw it manually using the points you believe are more accurate.
B. Parameter Tuning Deep Dive:
Auto Pitchfork parameters primarily control how the P0, P1, P2 points are identified.
Core Parameters (Usually Zig Zag based):
Deviation (%) / Depth (Points): Controls the magnitude of the reversal needed to define a pivot.
Larger Value: Catches bigger, more major swing points (P0, P1, P2 will be further apart). Draws wider, flatter Pitchforks suitable for long-term trend analysis.
Smaller Value: More sensitive to smaller fluctuations, catches shorter-term pivots. Draws narrower, steeper Pitchforks suitable for short-term trend or corrective wave analysis.
Lookback Period: How far back the indicator searches for P0, P1, P2.
Larger Value: Might find older, more macro anchor points, drawing a long-term Pitchfork.
Smaller Value: Focuses on recent anchor points, drawing a short-term Pitchfork.
How Global Traders Play It?
No Standard Answer! Like Zig Zag, the best parameters depend on the asset, timeframe, and analysis goal.
Common Approach: Start with the platform’s default settings. Then, visually adjust Deviation/Depth and Lookback based on the trend level you want to capture (long/medium/short) until the drawn Pitchfork looks like it best fits the main structure you see.
Experience Tip: Usually avoid extremely sensitive (too small) Deviation settings, as this will cause the Pitchfork to redraw constantly and lose stability.
C. Understanding Different Pitchfork Types:
Many Auto Pitchfork indicators let you choose different calculation types:
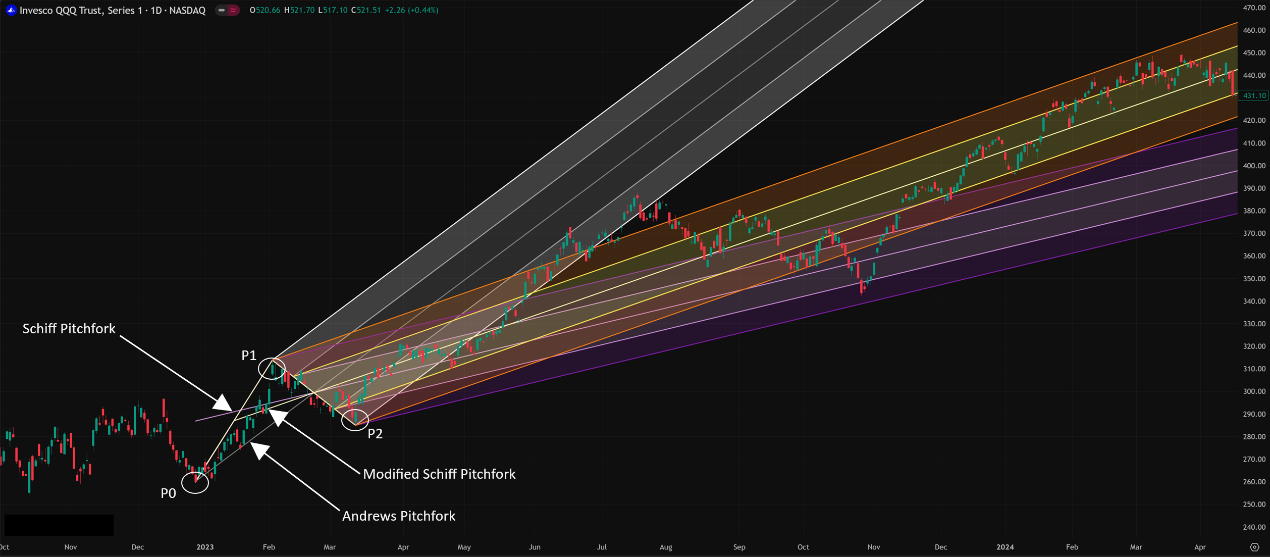
Andrews’ Pitchfork (Standard): The original and most common. ML = P0 to midpoint of (P1-P2).
Schiff Pitchfork: Shifts the origin (P0) horizontally to the midpoint of the P0-P1 vertical distance before drawing. Theoretically better fits some faster trends.
Modified Schiff Pitchfork: Shifts the origin (P0) to the midpoint of the P0-P1 line both horizontally and vertically. A variation on Schiff.
Platforms usually default to Andrews’. You can experiment with switching types to see which one visually fits the current price action better, but beginners should master standard Andrews’ first.
「Three Pitchfork Types Compared」
D. Timeframe Application:
Auto Pitchfork can be applied to all timeframes.
Pitchforks drawn on higher timeframes (D1, W1) represent more significant trend structures, and their ML, UML, LML tend to act as more reliable S/R.
Pitchforks drawn on lower timeframes (H1, M15) change more rapidly and are better suited for capturing short-term swings and intraday opportunities, but be more wary of potential repainting.
MTF Analysis: Using a D1 Pitchfork for overall direction and an H1 Pitchfork for pullback entries is a common strategy.
E. Combining with Other Tools (Confluence is Key!):
Auto Pitchfork + Fibo: When price pulls back to the LML (uptrend) or rallies to the UML (downtrend), if this level coincides with a key Fibo retracement (e.g., 50%, 61.8%), the reversal probability increases significantly.
Auto Pitchfork + Pivot Points: See if Pitchfork lines overlap with Daily/Weekly Pivot levels.
Auto Pitchfork + MA: Check if the Median Line (ML) is moving in sync with a key MA (e.g., 50 EMA), confirming the trend.
Auto Pitchfork + Candlestick Patterns: A reversal candlestick pattern forming right at a Pitchfork line is one of the strongest entry signals.
F. Breakout Strategy:
A strong close beyond the UML (in an uptrend) or LML (in a downtrend) can signal trend acceleration or the failure of the existing channel structure.
After a breakout, look for a retest of the broken UML/LML as potential new support/resistance before entering.
G. Which Combos Are “Hot” & Effective? (Effective Auto Pitchfork Usage)
No Absolute “Hottest” Parameter Combo. Effectiveness heavily depends on whether the algorithm picks sensible P0, P1, P2 points.
The “Hottest” is the “Workflow”:
Load Auto Pitchfork (use default or your tested parameters).
Visually Verify! Do the P0, P1, P2 points look right? Does the fork fit the current action?
If Not -> Adjust Parameters (Try Deviation/Depth first, then Lookback) OR -> Draw Manually!
If It Fits -> Find Confluence! Do ML, UML, LML align with other S/R?
Wait for Price at Key Line + Candle Confirmation! Look for clear price action signals at confluence zones before acting.
H. Best Parameter Combos? (Optimal Settings Verdict)
Type: Start with Andrews’ (Standard).
Core Parameters (Deviation/Depth/Lookback):
No Standard Answer! Requires extensive visual backtesting and experimentation to find settings that consistently capture the swings you deem significant on your preferred assets and timeframes.
Suggested Starting Points:
Deviation (%): Try 5% or 10%.
Lookback: Try 30, 50, or 100.
Depth (ZigZag): Try the default (often 5-10).
Goal: Not the most signals, but the Pitchfork that looks most stable and best fits the primary structure.
Timeframe: Start observing on H1 or H4 for a balance, then reference D1 for the bigger picture.
Conclusion: The key to Auto Pitchfork isn’t finding magic parameters, but learning to verify its output and integrate the dynamic channels it draws with other analysis tools.
Auto Pitchfork is a convenient tool that attempts to automate the powerful Andrews Pitchfork analysis method, quickly drawing potential trend channels and dynamic S/R on your chart.
Its main advantages are speed and initial objectivity, helping you:
Quickly identify potential trend channels.
Provide immediate dynamic support and resistance levels (ML, UML, LML).
Assist in gauging trend direction and strength (via channel slope and price position).
But you MUST be aware of its limitations:
Auto-selection isn’t always perfect; requires human verification!
Potential for Repainting (if the underlying algo repaints).
Parameter settings heavily influence results and need personalized testing.
For young traders wanting to utilize channel analysis without manual drawing every time, Auto Pitchfork is a tool worth exploring. But remember, it’s an “assistant” that needs your active supervision and verification, not a “holy grail” to be followed blindly.
Remember:
It’s based on Andrews Pitchfork / Median Line Theory.
Verify P0, P1, P2 selection is Step 1!
ML, UML, LML are the core S/R lines.
Parameters have no universal best, testing is required.
Confluence significantly boosts reliability.
Understand the Repainting risk.
Manual drawing is always a reliable backup!
Alright! Hope this deep dive into Auto Pitchfork helps you master this automated helper! Try it out on your platform, but always trade with your brain engaged! See ya next time! Fork it till you make it (responsibly)!