Physical Address
304 North Cardinal St.
Dorchester Center, MA 02124
Physical Address
304 North Cardinal St.
Dorchester Center, MA 02124
Alright, all you momentum hunters chasing the market’s “acceleration,” Crypto’s rapid response units, and folks looking for a straightforward way to see momentum shifts! Today, we’re unlocking another signature weapon from the master Bill Williams, a close sibling to the Alligator indicator – the Awesome Oscillator (AO)! The name’s pretty awesome, but how awesome is it really? Its gameplay is kinda like MACD, but purer, focusing squarely on capturing the acceleration and deceleration of market momentum!
What the heck is AO? How’s it related to but different from MACD?
AO is a momentum indicator designed by the Chaos Trading guru Bill Williams. Its core purpose is to measure the difference between the market’s most recent momentum (5 periods) and its momentum over a longer period (34 periods). This difference reveals whether market momentum is currently accelerating or decelerating.
It looks similar to MACD (both measure the difference between fast and slow lines), but with key differences:
Uses SMA, Not EMA: AO uses Simple Moving Averages (SMA), whereas MACD uses Exponential Moving Averages (EMA).
Calculated on Midpoints, Not Closes: AO uses the Midpoint Price of each bar (High + Low) / 2, not the closing price. Bill Williams believed the midpoint better reflects the “true” price center for the period.
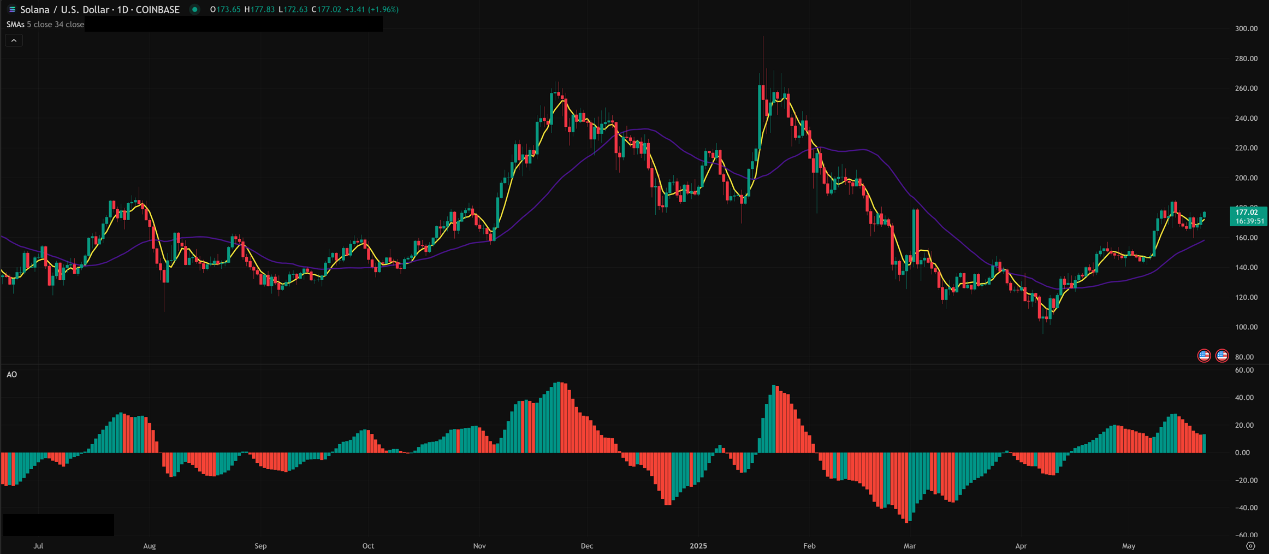
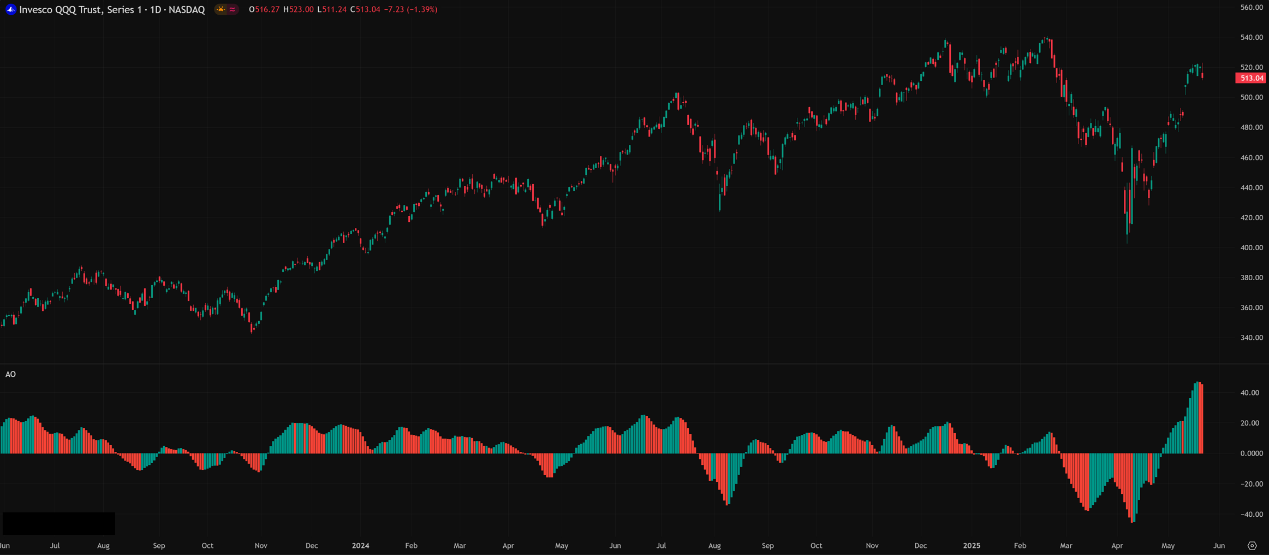
Visual Representation: AO is typically displayed as a colored Histogram oscillating around a Zero Line.
Bars above zero → Short-term momentum > Long-term momentum, bullish momentum dominates.
Bars below zero → Short-term momentum < Long-term momentum, bearish momentum dominates.
Color Changes (Common):
If current bar is higher than previous bar (momentum increasing), usually shown in green.
If current bar is lower than previous bar (momentum decreasing), usually shown in red.
「Awesome Oscillator (AO) Structure: Momentum Bars of Midpoint SMA(5) vs SMA(34)」
AO is a core component of Bill Williams’ Chaos Trading System, used alongside indicators like the Alligator and Fractals. He designed AO not necessarily to replace MACD, but to provide what he believed was a truer reflection of short-term market momentum changes.
Design Philosophy:
Momentum Leads Price: Williams believed changes in momentum precede changes in price.
Acceleration is Key: He wasn’t just interested in momentum direction (+/-) but whether momentum itself was speeding up (histogram bars getting taller / favorable color) or slowing down (bars getting shorter / unfavorable color). The AO histogram’s height and color visualize this “acceleration.”
Midpoint Price is Truer: Using (H+L)/2 represents the price center, avoiding potential distortions from single closing prices.
5/34 Periods: These specific numbers relate to Bill Williams’ theories on market cycles and possibly the application of Fibonacci numbers. 5 represents very short-term impulse; 34 represents a more significant intermediate momentum cycle. The difference highlights the short-term change against the longer-term backdrop.
Core Calculation (Concept):
AO = SMA(Midpoint Price, 5) – SMA(Midpoint Price, 34)
Midpoint Price = (High + Low) / 2
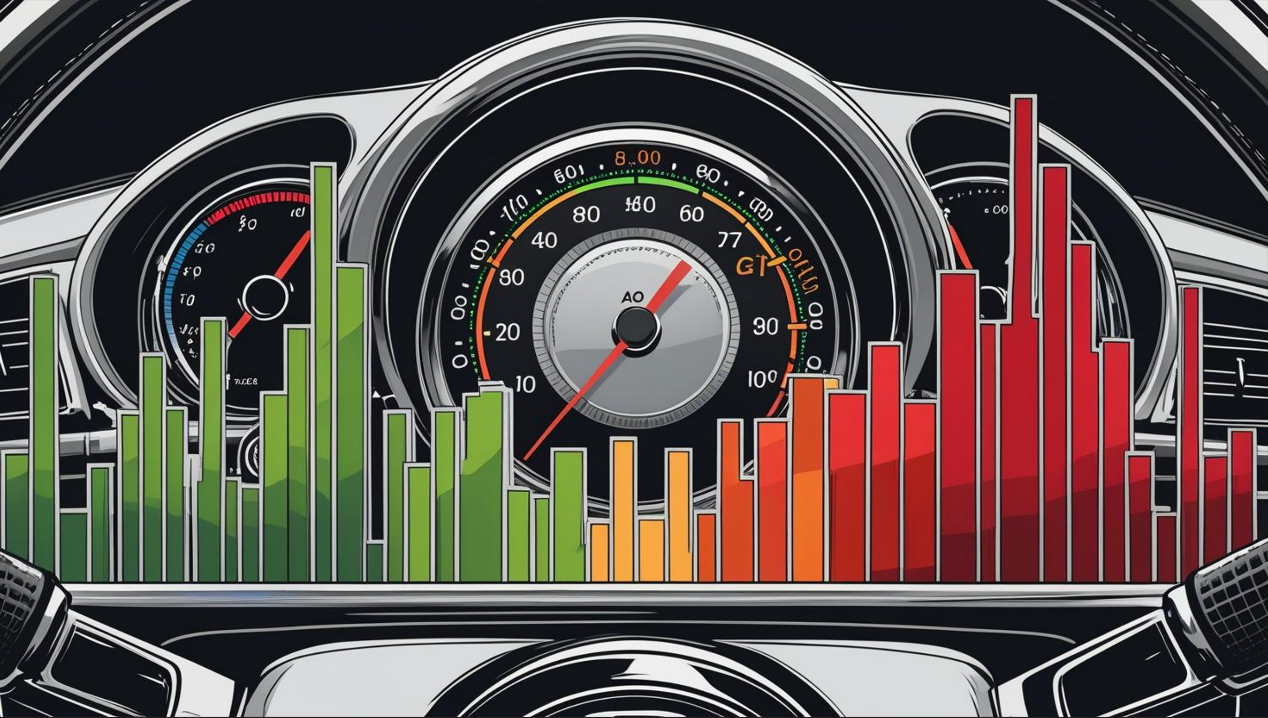
Simply Put: AO is like installing an “accelerometer” for market momentum! It doesn’t just tell you if the car (market) is moving forward or backward; the bars’ height and color tell you how hard you’re hitting the “gas” (accelerating) or the “brakes” (decelerating)!
「AO Logic: The Market Momentum ‘Accelerometer’」
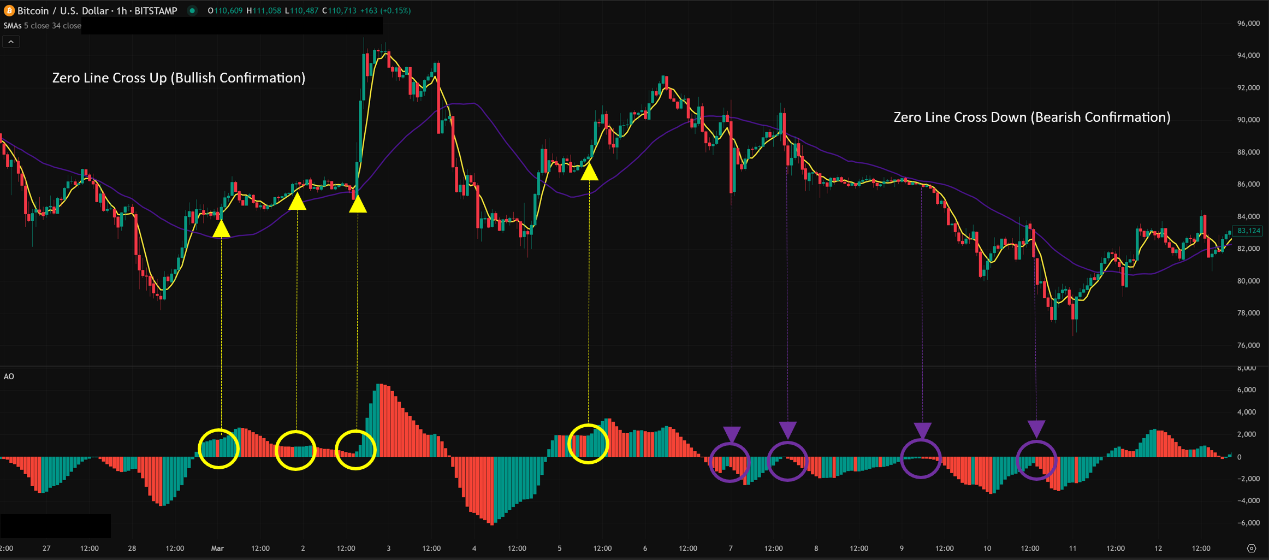
Zero Line Cross (Lagging but Significant):
AO Histogram flips from negative to positive (crosses above zero) → Short-term momentum overtakes long-term momentum, confirming a bullish signal.
AO Histogram flips from positive to negative (crosses below zero) → Long-term momentum overtakes short-term momentum, confirming a bearish signal.
Usage: While lagging, the zero line cross is considered a relatively important trend shift confirmation. Many strategies wait for this cross before entering.
「AO Zero Line Cross: Key Momentum Shift Point」
Histogram Bar Color Change (Instant Momentum Increase/Decrease):
Green bar → Momentum increasing (vs. previous bar).
Red bar → Momentum decreasing (vs. previous bar).
Usage: Shows micro-changes in momentum, but too weak for standalone trading signals.
The real juice of AO isn’t just the zero cross; it’s the specific patterns (Setups) defined by Bill Williams!
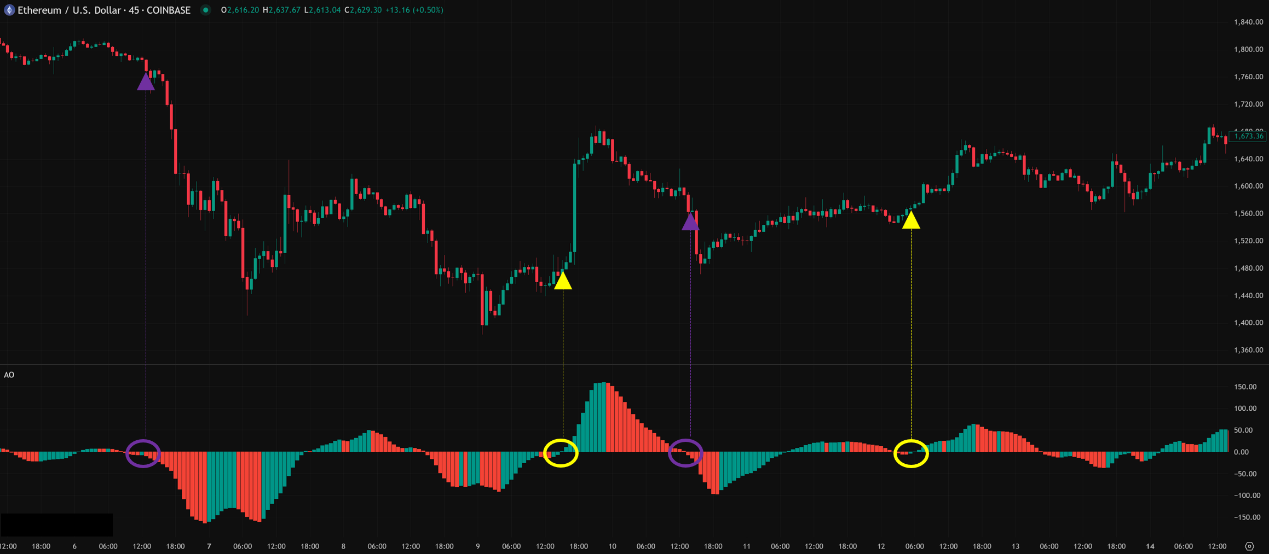
Saucer Setup (Trend Continuation / Add-on Point!):
This setup looks for opportunities to enter during an established trend when momentum briefly pulls back and then re-accelerates.
Bullish Saucer (Buy / Add to Long):
AO Histogram is above the zero line (confirming uptrend momentum).
There are at least two consecutive red bars (momentum briefly weakens/pulls back), BUT the bars remain above the zero line.
The first green bar appears immediately after the red bars (momentum starts increasing again).
This first green bar is the “Bullish Saucer” signal bar.
Bearish Saucer (Sell / Add to Short):
AO Histogram is below the zero line (confirming downtrend momentum).
There are at least two consecutive green bars (momentum briefly strengthens/rallies), BUT the bars remain below the zero line.
The first red bar appears immediately after the green bars (momentum starts weakening again).
This first red bar is the “Bearish Saucer” signal bar.
Key Idea: Saucers are trend-following signals, catching re-entry points after minor pullbacks in momentum.
「AO Saucer: Add-on Signal During Trend Continuation」
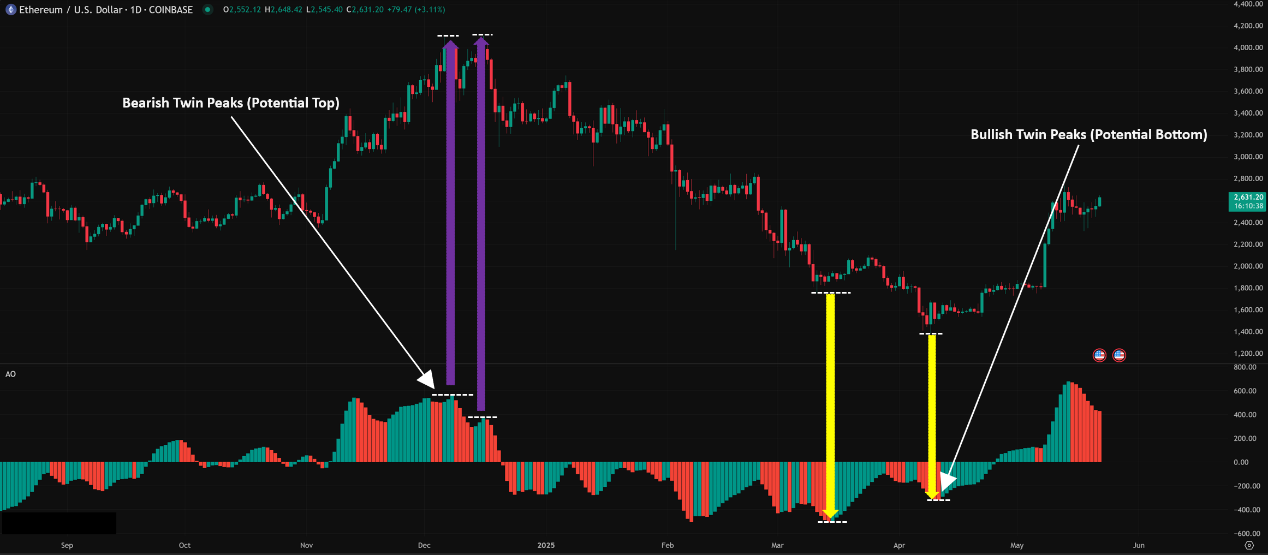
Twin Peaks (Reversal Warning Similar to Divergence!):
Used to spot potential trend reversals, similar to divergence but with specific criteria.
Bearish Twin Peaks (Potential Top):
AO forms a peak above the zero line (Peak 1).
AO pulls back (might dip below zero briefly).
AO rises again to form a second peak (Peak 2), BUT this peak is lower than the first (Peak 2 < Peak 1), AND the trough between the two peaks MUST remain above the zero line.
The first red bar after Peak 2 forms is the potential sell signal.
Bullish Twin Peaks (Potential Bottom):
AO forms a trough below the zero line (Trough 1).
AO rallies back (might cross above zero briefly).
AO falls again to form a second trough (Trough 2), BUT this trough is higher than the first (Trough 2 > Trough 1), AND the peak between the two troughs MUST remain below the zero line.
The first green bar after Trough 2 forms is the potential buy signal.
Key Idea: Twin Peaks signal a reversal based on momentum failing to make a new high/low.
「AO Twin Peaks: Momentum Exhaustion Reversal Signal」
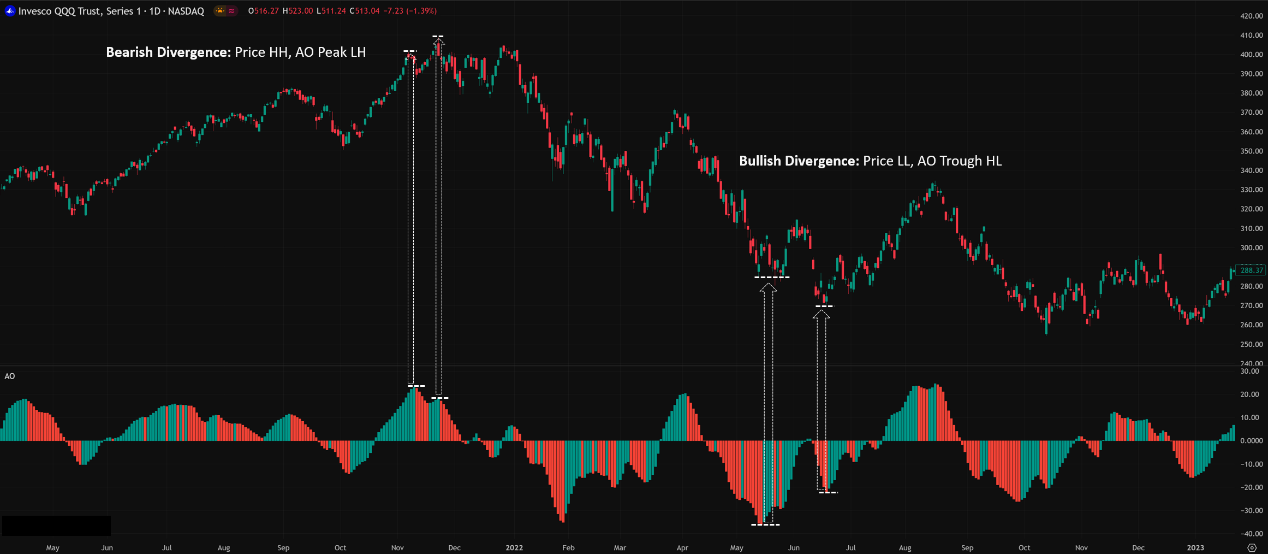
Divergence (Works on AO Too!):
While Williams emphasized Saucers and Twin Peaks, standard divergence between price and AO histogram height is still a valid advanced technique.
Bullish Divergence: Price LL, AO Trough HL.
Bearish Divergence: Price HH, AO Peak LH.
AO divergence, using SMAs and midpoints, might arguably be smoother or less noisy than MACD divergence.
「AO Regular Divergence: Momentum vs. Price Deviation」
Core Parameters: (Fast Period, Slow Period)
Default Parameters: (5, 34)! Fast SMA = 5, Slow SMA = 34. This is Bill Williams’ standard setting.
Why 5 and 34?
Again, Fibonacci Numbers! 5, 8, 13, 21, 34… Williams believed these numbers reflected natural market cycles.
5 represents very short-term impulse momentum.
34 represents a significant intermediate momentum cycle. The difference highlights the short-term change against this backdrop.
Parameter Settings Analysis & “Hottest” Combo Discussion:
Like the Alligator, AO’s parameters (5, 34) are generally considered SACRED by followers of Bill Williams!
Why Not Change?
System Integration: AO is part of Williams’ Chaos system; (5, 34) is fundamental to its interplay with other indicators (Alligator, Fractals).
Design Philosophy: Changing parameters defeats the purpose of comparing the specific 5-period impulse vs. the 34-period cycle momentum.
No Obvious Benefit: No widespread evidence suggests other parameter combos consistently provide better Saucer or Twin Peaks signals. Many platforms don’t even allow changing AO parameters!
Conclusion: The “hottest,” most effective parameter combo IS the default (5, 34)! 100% of your energy should be focused on learning to identify Saucers, Twin Peaks, and Divergences on the chart!
「AO Parameters (5, 34): Respect the System Settings」

Timeframe Analysis:
All Timeframes Applicable! AO’s concept works across timeframes.
But Signal Frequency & Reliability Differ:
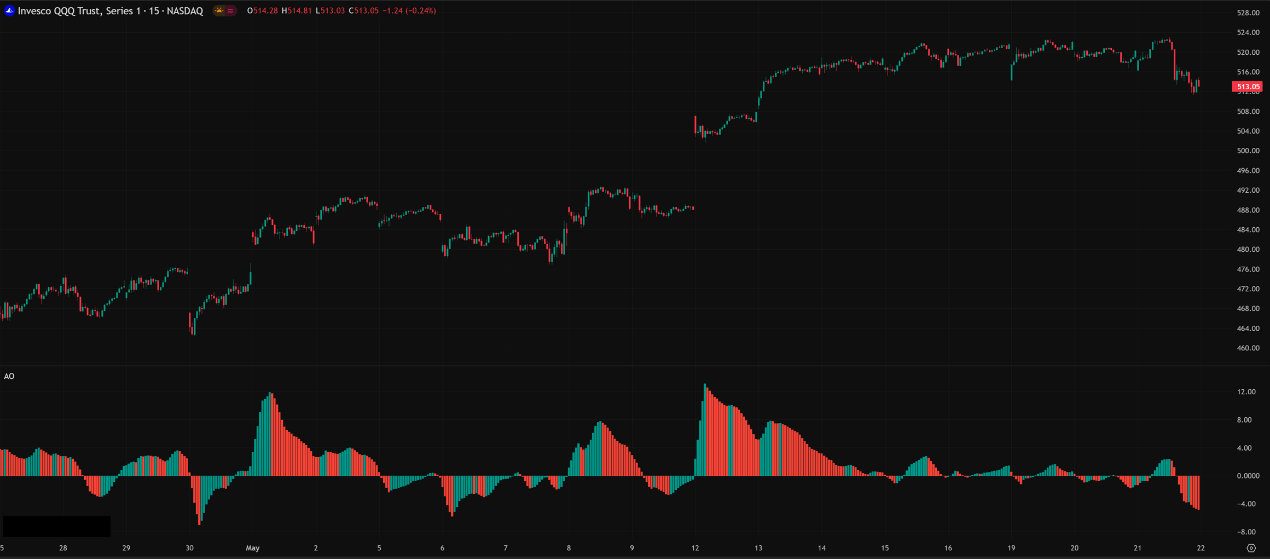
Ultra Short-Term (M1, M5, M15):
AO will be very active, frequent zero crosses, Saucers and Twin Peaks might form quickly but have many false signals! Requires extreme skill and combination with other confirmations.
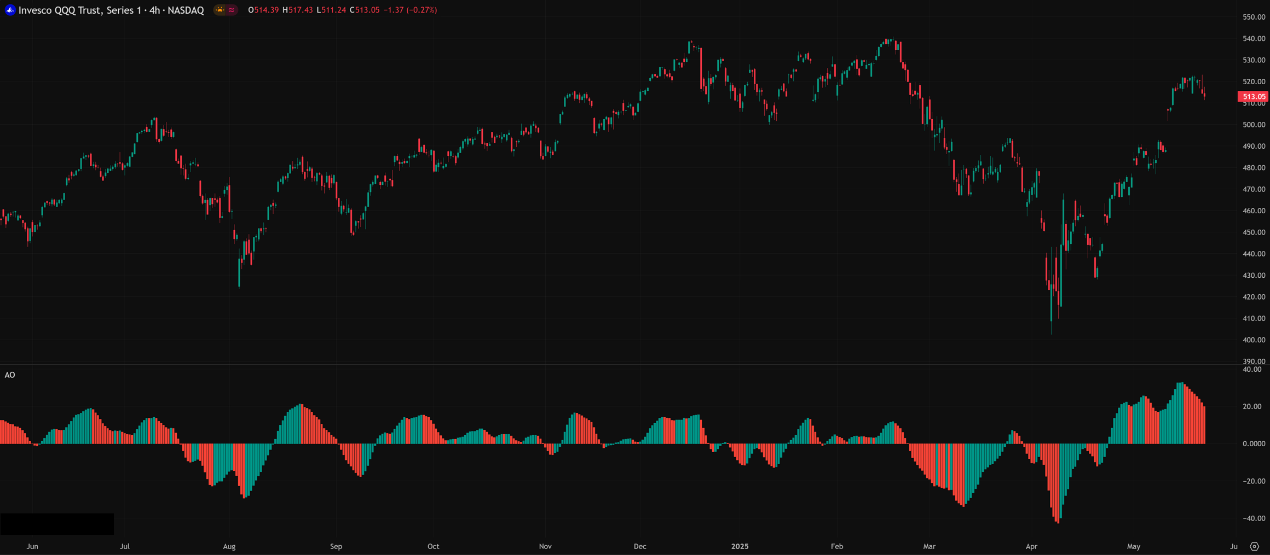
Intraday / Short Swing (H1, H4):
Common usage zone! Patterns start becoming clearer. Look for Saucers (trend continuation) and Twin Peaks/Divergence (potential reversals) on these timeframes. H4 signals are generally more reliable than H1.
Swing / Long-Term (Daily, Weekly):
Where AO patterns are most reliable and significant! Saucers, Twin Peaks, and Divergences appearing on Daily/Weekly charts often foreshadow larger market moves.
E.g., A Bullish Twin Peaks on the Weekly chart could be a very significant long-term bottom signal.
「AO Timeframes: Longer = More Reliable Patterns」
Parameters: Default (5, 34)! No question!
Timeframe: Daily / Weekly / H4 are the best application zones for reliable patterns. H1 is usable support. M15 or lower needs extreme filtering skill.
Hottest / Most Effective Usage = Master Bill Williams’ Three Signals + Combine with Price Structure:
Saucer: Trend continuation weapon! Enter when momentum briefly pauses then re-accelerates on the same side of zero.
Twin Peaks: Reversal alarm! Spot momentum failing to make a new high/low after a pullback.
Divergence: Universal momentum warning! Price disagreeing with AO momentum is key.
Zero Line Cross is Lagging Confirmation Only.
ALWAYS Combine with Alligator (for trend/sleep state), Fractals (for breakout points), Price Action (candles, S/R)! AO is NOT meant to be used alone!
AO: Your Momentum “Accelerometer,” Seeing Changes in Speed
The Awesome Oscillator offers a unique perspective focused on the acceleration and deceleration of market momentum. Its pros:
Relatively Simple Concept (SMA difference).
Clear Visualization (colored histogram).
Specific Trading Setups (Saucer, Twin Peaks, Divergence).
Standardized Parameters (5, 34), no tuning needed.
Cons:
Zero line cross lags.
Pattern recognition requires practice and some subjectivity.
Best used within the full Bill Williams system; standalone effectiveness is reduced.
「Awesome Oscillator: The Market Momentum Accelerometer」
AO is a fascinating and self-contained indicator. If you want to learn Bill Williams’ Chaos Trading methods or seek a momentum tool different from MACD/RSI, AO is definitely worth in-depth study.
Next Steps:
Add Awesome Oscillator (use default 5, 34) to your H4, Daily, Weekly charts.
Practice intensely identifying Saucer and Twin Peaks patterns! Look at lots of historical charts!
Also practice spotting regular divergences between price and AO.
Observe when zero line crosses typically occur within a trend.
Start researching the Alligator and Fractals indicators to learn how they integrate with AO.
Demo trade strategies based on AO patterns.
May you harness the Awesome Power and catch those acceleration points in the market! ❤️