Physical Address
304 North Cardinal St.
Dorchester Center, MA 02124
Physical Address
304 North Cardinal St.
Dorchester Center, MA 02124
Yo What’s Poppin’, Market Rebels and Future Finance Gurus! Ready to add another sick tool to your Technical Analysis toolkit? We’ve covered price, volume, money flow… but what about measuring how efficiently the market is moving the price? How much oomph or effort is behind each candle? Today, we’re decoding a unique indicator designed by a legend to do just that – introducing the Market Facilitation Index (MFI), often known specifically as the Bill Williams MFI (BW MFI)!
Hold Up! Quick Clarification: This is NOT the same as the Money Flow Index (also confusingly abbreviated as MFI) we discussed earlier! This MFI comes from the mind of Bill Williams and focuses purely on the relationship between a bar’s price range and its volume. We’ll call it BW MFI here to keep things crystal clear!
So, what’s the deal with BW MFI? It’s like looking at the market’s “engine output” versus its “fuel consumption.” Is the market making big moves effortlessly, or is it struggling and churning lots of volume just to stand still? BW MFI visualizes this price/volume dynamic in a super intuitive way using color-coded bars!
Wanna know how these colored bars tell you if the trend is solid, faking you out, fading, or about to explode after a fight? Wanna see how it fits into a broader trading system? Alright, buckle up buttercup, let’s dive deep into the mechanics and strategies of the Bill Williams Market Facilitation Index! Let’s facilitate some knowledge!
This indicator comes straight from the playbook of a true market maverick.
The Creator:Bill Williams-Yes, the same visionary behind the Alligator, Fractals, Awesome Oscillator (AO), and Accelerator Oscillator (AC)! BW MFI is a core component of his “Trading Chaos” methodology.
Core Philosophy: Market = Energy! Williams viewed the market as a system driven by energy. Price movement (specifically the range of a bar, High – Low) represents the result or the distance covered. Volume represents the effort or energy put into achieving that result.
The Goal: Visualize Price/Volume Interaction – BW MFI was designed to graphically represent the relationship between the price range and the volume for each bar. Its purpose isn’t to give standalone buy/sell signals, but to assess the market’s willingness and efficiency in moving the price during that specific bar or period. Is the market facilitating movement easily, or is it resisting?
Part of a System: Crucially, Bill Williams designed his indicators to work together as a cohesive system. BW MFI provides insights that complement the signals from the Alligator, Fractals, AO, and AC.
So, BW MFI wasn’t born in isolation. It’s a specific tool within the Bill Williams trading philosophy, designed to add a layer of efficiency analysis by directly comparing the price range achieved to the volume effort expended.
The calculation itself is surprisingly straightforward:
The Formula:
BW MFI = (High – Low) / Volume
Where:
High = The highest price of the bar/period.
Low = The lowest price of the bar/period.
Volume = The volume traded during that bar/period.
The Logic: Measuring “Bang for the Buck”
High BW MFI Value: Means the price range (High – Low) was large relative to the volume traded. This indicates the market moved price efficiently – big move on relatively low effort. Price movement was facilitated.
Low BW MFI Value: Means the price range was small relative to the volume traded. This indicates the market moved price inefficiently – lots of effort (volume) resulted in little price change. Price movement was difficult or resisted.
The Output: Usually a Histogram
The calculated BW MFI value for each bar is typically plotted as a vertical bar (histogram) below the price chart.
The absolute height of the BW MFI bar itself is often less important than its change compared to the previous bar AND how the volume changed. This interaction is key!
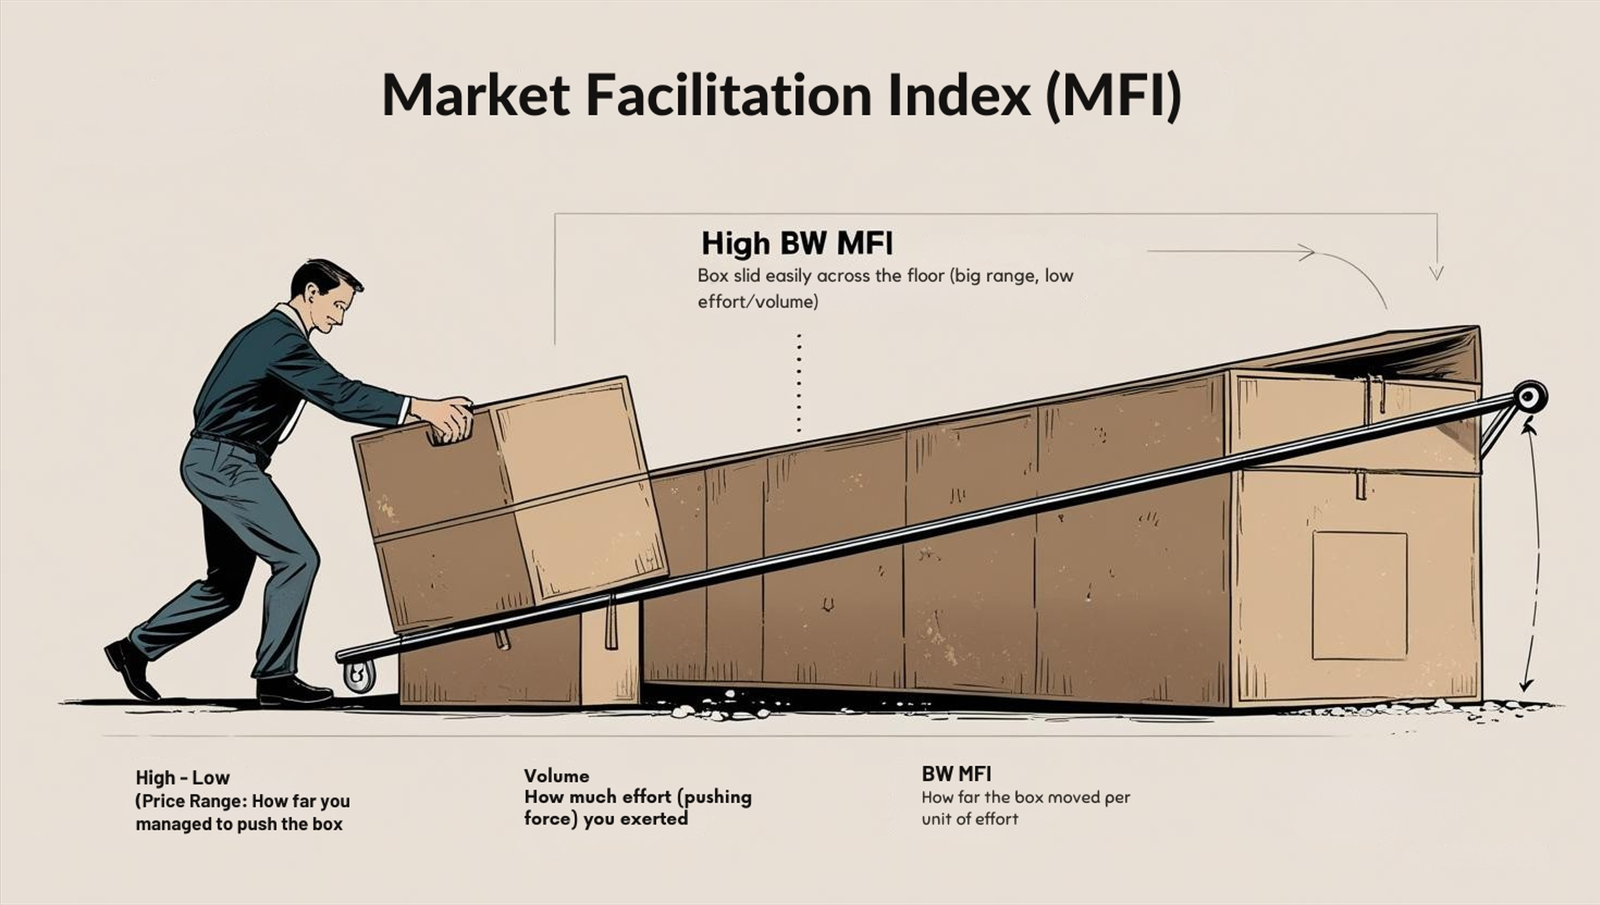
Think of Pushing a Heavy Box:
(High – Low) Price Range: How far you managed to push the box.
Volume: How much effort (pushing force) you exerted.
BW MFI: How far the box moved per unit of effort.
High BW MFI: Box slid easily across the floor (big range, low effort/volume).
Low BW MFI: Box barely budged even though you pushed really hard (small range, high effort/volume).
「BW MFI Concept – Range vs. Volume」
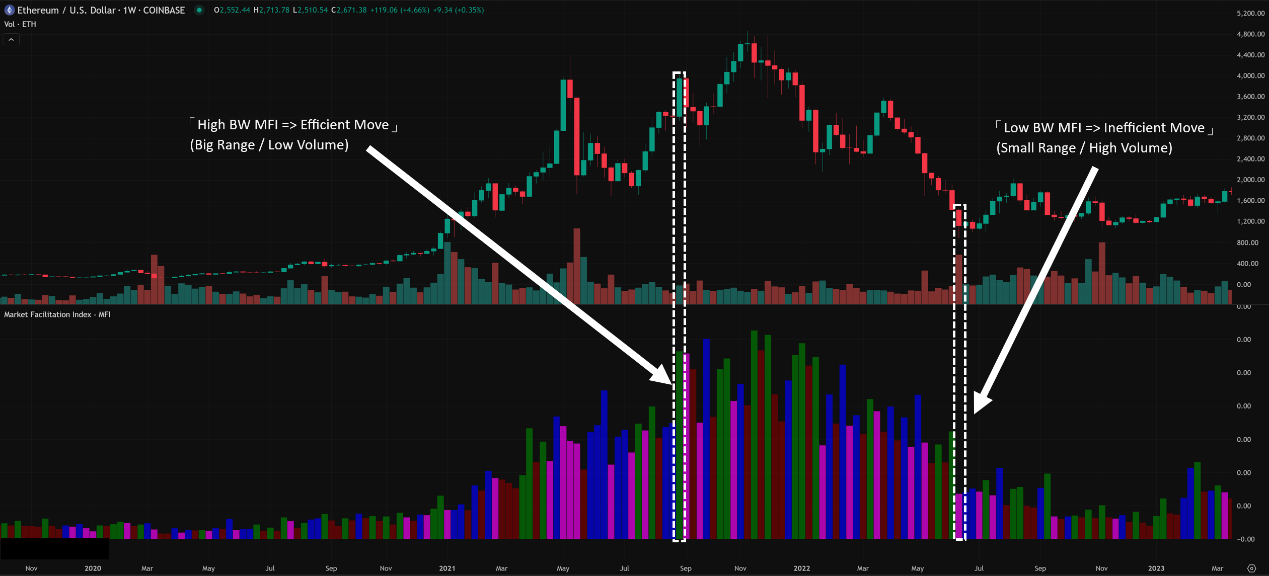
This is where BW MFI gets really interesting and practical. Its primary use isn’t looking at the line/histogram itself, but interpreting the combination of changes in BOTH the BW MFI bar and the Volume bar compared to the previous period. This creates four distinct scenarios, often represented by colors on charting platforms (though the colors can vary, the logic is the same).
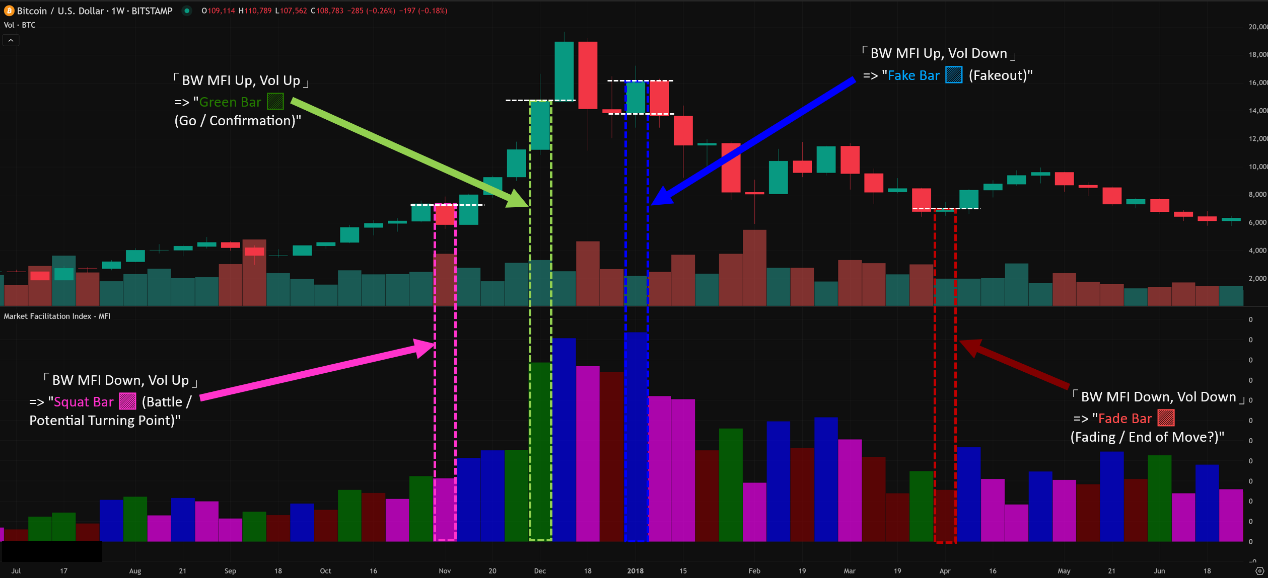
The Four BW MFI Zones / Bar Types:
Green Bar: BW MFI UP + Volume UP
Interpretation: This is the “Green Light” / “Go” signal. Both the price range expanded and the volume increased. It means more participants entered the market, and they actively moved the price in the direction of the bar (usually aligns with price direction).
Meaning: Strong confirmation of the price move. The trend is likely accelerating and supported by volume. Good place to be in a trade or potentially add to a position in the direction of the bar.
/ Fade Bar (Brown/Blue): BW MFI DOWN + Volume DOWN
Interpretation: The “Fading” / “Boring” signal. Both the price range contracted and the volume decreased. The market is losing interest and momentum. Price movement is becoming less efficient, and fewer people care.
Meaning: Often signals the potential end of the current move or trend. Traders might be taking profits or closing positions. Time to be cautious, tighten stops, or potentially look for exits.
/ ⚫️ Fake Bar (Blue/Black): BW MFI UP + Volume DOWN
Interpretation: The “Fakeout” / “Suspicious” signal. The price range expanded, BUT the volume decreased. Price moved significantly, but without strong participation or conviction.
Meaning: This move might be driven by market makers testing stops or a lack of genuine interest from larger players. The move might not be sustainable and could reverse. Be highly skeptical of moves occurring on Fake bars, especially breakouts.
/ Squat Bar (Red/Pink): BW MFI DOWN + Volume UP
Interpretation: The “Battle” / “Struggle” signal. Volume increased significantly, BUT the price range contracted (or didn’t expand proportionally). Lots of effort (volume) was expended, but price struggled to move far.
Meaning: Represents a significant fight between buyers and sellers at that price level. Often occurs at potential turning points, support/resistance levels, or before a major breakout after a consolidation. A Squat bar signals high tension; watch closely for how the battle resolves on the next bar(s). A break in either direction after a Squat can be powerful.
Key Principle: You interpret the current bar based on how its BW MFI value and Volume compare to the previous bar’s values.
「The Four BW MFI Bar Types Explained」
BW MFI Calculation: NO Parameters! The core formula (High – Low) / Volume doesn’t have any user-defined period settings.
The Implicit Parameter: Comparison to Previous Bar! The entire interpretation hinges on comparing the current bar’s BW MFI and Volume to the previous bars. So, implicitly, the “lookback” for generating the signal is just 1 period.
Volume MA (Optional Context): While BW MFI itself is parameter-free, some traders might separately add a Moving Average (e.g., 20-period SMA) to their traditional Volume bars (not the BW MFI bars) just to get a general sense of whether the current volume is high or low relative to average. This is not part of the BW MFI calculation but can provide context when interpreting the four zones (e.g., a Squat bar occurring on above-average volume might be more significant).
Timeframe Considerations:
Short Timeframes (M1-M15): Extremely noisy. The rapid fluctuations in range and volume bar-to-bar will generate tons of Green, Fade, Fake, Squat signals that might be meaningless or contradictory. Generally not recommended for reliable BW MFI analysis.
Medium Timeframes (H1-H4): Becomes much more usable. The signals start reflecting more significant shifts in effort vs. result over several hours. Good for confirming intraday or short-term swing setups.
Long Timeframes (D1, W1): Signals are fewer but carry more weight. A daily Green bar after a breakout, or a daily Squat bar at a major support level, provides significant information about market structure and conviction over a longer period. Best for trend analysis and identifying major potential turning points.
Consistency: Analyze BW MFI on the timeframe you are primarily trading on.
Remember, BW MFI shines brightest as part of the Bill Williams system.
Hottest Combo 1: The Full Bill Williams Suite
Tools: Alligator (Trend Filter), Fractals (Potential Entry/Stop Levels), Awesome Oscillator (AO – Momentum), Accelerator Oscillator (AC – Momentum Acceleration), BW MFI (Efficiency/Confirmation).
Workflow Example (Long Entry):
Price is above the Alligator’s mouth (uptrend bias).
AO is green and/or above zero (bullish momentum).
AC is green (momentum accelerating).
Price breaks above a recent Up Fractal.
Check BW MFI: Is the breakout bar a Green Bar? Strong confirmation. Is it a Fade Bar? Maybe wait. Is it a Fake Bar? ⚠️ High risk, potentially avoid. Is it a Squat Bar? Intense battle at the breakout, wait for resolution on the next bar.
Effect: Uses BW MFI as a final confirmation/warning layer for entries signaled by the other Williams indicators, focusing on efficient moves.
Hottest Combo 2: Squat Bar Reversal/Breakout Strategy
Execution:
Identify a Squat Bar (BW MFI Down, Vol Up) forming at a key Support/Resistance level, after a strong trend, or within a tight consolidation. This signals a major battle.
Wait for the next bar to resolve the battle.
If the next bar breaks strongly in one direction (ideally on a Green Bar), consider entering in that direction. The Squat absorbed the opposing force.
Effect: Uses the Squat bar to identify high-tension points ripe for a potential sharp move.
Hottest Combo 3: Fade Bar Exit/Pause Signal
Execution: When you are in a profitable trend trade (long or short), if you start seeing consecutive Fade Bars (BW MFI Down, Vol Down), it’s a signal that market interest and momentum are drying up.
Action: Consider tightening your stop-loss, taking partial profits, or potentially exiting the trade, as the move might be ending.
Effect: Provides an early warning to protect profits when the market loses steam.
Hottest Combo 4: Fake Bar Filter for Breakouts
Execution: When price appears to break out of a range or trendline, check the BW MFI on the breakout bar. If it’s a Fake Bar (BW MFI Up, Vol Down), treat the breakout with extreme suspicion. It likely lacks the volume conviction to succeed.
Action: Avoid chasing Fake breakouts or wait for much stronger confirmation.
Effect: Helps filter out low-probability breakouts driven by speculation rather than genuine participation.
Optimal Parameter Combos? (The Simple Truth)
BW MFI Calculation: NO PARAMETERS.
Interpretation: Relies solely on comparing the current BW MFI bar and Volume bar to the previous ones.
Volume MA (Optional Context): If used on the volume chart itself for context, 20-period SMA is common.
Timeframe: H1, H4, D1 are generally the sweet spots for reliability.
Conclusion: The “settings” for BW MFI are your eyes and your understanding of the four zones. The “optimal combo” is using it within a structured trading system, ideally Bill Williams’, to confirm or invalidate signals.
The Bottom Line: BW MFI – Your Market Efficiency Gauge (The Final Take)
The Bill Williams Market Facilitation Index (BW MFI) is a unique tool that visualizes the efficiency of price movement by comparing the price range to the volume traded for each bar. It doesn’t predict direction but assesses the quality and market willingness behind price changes.
Its primary value comes from interpreting the four zones:
Green: Go! Trend confirmed and accelerating.
Fade: Slowing down, interest waning, potential end of move.
Fake: Suspicious move, lacks volume backing, potential trap.
Squat: Intense battle, high tension, potential turning point brewing.
For young traders looking to understand the nuanced interplay between price and volume, and especially for those exploring the Bill Williams methodology, BW MFI offers powerful insights.
Remember:
It measures efficiency, not direction.
The four zones/bar types are the key interpretation method.
It has no calculation parameters.
Works best as a confirmation/warning tool within a system, especially with other Bill Williams indicators.
Be cautious on very short timeframes due to noise.
Alright! Hope this deep dive into BW MFI gets you hyped to try it out! Load it up, observe the four colors/zones, and see how it adds another layer to your market understanding! Catch you on the flip side! Keep facilitating those profits!