Physical Address
304 North Cardinal St.
Dorchester Center, MA 02124
Physical Address
304 North Cardinal St.
Dorchester Center, MA 02124
Alright, all you data-diving Alpha hunters, Crypto cycle surfers, and folks looking for a more pro angle on market overbought/oversold levels! Today, we’re decrypting an oscillator that looks similar to RSI/Stochastics but plays a whole different game, focusing more on “statistical significance” – the CCI (Commodity Channel Index)! Don’t let the name fool you into thinking it’s just for commodities; this indicator has tons of fans in stocks, forex, and crypto too! It doesn’t just look at simple highs and lows; it measures how far the price has deviated from its “normal range”!
What the heck is CCI? What’s the Core Difference from RSI/Stoch?
CCI was developed by Donald Lambert in 1980. Unlike RSI comparing up/down strength or Stochastics looking at the close vs. range, CCI’s core function is to measure how far the current price has deviated from its “statistical average price” over a period, in terms of “standard deviations” (more accurately, mean absolute deviation)!
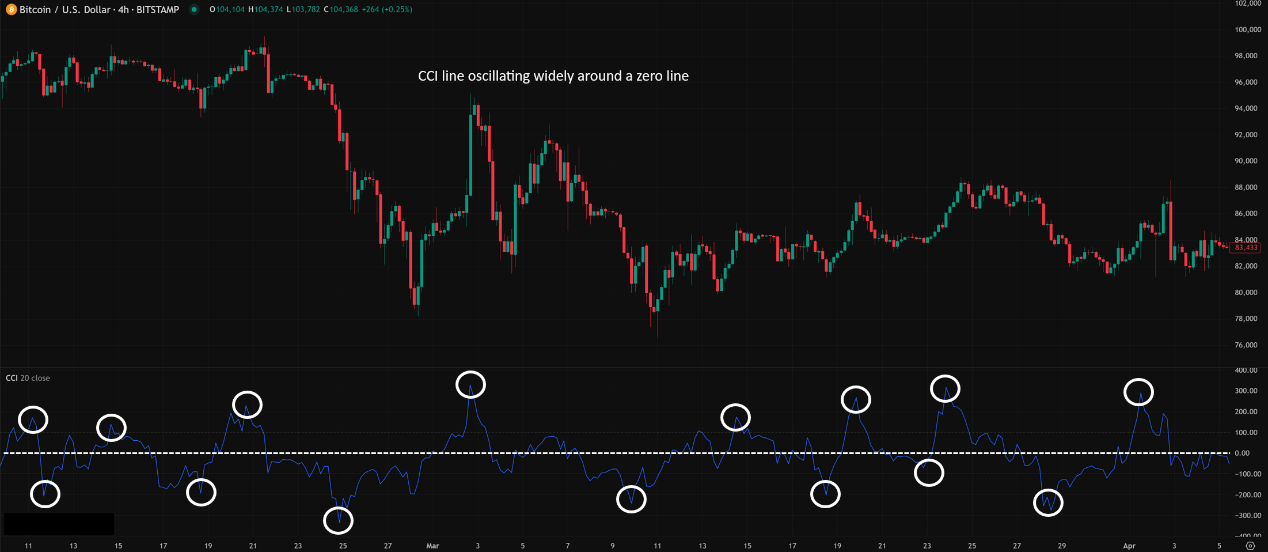
It usually appears as a single line oscillating around a Zero Line, and theoretically, it has no upper or lower bounds (though it often stays between +300 and -300). You’ll see two key horizontal lines:
+100 Level: CCI above +100 indicates the price is significantly above its statistical average, potentially entering a strong momentum zone / potential overbought warning area.
-100 Level: CCI below -100 indicates the price is significantly below its statistical average, potentially entering a weak momentum zone / potential oversold warning area.
「CCI Structure: Measuring Price ‘Deviation’ from Statistical Average」
Core Differences from RSI/Stoch:
Different Calculation Basis: RSI/Stoch are based on price’s relative strength or position (bounded 0-100). CCI is based on price’s relationship to its own “statistical average + deviation range” (theoretically unbounded).
Different OB/OS Meaning: RSI/Stoch hitting 70/80 or 30/20 is often directly interpreted as OB/OS. CCI hitting +100/-100 traditionally signifies trend initiation or strong trend momentum, not necessarily an immediate reversal! (This is crucial!)
Donald Lambert originally designed CCI to identify seasonal or cyclical turns in commodity futures markets. He wanted a way to determine if the price had moved too far from its “normal” fluctuation range, signaling the potential start of a new trend or the end of an old one.
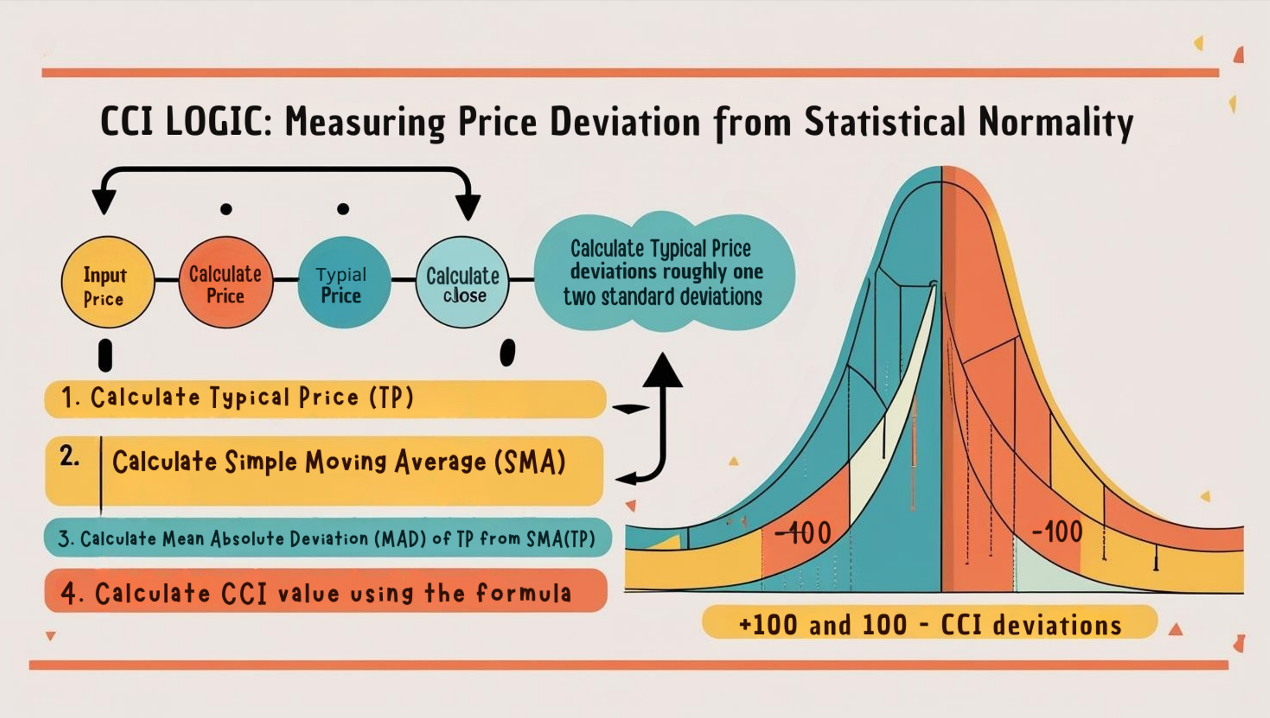
Core Calculation Concept (Feel the Stat Vibe):
Calculate Typical Price (TP): (High + Low + Close) / 3. Using TP instead of just the close better represents the day’s “center” price.
Calculate Simple Moving Average (SMA) of TP: SMA(TP, N), where N is the period (e.g., 20). This is our “statistical average price.”
Calculate Mean Absolute Deviation (MAD): Measures the average difference between each period’s TP and the SMA(TP) over the last N periods. This represents the “normal range” of fluctuation around the average.
Calculate CCI: (Current TP – SMA(TP)) / (0.015 * MAD)
Numerator is the difference between current price and the average.
Denominator is the average deviation adjusted by a constant (0.015). Lambert chose this constant so that roughly 70-80% of CCI values fall between +100 and -100.
So, the CCI value essentially tells you: How many multiples of the “normal fluctuation range” is the current price away from its average price?
「CCI Logic: Measuring Price Deviation from Statistical Normality」
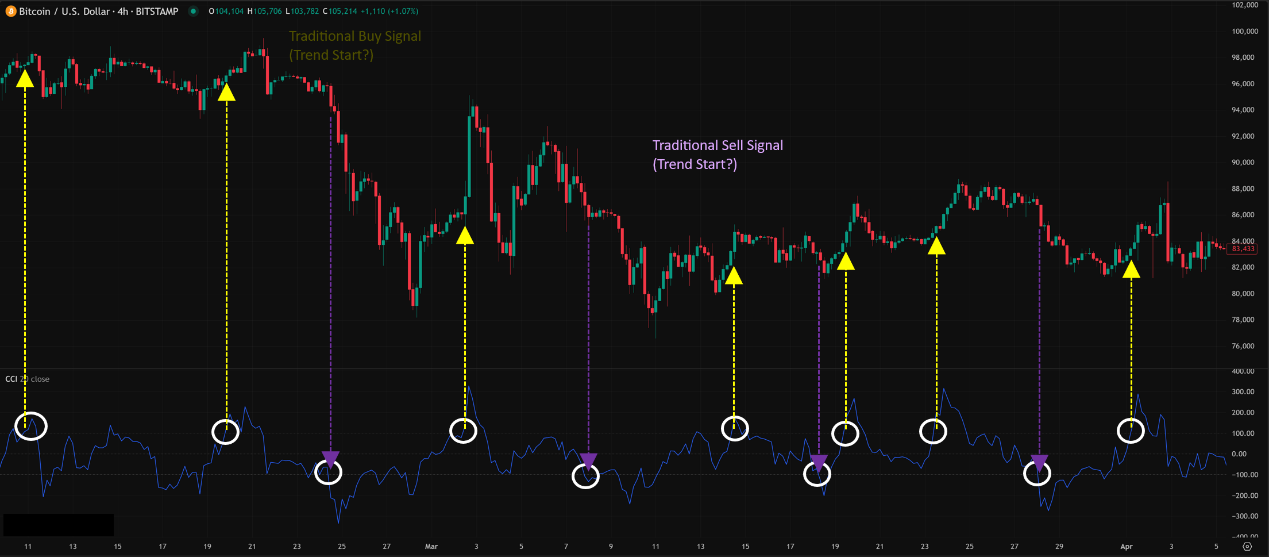
Crossing +/- 100 Levels (Traditional Trend Initiation/Strength Signal):
CCI crosses ABOVE +100 from below: Traditionally seen as a signal that an uptrend is starting/strengthening, potential buy consideration.
CCI crosses BELOW -100 from above: Traditionally seen as a signal that a downtrend is starting, potential sell/short consideration.
Note: This was Lambert’s original commodity trading usage, assuming breaks of +100/-100 caught the beginning of new trends. However, this approach can be lagging and may lead to chasing highs/lows in many markets (especially stocks/crypto).
「CCI Traditional Use: +/- 100 Breakouts」
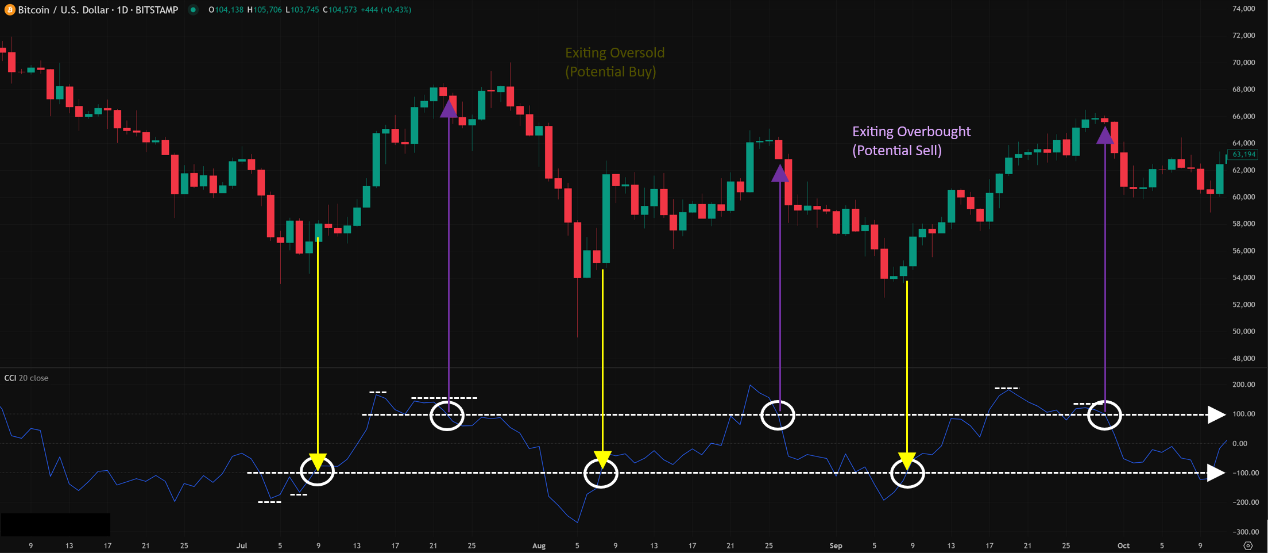
Using +/- 100 as OB/OS Zones (Modern Reversal Use – Needs Confirmation!):
CCI > +100: Market potentially overbought, watch for pullback opportunities.
CCI < -100: Market potentially oversold, watch for bounce opportunities.
More Reliable Use: Wait for the CCI line to cross back BELOW +100 from the >+100 zone as a potential sell signal; wait for it to cross back ABOVE -100 from the <-100 zone as a potential buy signal. Confirmation step is crucial! Especially look for confirming divergence!
「CCI Modern Use: +/- 100 as OB/OS Zones (Needs Confirmation)」
Zero Line Cross (Auxiliary Reference):
CCI crosses above 0 → Price moves above its statistical average, slightly bullish bias.
CCI crosses below 0 → Price moves below its statistical average, slightly bearish bias.
Usually considered a weaker, lagging signal, used for minor confirmation.
CCI’s strength lies in its statistical foundation and unbounded nature.
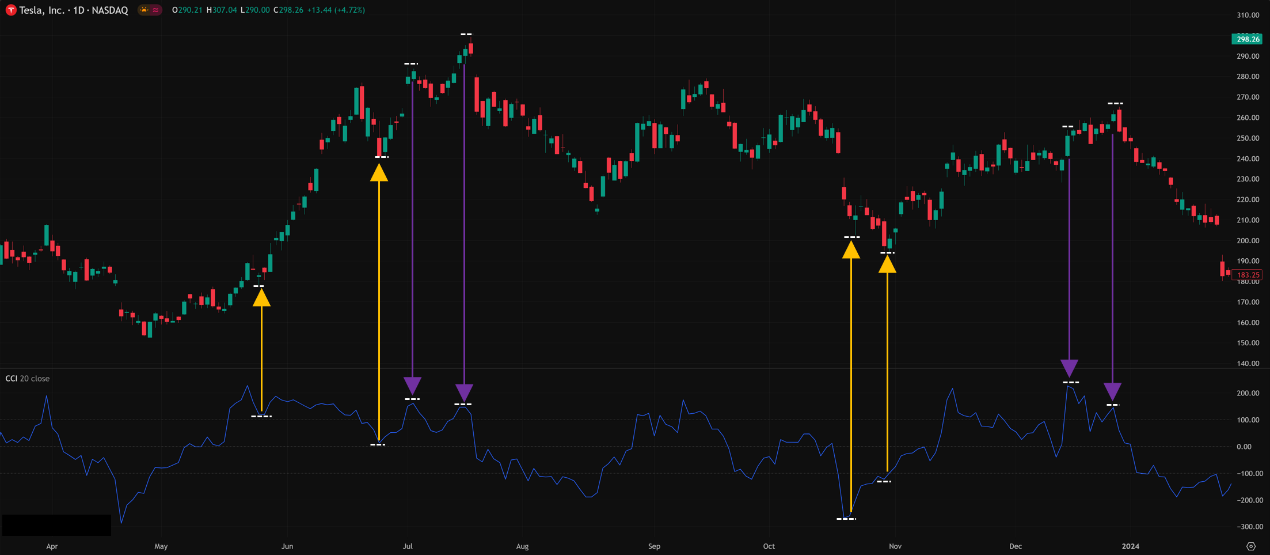
Divergence (CCI’s Superpower!):
Like RSI/MACD, divergence on CCI is a very reliable leading signal!
Regular Bullish Divergence: Price LL, CCI HL → Potential bottom.
Regular Bearish Divergence: Price HH, CCI LH → Potential top.
Hidden Divergence: Also applies, used to confirm trend continuation.
Why might CCI divergence be stronger? Because it measures deviation, when price makes a new high/low but the degree of deviation from the average actually weakens, it more strongly suggests underlying momentum failure.
「CCI’s Ace: Regular Divergence (Leading Reversal Signal)」
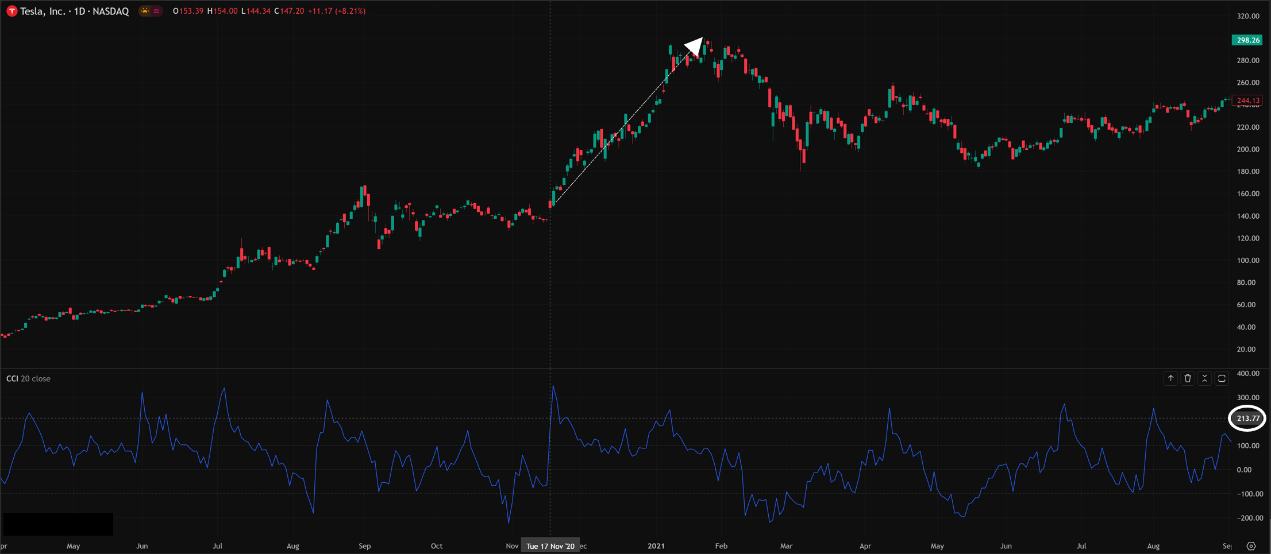
Extreme Readings >+200 / <-200 (Trend Confirmation!):
This is where CCI differs greatly from RSI/Stoch! When CCI reaches extreme levels (e.g., >+200 or <-200), it often DOES NOT signal an imminent reversal, but rather confirms the current trend is extremely strong!
How to Use:
CCI breaks above +200 → Strong uptrend likely to continue.
CCI breaks below -200 → Strong downtrend likely to continue.
In these scenarios, DO NOT fade the trend! Instead, consider adding to positions with the trend.
「CCI Extreme Values (+/-200): Usually Means Trend Continuation!」
CCI Trendline Breaks / Pattern Breaks:
Like other oscillators, you can draw trendlines or identify patterns (M-tops / W-bottoms) on the CCI line itself. Breaks on CCI sometimes lead price breaks.
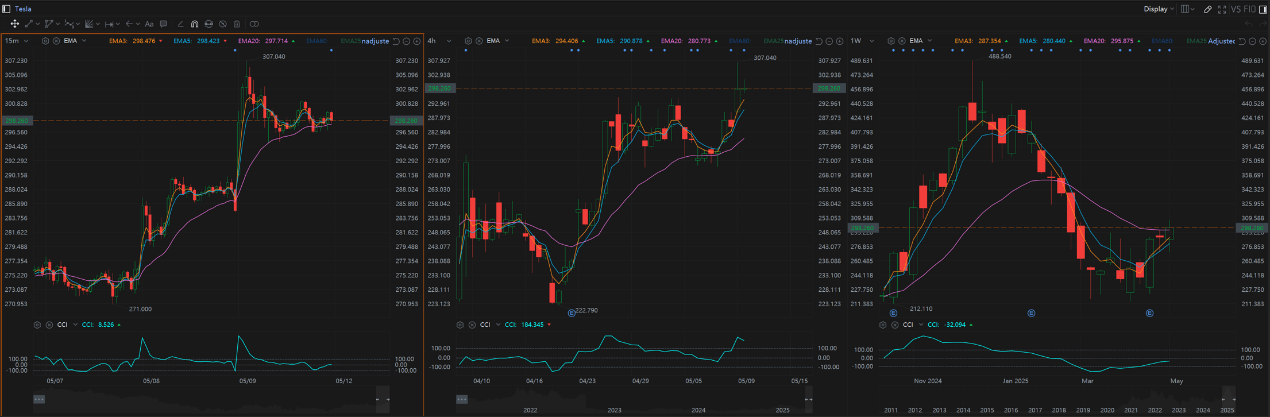
Multi-Timeframe Analysis:
Use Weekly CCI for long-term OB/OS states and major divergences.
Use Daily CCI for intermediate trends and +/- 100 breaks/cross-backs.
Use H4/H1 CCI for more precise entry timing (e.g., wait for Daily CCI <-100, then H4 CCI crosses back above -100).
Core Parameter: Period (N)
Default Parameter: 20! This was recommended by Donald Lambert and is the standard default on most platforms. It was deemed effective for catching roughly 20-day cycles in commodity markets.
Impact of Changing N:
Shorter N (e.g., 5, 9, 14):
CCI reacts faster, line is more volatile, hits +/- 100 or even +/- 200 more frequently.
Use Case: Short-term traders might use shorter periods (e.g., 14) for faster signals and divergence. Some even use 5 or 6 for scalping.
Risk: Increased noise, more false signals. Traditional +/- 100 trend initiation signals become mostly invalid.
Longer N (e.g., 50, 100):
CCI is smoother, reacts slower, line oscillates less wildly.
Use Case: Long-term traders use this to identify major long-term cycles and large-scale divergences. E.g., using CCI(50) on a Weekly chart for long-term OB/OS perspective.
Risk: Extreme lag, misses short-term opportunities.
Parameter Settings Analysis & “Hottest” Combo Discussion:
Is Period 20 Best? It’s the most standard, well-balanced choice, suitable for many markets and timeframes (especially Daily).
Any More “Unique” / “Hottest” Combos?
Combo 1 (Faster Reaction – Common for Shorter Term): CCI(14)
Many traders find 20 too slow, especially in volatile Crypto or for shorter-term trading. Period 14 offers faster reaction and is a very popular alternative.
Usage: Similar to period 20, but signals appear earlier (potentially more false signals too). Divergence and +/- 100 cross-backs remain key.
Combo 2 (Hyper Speed – Scalper Special?): CCI(5) / CCI(6)
Very aggressive settings, line becomes extremely sensitive and volatile.
Usage: Might only be used for extreme readings (e.g., +/- 200 or 300) combined with reversal patterns for scalping, or for ultra-short-term momentum confirmation. Extremely high risk, not for newbies!
Combo 3 (Longer Cycle – Catching Big Waves): CCI(50)
Mainly used on Daily / Weekly charts to capture major trends/cycles lasting months or longer. Signals will be rare but significant.
Conclusion: The “hottest” / most effective combos might be:
2. Agile Crew: Use 14 on H1/H4/Daily for faster reactions.
3. Long-Term Crew: Use 50 on Weekly charts for the big picture.
The Key: Understand the market rhythm associated with different N periods! No single N fits all.
「CCI Parameter N: Matching Your Market Rhythm」

Timeframe Analysis:
Ultra Short-Term (M1, M5, M15):
Using short N (e.g., 5, 14) makes CCI extremely active, very noisy. +/- 100 might be crossed constantly. Might primarily look at extreme readings (>+200/<-200) or very brief divergences. Reliability questionable.
Intraday / Short Swing (H1, H4):
CCI starts to shine. Use period (14) or (20).
Usage: Focus on capturing divergence signals and confirming +/- 100 cross-backs. E.g., H4 shows bullish divergence, wait for H1 CCI to cross back above -100.
Swing / Long-Term (Daily, Weekly):
CCI’s most reliable application area!
Usage:
Use (20) or (50) to identify major trend momentum (via extreme readings) and large-scale divergences.
Weekly CCI crossing back through +/- 100 is a long-term signal worth noting.
「CCI Timeframes: Longer = More Macro Signals」
Parameters: 20 (Standard) and 14 (Slightly Faster) are the most common and time-tested choices. 50 (Long-term) has specific uses. Extreme short periods (5/6) are for experts/risk-lovers only.
Timeframe: Daily/Weekly/H4 are the core application zones. H1 is usable, M15 or lower use with caution.
Hottest / Most Effective Usage = Master “Divergence” + Understand the Real Meaning of “+/- 100/200”:
Divergence is the Strongest Weapon! Both regular and hidden CCI divergences are important leading signals.
+/- 100 isn’t Simple OB/OS! Breaking out might signal trend start (traditional); crossing back might confirm reversal (modern). Context matters!
+/- 200 (or higher) Usually Means Trend Confirmation! Don’t fade it!
Multi-Timeframe Analysis greatly improves CCI signal reliability.
ALWAYS Combine with Price Action, S/R, Trendlines, etc.! CCI provides deviation and momentum info.
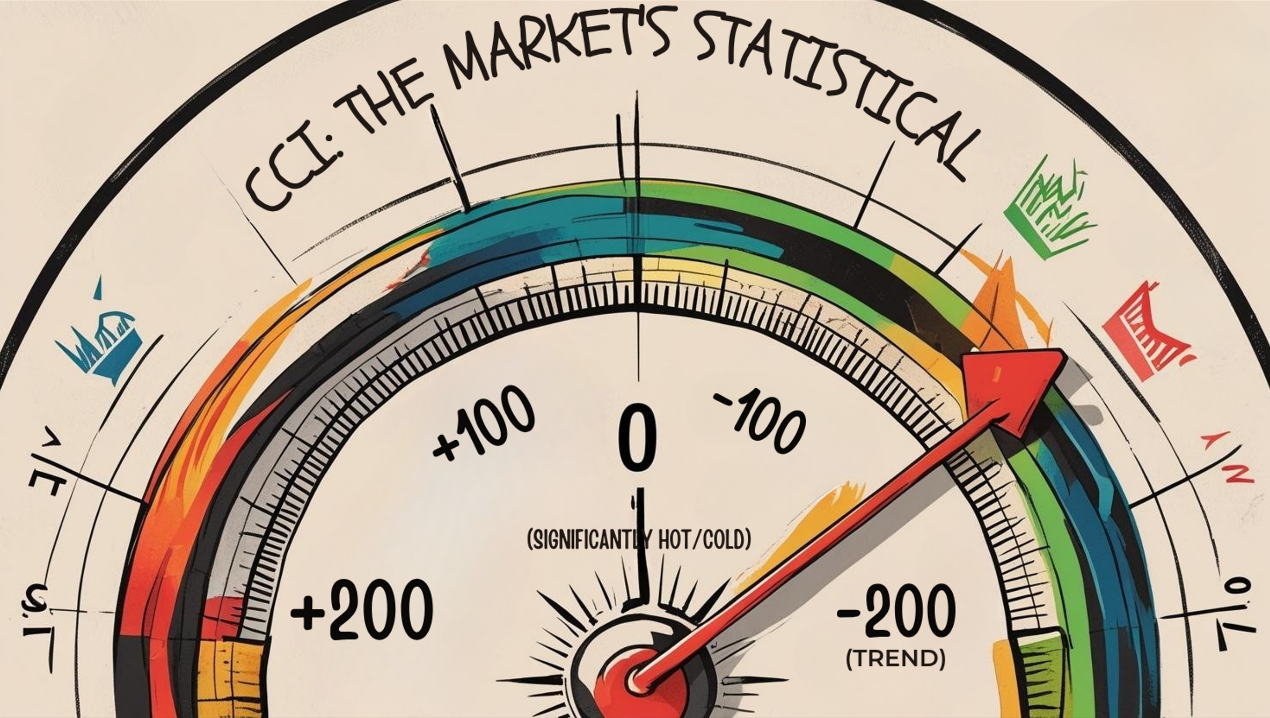
CCI: The Market’s “Statistical Thermometer,” Measuring Price’s Relative Heat
CCI offers a unique perspective by measuring price deviation from its statistical norm. Its strengths:
Statistical Foundation, clear concept.
Divergence signals are very powerful.
Extreme readings (>+/-200) effectively identify strong trends.
Theoretically unbounded, better reflects extreme moves.
Weaknesses:
+/- 100 meaning can be confusing (trend vs. reversal).
Line can be relatively volatile (especially short N).
Lag still exists.
「CCI: The Market’s Statistical Thermometer」
CCI is an oscillator well worth studying in depth, especially its divergence and extreme reading applications. It can add a different dimension of confirmation to your trading system.
Next Steps:
Add CCI (using default 20 period) to your H4, Daily, Weekly charts.
Add another CCI(14) for comparison to feel the speed difference.
Focus on practicing identifying CCI divergences and observing the subsequent price reaction.
Observe market behavior when CCI reaches +/- 100 and +/- 200.
Try using CCI crossing back through +/- 100 as a confirmation for your other strategies.
Backtest! Verify which period N and usage method works best for your style.
Hope you decode the secrets of price deviation and master the market’s statistical rhythm! ️