Physical Address
304 North Cardinal St.
Dorchester Center, MA 02124
Physical Address
304 North Cardinal St.
Dorchester Center, MA 02124
Alright! What’s up, cool Market Surfers and future Trading Legends! Time for some “real kung fu”! We’ve broken down tons of indicators before – some looking at volume, some at price, some at efficiency. But behind all the fancy tools, there’s a fundamental, OG “operating system” or “master framework” for the entire world of technical analysis – yeah, I’m talking about Dow Theory! ☯️
Heard the name and thought it sounds old school? Don’t underestimate it! Charles Dow’s insights, laid down over a century ago, basically set the framework for how we understand market behavior even today! Many concepts you’re learning now, like trends, support/resistance, and volume confirmation, trace their roots back to Dow Theory! It’s not an indicator giving you direct buy/sell signals, but rather a “mindset” for observing the market and understanding trends.
Wanna know why this century-old theory is still talked about so much? How it helps you identify bull and bear markets? How its principles can shape your trading strategy? Wanna build a solid “internal foundation” for your TA skills? Okay! Let’s travel back in time to the origins of TA and break down the core essence of Dow Theory in plain English! Let’s get back to the roots!
Dow Theory isn’t a single secret manual but a series of market observations and principles primarily established by this heavyweight:
The Founder: Charles Dow – He was one of the founders of The Wall Street Journal and co-founder of the Dow Jones Industrial Average (DJIA). From the late 19th to the early 20th century, he wrote a series of editorials discussing market behavior.
Not Written by Him Alone: Dow himself never actually compiled his theories into a single book. It was his successors and followers, like William Peter Hamilton and Robert Rhea, who organized, interpreted, and expanded upon his WSJ editorials to form what we now call Dow Theory.
Original Purpose: A Market Barometer – Dow’s initial goal wasn’t short-term trading. He wanted to create a way to gauge the overall health of the economy and the stock market – to determine if the broad market was in a Bull or Bear phase.
Profound Influence: The Cornerstone of Modern TA – Although over a century old and markets have evolved dramatically (hello, Crypto!), many core principles Dow Theory introduced – like the definition of trends, the role of volume, market phases, etc. – remain the foundation for almost all technical analysis methods used today. Learning TA without knowing Dow Theory is like learning martial arts without knowing basic stances!
So, Dow Theory originated from Charles Dow’s observations, was developed by his successors, and forms a fundamental framework of principles for judging major market trends and conditions.
Dow Theory is typically summarized into six core tenets – these are its “commandments”:
Meaning: All known and anticipated information – news, earnings reports, economic data, political events, even natural disasters – is already reflected in the market price (of indices or individual assets).
Implication: There’s no need to dig for insider info or try to perfectly predict how fundamental news will impact price, because the market has already “digested” this information through price and volume action. Studying price action itself is sufficient (a core belief of pure technical analysts!).
2. The Market Has Three Trends:
Think of the Ocean! Market movements aren’t monolithic; they consist of trends of different scales:
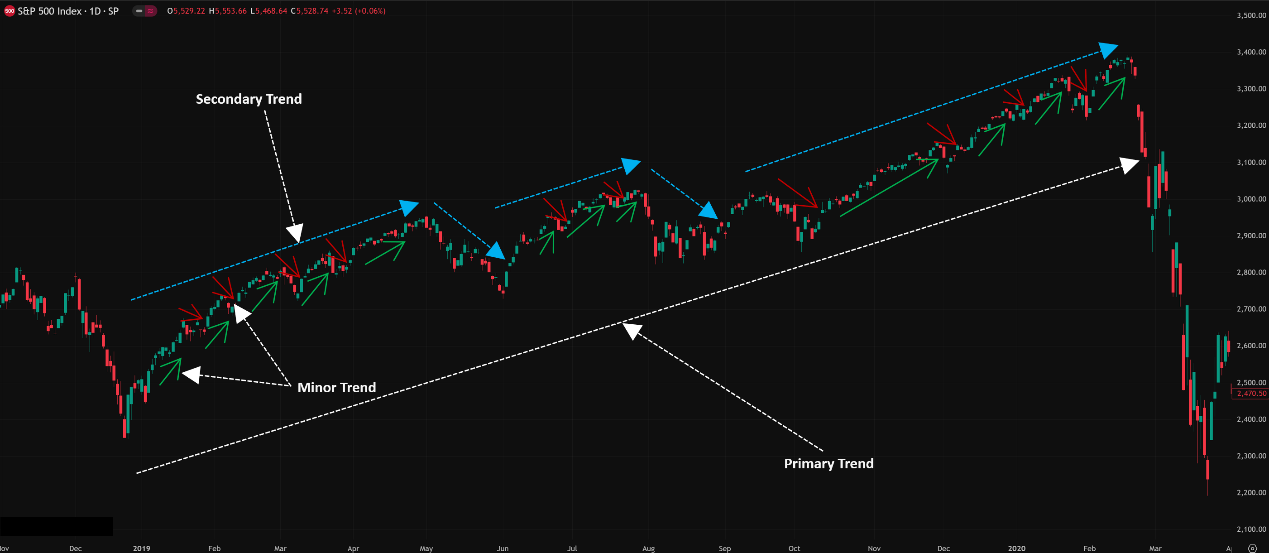
Primary Trend: Like the ocean’s tide. The largest, main direction, typically lasting a year or more (even several years). This is what we call a Bull Market or a Bear Market.
Secondary (or Intermediate) Trend: 〰️ Like the waves within the tide. These are corrective moves against the primary trend (pullbacks in a bull market, rallies in a bear market). Usually lasting a few weeks to several months.
Minor Trend: ﹏ Like the ripples on the waves. The shortest-term fluctuations, typically lasting days to a few weeks. Often considered market noise, less significant for determining the primary trend.
Key Takeaway: Know which trend you’re trading with. Don’t let minor trend fluctuations shake you out of a position aligned with the primary trend.
「Dow Theory’s Three Trends Explained」
3. Major Trends Have Three Phases:
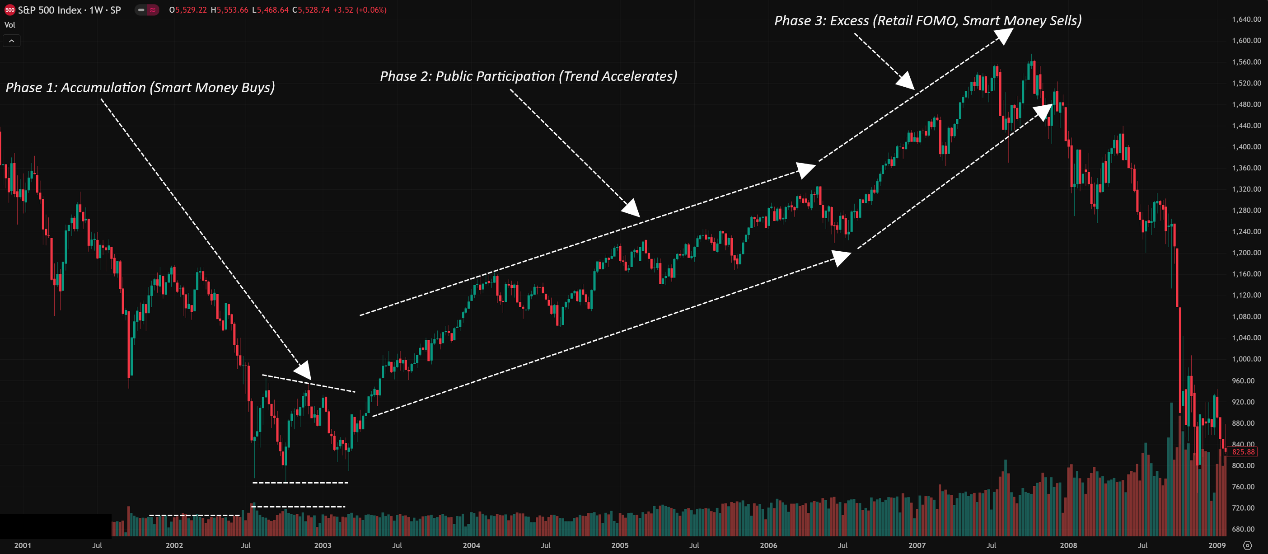
Whether it’s a bull or bear market, a primary trend typically unfolds in three psychological phases:
Phase 1: Accumulation (Bull) / Distribution (Bear):
Bull Accumulation: Near the end of a bear market, sentiment is terrible, but insightful “Smart Money” starts quietly buying assets they believe are undervalued, often while prices are still flat or slightly falling. Volume might subtly increase (watch OBV/A&D Line).
Bear Distribution: Near the end of a bull market, sentiment is euphoric, prices keep hitting new highs, but “Smart Money” feels assets are overvalued and starts quietly selling their holdings to the eager retail crowd chasing the rally. Price might still be rising, but volume may not keep pace, potentially showing divergence (watch OBV/A&D Line).
Phase 2: Public Participation (Bull) / Panic Phase (Bear):
Bull Participation: The trend becomes obvious, fundamental news improves, more investors (both technical and fundamental) jump in, price accelerates upward, and volume increases significantly. This is often the longest and strongest phase of the uptrend.
Bear Panic: The downtrend is confirmed, bad news spreads, investors who held on finally capitulate and engage in panic selling, causing prices to drop sharply. Volume might surge during the panic. This is often the fastest falling phase.
Phase 3: Excess Phase (Bull) / Despair/Bottoming Phase (Bear):
Bull Excess: Market enters irrational exuberance. Everyone’s a genius; taxi drivers are giving stock tips. Price might see a final, frantic surge (Blow-off Top) on huge volume but also high volatility. New retail investors pile in. This is when “Smart Money” finishes selling and exits.
Bear Despair: After the panic, most have given up and exited. Market activity dies down, volume dwindles. This is often where the foundation for the next accumulation phase begins.
Key Takeaway: Understanding which phase the market might be in helps gauge the trend’s health and potential risks.
「Three Phases of a Primary Uptrend (Bull Market)」
4. The Averages Must Confirm Each Other:
Original Meaning: Dow primarily watched the Dow Jones Industrial Average (DJIA) and the Dow Jones Transportation Average (DJTA). He reasoned that if industrial companies (making goods) were doing well, transportation companies (shipping goods) should also be doing well. For a healthy bull market, both averages should confirm each other’s trend (e.g., both making new highs). If one made a new high but the other didn’t follow, it was a danger sign (a divergence).
Modern Application: This principle extends to broader market confirmation. Examples:
Are the S&P 500 and NASDAQ making new highs together?
Are most industry sectors participating in the rally?
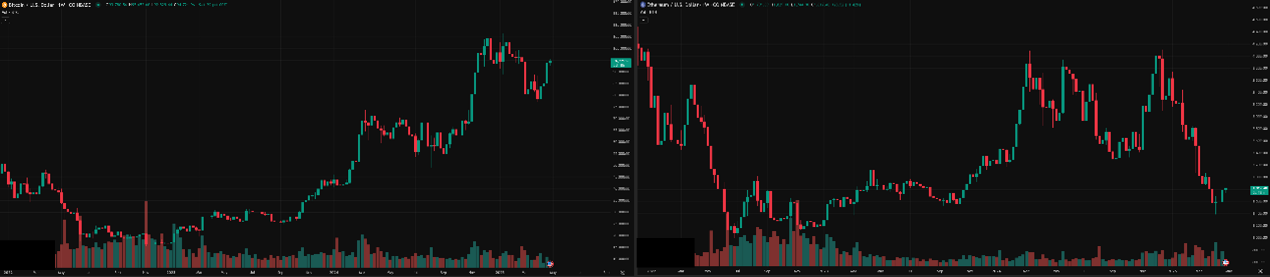
In Crypto: Are Bitcoin and Ethereum (or other major altcoins) moving in sync?
Key Takeaway: A healthy major trend should have broad market participation. A rally driven by only a few sectors or leaders is often less sustainable.
Volume Must Confirm the Trend:
This principle is critical! We covered it detail when discussing the Volume indicator.
The Core:
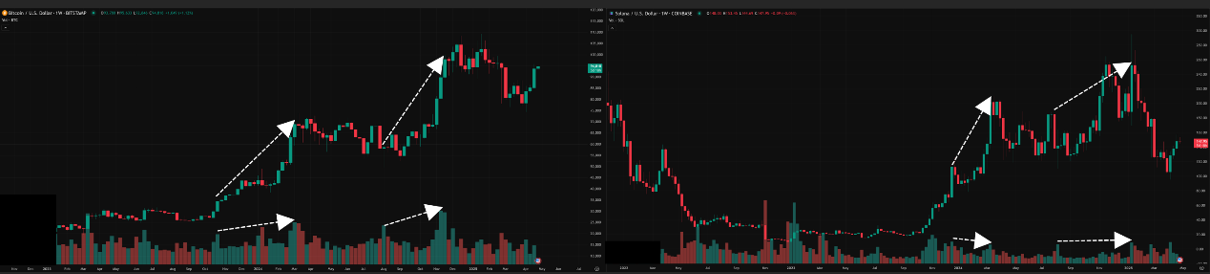
An uptrend should be accompanied by increasing volume (especially on breakouts), while volume should decrease on pullbacks.
A downtrend is often accompanied by increasing volume (especially during panic or breakdowns), while volume should decrease on rallies.
Price-Volume Divergence: If the relationship between price and volume doesn’t follow these patterns (e.g., price up on low volume, price down on low volume followed by a weak volume rally), it’s a warning sign that the trend might be weakening or reversing.
Tools: Use basic Volume bars + VMA, or indicators like OBV, A/D Line, MFI, CMF to help assess.
「Volume Confirmation vs. Divergence」
6. A Trend Is Assumed to Be in Effect Until It Gives Definite Signals That It Has Reversed:
Principle: Markets have inertia. An established trend tends to continue in its current direction until a significant opposing force emerges to break the existing trend structure.
What are “Definite Reversal Signals”?
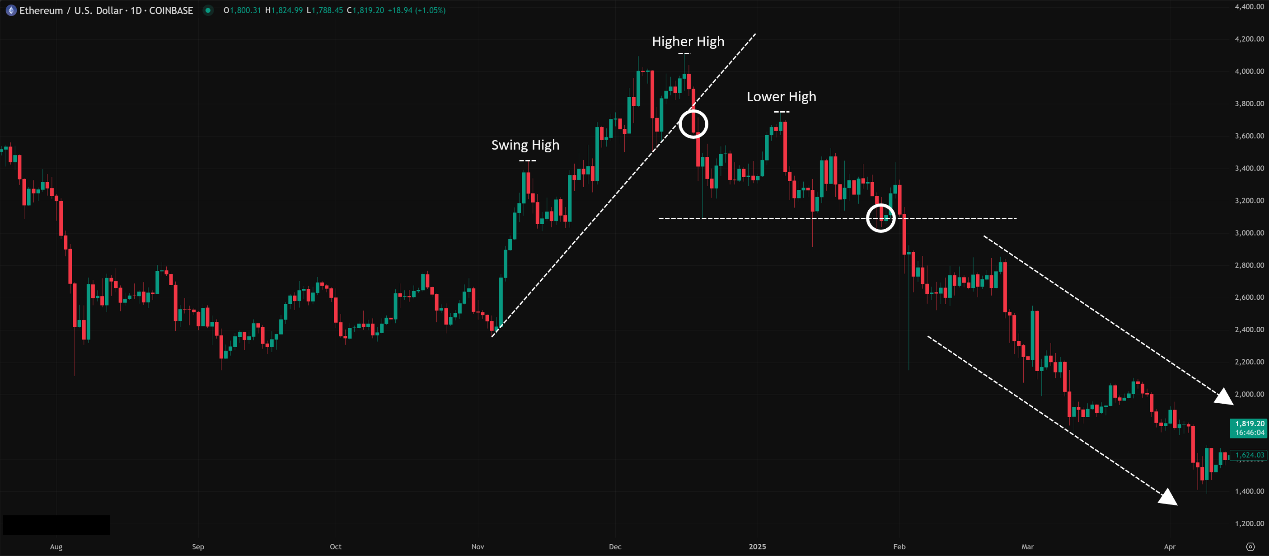
Uptrend Reversal: Price fails to make a Higher High (HH), instead forming a Lower High (LH), AND then breaks below the previous significant Higher Low (HL). (Formation of LH + Break of HL = Potential Reversal)
Downtrend Reversal: Price fails to make a Lower Low (LL), instead forming a Higher Low (HL), AND then breaks above the previous significant Lower High (LH). (Formation of HL + Break of LH = Potential Reversal)
Key Takeaway: Don’t try to arbitrarily pick tops or bottoms! Wait for price structure itself to show clear signs of breaking down before concluding a trend has likely reversed.
「Uptrend Reversal Signal (Structure Break)」
Dow Theory itself doesn’t provide precise entry/exit points. It’s an analytical framework and way of thinking.
Level 1: Basic Usage – Core Applications
Identify the Primary Trend:
The most fundamental and important application! Open a chart (especially Weekly/Daily), use Dow Theory’s HH/HL and LH/LL definitions to determine if the market is currently in a primary Bull or Bear market.
Execution: Find the last several major swing highs and lows. Do they fit the HH/HL (Bull) or LH/LL (Bear) structure?
Principle: Always trade in the direction of the primary trend! Look for buying opportunities in a bull market, look for shorting opportunities (or stay out) in a bear market.
Use Secondary Trends for Entries:
If the primary trend is up (Bull), secondary trends are corrective pullbacks. Use tools like Fibo, Pivot Points, MAs, trendlines to find support at the end of these secondary waves (pullbacks) and look for buy signals to rejoin the primary uptrend.
If the primary trend is down (Bear), secondary trends are relief rallies. Look for resistance at the end of these secondary waves (rallies) to find shorting opportunities.
Confirm Signals with Volume:
Whether it’s a trend continuation or a breakout/reversal signal, always check if volume confirms the price action. Volume-confirmed signals are more reliable.
Identifying Market Phases:
Attempt to determine if the market is currently in the Accumulation, Public Participation, or Excess/Distribution phase based on price action and volume characteristics.
Accumulation: Prolonged bottoming/ranging after a decline, low volume but maybe occasional spikes (smart money buying?), price refuses to fall further. Start watching, but maybe not time to enter yet.
Participation: Price breaks out of consolidation, clear uptrend forms, pullbacks are shallow, volume is healthy (increases on rallies, decreases on dips). This is the main phase for trend-following.
Excess/Distribution: Price accelerates perhaps parabolically, huge volume but high volatility, or price rises on weakening volume (divergence). Euphoria is high. Be very cautious, consider taking profits, avoid chasing highs.
Reverse logic for bear market phases.
Difficulty: Phase identification is subjective and requires experience, often combined with other indicators.
Applying Cross-Market Confirmation:
Use the spirit of the fourth principle (Averages Confirm).
US Stocks: Check if S&P 500, Nasdaq, Russell 2000 (small caps) are trending together.
Crypto: Check if BTC, ETH, and representative Altcoin indices (like TOTAL2, TOTAL3) are moving in sync. If BTC makes a new high, but ETH and most alts lag or fall, be wary of the rally’s health.
Effectiveness: Assessing market “breadth” helps determine if a trend has broad support.
Spotting Potential Reversals Early:
Beyond the basic LH + break of HL / HL + break of LH structure, look for:
Trendline Break: A decisive break of a major trendline is a significant warning.
Key Long-Term MA Break: E.g., breaking below the 200-day moving average.
Prolonged Divergence: Price making new highs/lows while volume/momentum indicators (OBV, A/D, MFI, RSI, MACD) consistently fail to confirm.
Pattern Signals: Formation of major reversal patterns like Head & Shoulders.
Dow Theory reminds us trends persist, but also to watch for these clues that might signal a “definite reversal.”
Does Dow Theory Have Parameters? NO! Absolutely Not! It’s a set of Qualitative Principles, not a mathematical indicator with input settings!
The “Parameters” Are Actually:
How YOU define “Primary,” “Secondary,” and “Minor” trends? This depends on the Timeframe you are analyzing.
How YOU define a “significant” high or low? (Requires human judgment, or indicators like Zig Zag which do have parameters).
How YOU define “volume confirmation”? (E.g., Volume needs to be above the 20-period VMA?).
How YOU define a “definite reversal signal”?
Timeframe is KEY!
Primary Trend: Usually viewed on Weekly / Monthly Charts, lasting 1+ years.
Secondary Trend: Usually viewed on Daily / Weekly Charts, lasting weeks to months.
Minor Trend: Usually viewed on Intraday / Daily Charts, lasting days to weeks.
Important Concept: Trends on different timeframes are nested within each other. A primary uptrend on the Daily chart (Secondary level) might just be one upward wave within a larger primary Bull Market on the Weekly chart (Primary level).
Which Combo Is “Hottest” & Effective? (Hottest Combo & Effectiveness)
Dow Theory itself doesn’t have “combos” or “settings.” It’s a thinking framework.
The “Hottest” / Most Effective is the “Application Framework”:
Use long-term charts (Weekly/Daily) to identify the Primary Trend direction (set the stage).
Only deploy trades in the direction of the Primary Trend (trade with the tide).
Use medium/short-term charts (Daily/H4/H1) to identify Secondary Trends (pullbacks/rallies).
Utilize other technical tools (Fibo, MAs, Pivot Points, Candle Patterns, Volume Indicators, etc.) to find high-probability entry points at the end of Secondary Trends, in the direction of the Primary Trend.
Use Dow Theory reversal principles (structure breaks) to help determine when to potentially exit or reverse.
Always seek volume confirmation.
Effectiveness: Dow Theory provides a macro, logical navigation system for the market. It won’t give precise entries, but it makes your trading decisions more informed, directional, and helps prevent getting lost in the noise.
Best Parameter Combo?
None! Because it has no parameters!
The “Best” is your understanding of the six principles and your ability to apply them across different timeframes and markets!
The Bottom Line: Dow Theory – Your TA Constitution
Dow Theory, though old, is absolutely not outdated. It is the bedrock and logical core of the entire technical analysis discipline. Think of it as the “fundamental principles of martial arts” – guiding how you observe, understand, and react to the market’s constant flux.
Mastering Dow Theory helps you:
Establish a proper understanding of trends.
Understand the relationship between different timeframe trends.
Learn to use price-volume relationships for confirmation.
Identify potential market phases and turning points.
Build a macro, logical trading framework.
For all young traders wanting to build a solid foundation in technical analysis and see the bigger market picture, deeply understanding and applying the six principles of Dow Theory is an essential step on the path from novice to pro!
Remember:
It’s a set of principles, not an indicator.
No parameters, but Timeframe determines the trend level you’re seeing.
The Trend is Your Friend (until it ends).
Volume confirmation is vital.
It provides the framework; you need other tools for execution.
Alright! Hope this “back to the roots” exploration of Dow Theory helps solidify your TA foundation! Start applying these principles when you look at your charts! See ya next time! Trade with the trend, understand the theory!