Physical Address
304 North Cardinal St.
Dorchester Center, MA 02124
Physical Address
304 North Cardinal St.
Dorchester Center, MA 02124
Alright, all you Cycle Hunters searching for hidden market rhythms, Crypto swing masters, and friends looking to pinpoint turning points in ranging markets! Today, we’re unlocking a rather unique oscillator designed specifically to “see through” the short-term trend and focus on capturing market cycle highs and lows – the DPO (Detrended Price Oscillator)! Its name, “Detrended,” spells out its core game plan: ignore the major trend and zero in on identifying short-term peaks and troughs!
What the heck is DPO? How does it “Detrend”?
DPO is a special kind of indicator. Its purpose is NOT to follow trends, but rather to “strip away” the long-term trend from price action. This allows for a clearer view of short-term price cycles and extreme overbought/oversold levels within those cycles.
It appears as a single line oscillating around a Zero Line.
Core Calculation: It compares the current price to a Simple Moving Average (SMA) from a certain point in the past (N/2 + 1 periods ago). It intentionally ignores the most recent data’s impact on the SMA, effectively shifting the SMA backward by half its period!
DPO = Current Close – SMA(Close, N)[shifted back by N/2 + 1 periods]
(N is the period you set)
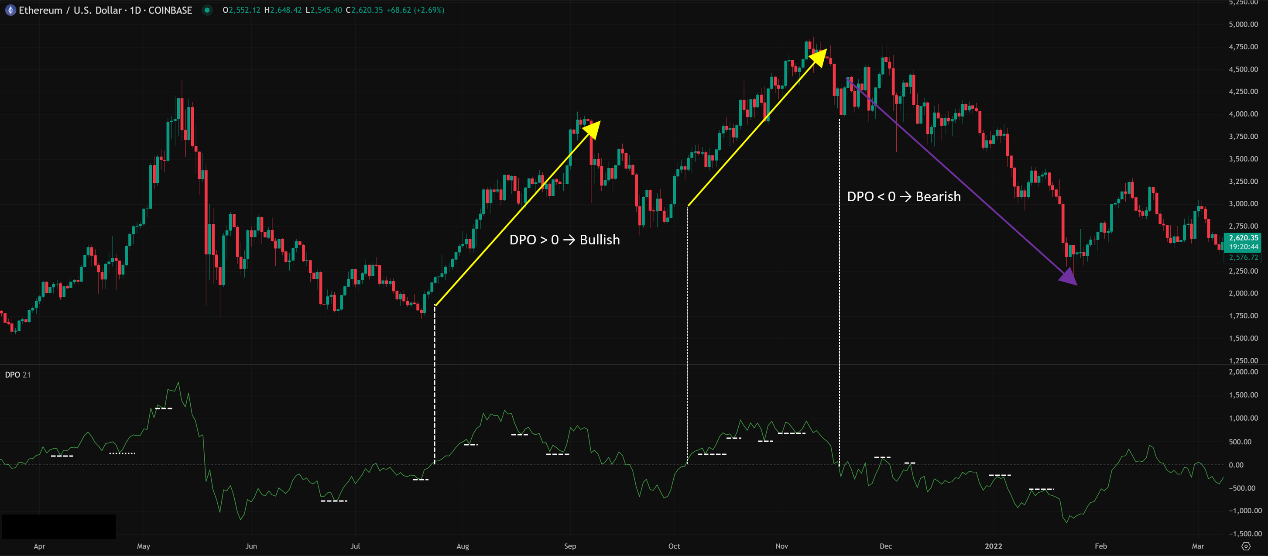
Interpretation:
DPO > 0 → Price is above the average price from the “past center point,” short-term bullish bias within the cycle.
DPO < 0 → Price is below the average price from the “past center point,” short-term bearish bias within the cycle.
Peaks on the DPO line → Correspond to tops in the short-term price cycle.
Troughs on the DPO line → Correspond to bottoms in the short-term price cycle.
Biggest difference from other oscillators:
RSI/Stoch/CCI: All have concepts of OB/OS zones, though used differently.
DPO: It has NO standard overbought/oversold levels! Its highs and lows are relative and primarily used to identify cyclical tops and bottoms. It focuses more on timing within cycles.
The specific inventor of DPO is harder to pin down; it’s more like a method developed within technical analysis to solve the problem of “trends interfering with oscillator readings.” Many oscillators fail in strong trending markets (e.g., RSI staying overbought). DPO aims to provide a clearer view of short-term cyclical swings by “removing” the influence of the longer-term trend.
Design Philosophy:
Trend is Noise (for cycle analysis): It assumes that if you want to analyze short-term cycles, the longer-term trend is actually interference.
Compare “Now” vs. “Past Center”: Comparing current price to the SMA from N/2+1 periods ago effectively shifts the reference point into the past, showing how price oscillates around this “past average level.”
Identify Cycle Tops/Bottoms: The peaks and troughs of the DPO theoretically correspond to the highs and lows of the short-term price cycle being analyzed.
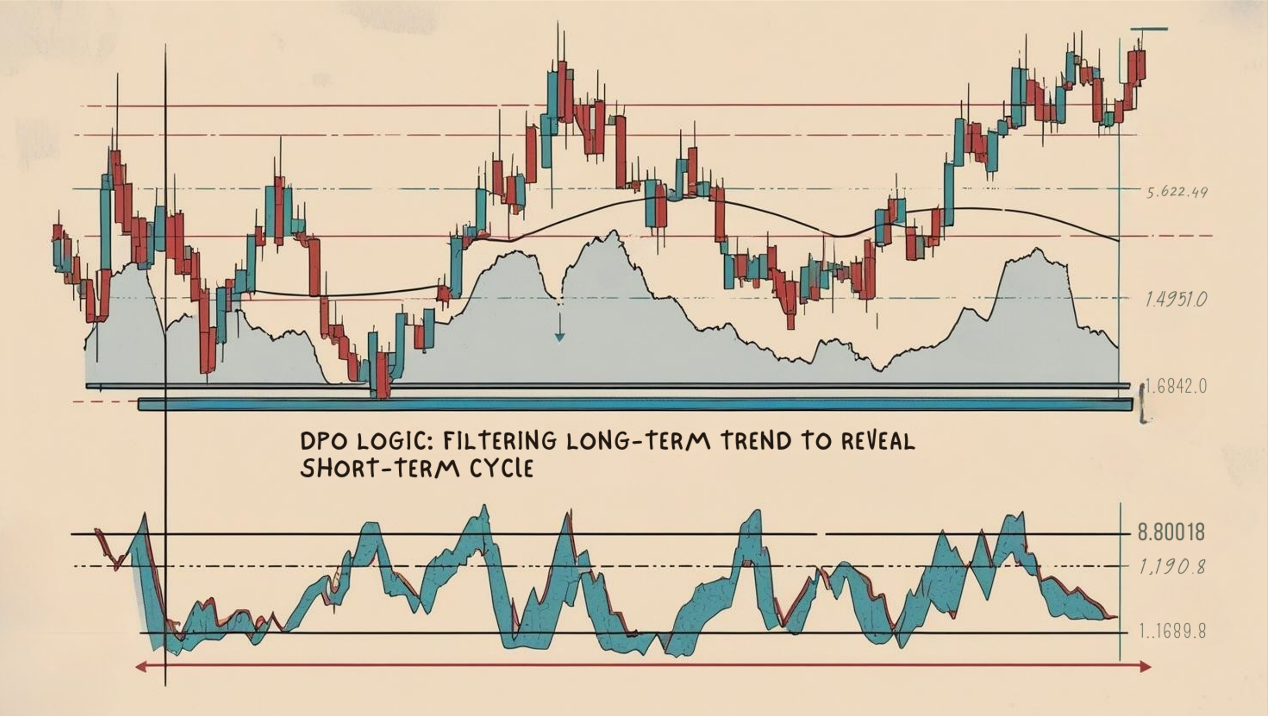
Simply Put: DPO is like putting on glasses that “filter out the long-term trend,” allowing you to see the price’s short-term “ups and downs” (cycles) more clearly.
「DPO Logic: Filtering Long-Term Trend to Reveal Short-Term Cycles」
Remember DPO’s core is identifying short-term cycle tops & bottoms!
Zero Line Cross (Limited Significance):
DPO crosses above zero → Price is above its past center average, short-term strength turning up?
DPO crosses below zero → Price is below its past center average, short-term strength turning down?
Usage: This signal is less meaningful than zero crosses on other indicators because DPO isn’t designed to gauge trend direction. It merely reflects position relative to a past average.
Peak & Trough Identification (Core Usage!):
DPO forms a clear Peak and starts turning down → Suggests the short-term price cycle might be topping out, potential sell/exit long timing.
DPO forms a clear Trough and starts turning up → Suggests the short-term price cycle might be bottoming out, potential buy/exit short timing.
Key: Identifying “clear” peaks/troughs, not every minor wiggle.
「DPO Core Use: Identifying Short-Term Cycle Tops & Bottoms」
Estimating Cycle Length:
Observe the time distance (number of bars) on the DPO chart between consecutive peaks or between consecutive troughs. This helps estimate the approximate length of the dominant short-term cycle in the market.
Usage: Knowing the rough cycle length helps anticipate when the next top/bottom might occur. E.g., if you observe a ~20-day cycle, then about 10 days after the last trough, you’d start watching for DPO peak formation.
Advanced DPO usage focuses on refining cycle identification and parameter setting.
Core Parameter: Period (N)
DPO has one primary parameter: the base period N used for the SMA calculation and the backward shift.
Default Parameter: Commonly 20 or 21.
Meaning of N: This N represents the length of the trend you want to filter out, or roughly twice the length of the short-term cycle you want to observe!
E.g., using DPO(20) compares current price to the SMA from roughly 11 periods ago (20/2 + 1). It tries to remove trends longer than 20 periods, mainly showing cycles shorter than 20 periods.
Impact of Changing N:
Shorter N (e.g., 10, 14):
Filters out shorter trends, reveals shorter, more frequent cyclical swings. Line reacts faster, more peaks/troughs.
Use Case: For traders aiming to catch very short-term reversals.
Risk: More noise, cyclicality might be less clear.
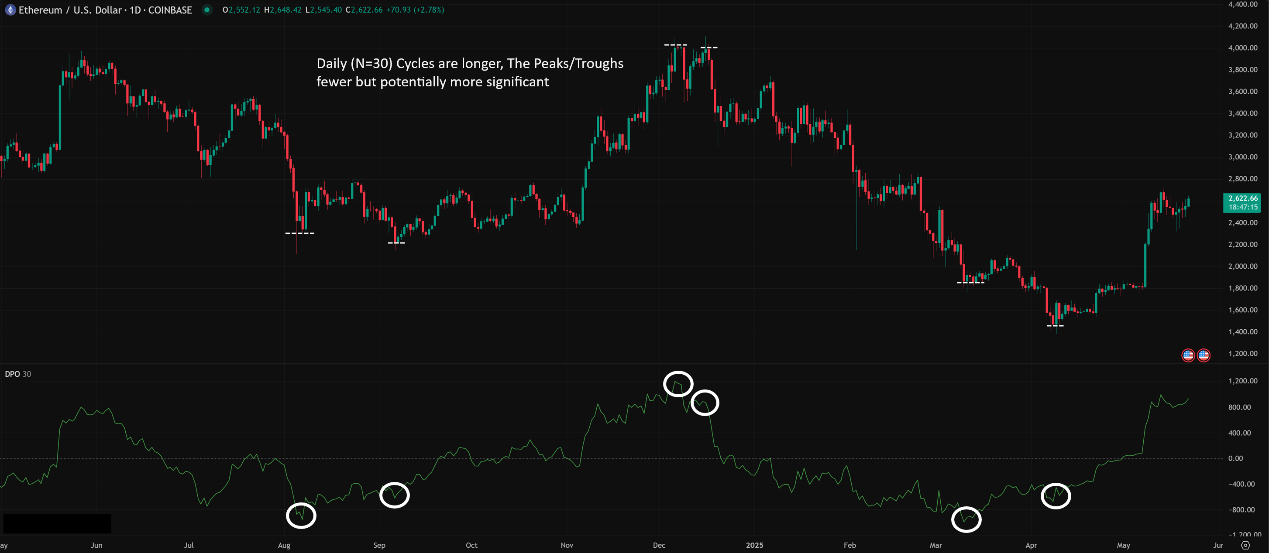
Longer N (e.g., 30, 50):
Filters out longer trends, reveals longer, smoother cyclical swings. Line reacts slower, fewer but potentially more significant peaks/troughs.
Use Case: For traders aiming to catch intermediate swing tops/bottoms.
Risk: Increased lag.
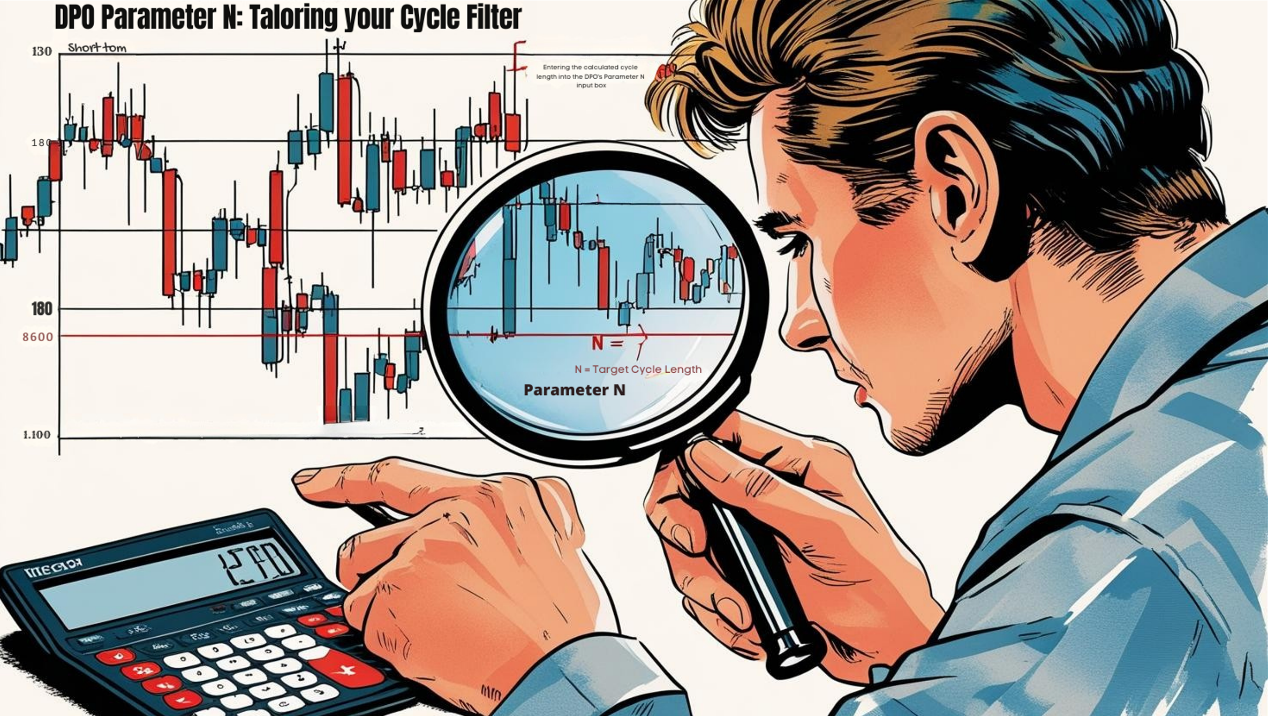
How to Choose N? Key is Matching the Market Cycle You Want to Catch!
This is where DPO differs significantly from other indicators! While others might have a “best general” setting, DPO’s N value should ideally be tuned based on the dominant short-term cycle you observe in the market!
The Process:
Visually inspect the price chart (or use other cycle analysis methods, though complex) to estimate the average number of bars between clear short-term highs or between clear short-term lows (this is the Cycle Length you want to capture).
Set DPO’s N parameter = Your Estimated Cycle Length! (Because DPO uses N/2+1 shift, setting N to the cycle length roughly isolates that cycle).
Example: If you visually estimate short-term bottoms occur roughly every 20 bars, try setting DPO(20).
“Hottest” Combo? No Fixed Answer, Market Dependent!
Different markets and timeframes have different dominant short cycles.
Common Starting Points:
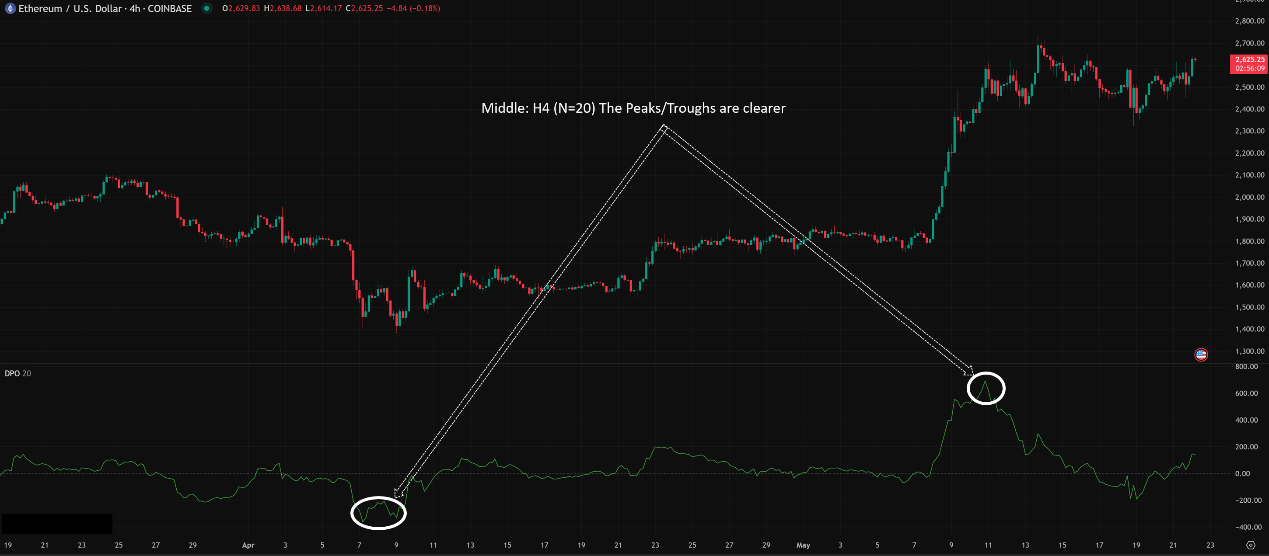
20 / 21: The most common default, corresponds to roughly a 10-11 period cycle, works reasonably well on Daily or H4 charts in many markets. Arguably the most versatile “golden zone” starting point.
14: If you want to focus on shorter cycles (around 7 periods).
30 / 50: If targeting longer cycles (around 15-25 periods).
How to Set for Crypto? Crypto volatility means cycles might shift quickly.
May need to review and adjust N more frequently.
20 or 14 are likely common starting points.
Conclusion: No single “hottest” combo exists. The best approach is:
2. Visually estimate the short-term cycle length on the chart for your target timeframe.
3. Set DPO parameter N = your estimated cycle length.
4. Observe if DPO peaks/troughs align well with the visual price tops/bottoms. If not, fine-tune N. This takes practice!
「DPO Parameter N: Tailoring Your Cycle Filter」
Timeframe Analysis:
All Timeframes Applicable! But N needs corresponding adjustment!
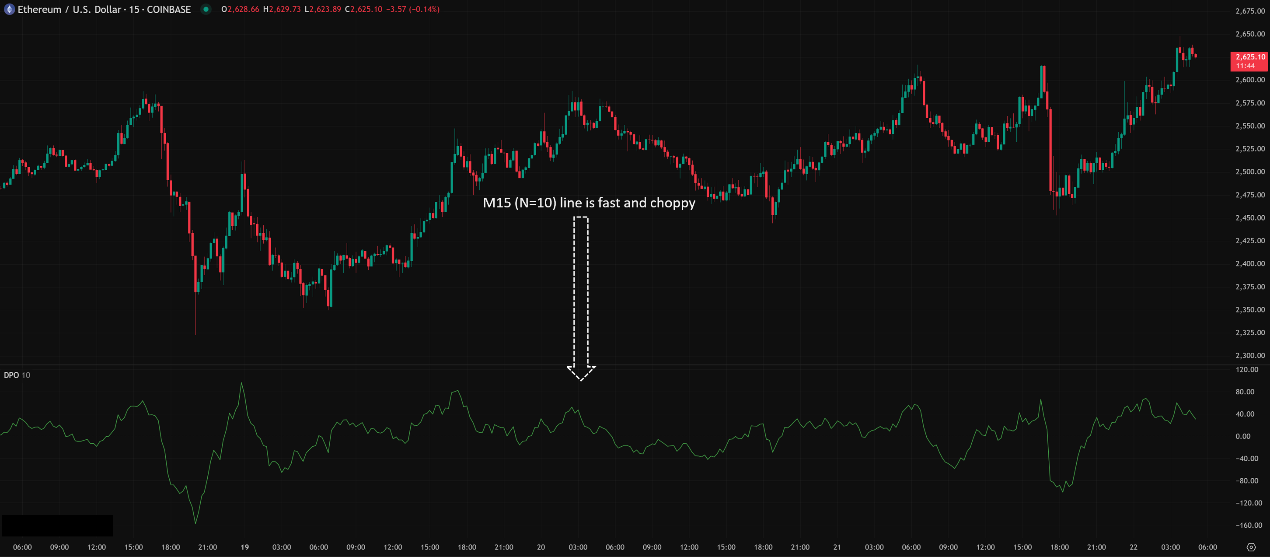
Ultra Short-Term (M1, M5, M15):
Requires very short N (e.g., 5-10). DPO will be extremely volatile, numerous peaks/troughs. Might be used with other indicators for extreme short-term reversal trades. Very difficult!
Intraday / Short Swing (H1, H4):
Common usage zone! N value might be around 14-21. DPO peaks/troughs can be combined with S/R levels or candle patterns to catch intraday or short swing turning points.
Swing / Long-Term (Daily, Weekly):
Very useful! N value might range from 20-50 or even longer. Can identify major swing top/bottom zones. E.g., using DPO(20) on a Weekly chart (for ~10-week cycles) to spot intermediate correction tops/bottoms.
「DPO Timeframes: Adjust N According to Period」
Parameters: No “unique,” only “matched”! Hottest approach is setting N based on your target cycle length. 20/21 is a versatile starting point.
Timeframe: All usable, but N must adapt. H4/Daily with N=20/21 is a common combo.
Hottest / Most Effective Usage = Focus on Identifying “Cycle Tops/Bottoms” + Combine with “Price Levels”:
Core Use: Find DPO Peaks & Troughs! This is its primary signal.
Don’t Use Alone! DPO suggests when a turn might happen, not at what price. Must combine with key Support/Resistance (S/R) Levels!
Golden Combo: DPO Peak + Price at Key Resistance + Bearish Candlestick Pattern = High-probability short setup.
Golden Combo: DPO Trough + Price at Key Support + Bullish Candlestick Pattern = High-probability long setup.
Estimate Cycle Length to help anticipate timing for the next turning point.
DPO: Your Market “Cycle Detector” – Filtering Trend to See the Rhythm
DPO, through its unique “detrending” method, helps us focus on the short-term cyclical nature of price movements. Its pros:
Effectively identifies short-term cycle tops and bottoms.
Helps estimate cycle lengths.
Filters out long-term trend interference, potentially clearer than other oscillators in ranges.
Cons:
Not a trend indicator, doesn’t give major direction.
No fixed OB/OS levels, peak/trough identification requires practice.
N parameter requires tuning based on observed cycles.
Can still lag (due to SMA base).
「DPO: The Market’s Short-Term Cycle Sonar」

DPO is a relatively niche but cleverly designed tool. If your trading style focuses on catching short-term swing reversals or you want a deeper understanding of market cyclicality, investing time in studying and experimenting with DPO is definitely worthwhile.
Next Steps:
Add DPO (use default 20 or 21) to your favorite H4 or Daily charts.
Observe how DPO Peaks and Troughs align with short-term price highs and lows.
Try estimating the cycle length visually and adjusting N accordingly. See if the peak/trough alignment improves.
Practice combining DPO peak/trough signals with key S/R levels for trade ideas.
Backtest! Test the effectiveness of different N values in your market and timeframe.
Hope you master the market’s short rhythms and precisely catch those cycle turns!