Physical Address
304 North Cardinal St.
Dorchester Center, MA 02124
Physical Address
304 North Cardinal St.
Dorchester Center, MA 02124
Alright Crew! Fasten your seatbelts, ’cause today we’re diving into the deep end of technical analysis, exploring one of the most complex, debated, yet potentially powerful methods for understanding market structure – the legendary Elliott Wave Theory (EWT)!
Heard whispers about “Wave 3 extensions” or “ABC corrections”? Seen charts covered in cryptic numbers and letters? That’s EWT territory! This isn’t your typical indicator; it’s a comprehensive theory about how markets move, suggesting that price action unfolds in specific, repetitive patterns (waves) driven by mass psychology.
Developed decades ago, EWT attempts to provide a roadmap for market cycles, identifying where we might be in a larger trend and what kind of price action to expect next. It’s like trying to decipher the market’s natural rhythm. But be warned: it’s complex, subjective, and takes serious dedication to master.
Ready to explore the fractal nature of markets and try counting waves? Let’s break down Elliott Wave Theory from its roots to its modern application! Let’s ride the waves!
EWT comes from the meticulous observations of one man who believed markets weren’t random.
The Pioneer: Ralph Nelson Elliott – In the 1930s, R.N. Elliott, an accountant and business consultant, undertook an exhaustive study of decades of stock market data (primarily the Dow Jones indices). He wasn’t looking for simple patterns but for underlying organizational principles.
The Discovery: Repetitive Patterns: Elliott concluded that market prices move in specific, repetitive patterns, which he called “waves.” He observed that these patterns were linked to the prevailing mass psychology of investors – the swings between optimism and pessimism.
The Link to Nature & Fibonacci: Elliott noticed that the structure and proportions of these market waves seemed to adhere to ratios found in the Fibonacci sequence (0, 1, 1, 2, 3, 5, 8…) and the Golden Ratio (0.618 / 1.618). This suggested to him that market movements, like many natural phenomena, followed inherent mathematical proportions.
The “Wave Principle”: He published his findings in the book The Wave Principle in 1938 and later elaborated in articles for Financial World magazine. The theory gained followers like Charles J. Collins and later A.J. Frost and Robert Prechter, who further refined and popularized it.
Purpose: Mapping Market Cycles & Predicting Probable Paths: EWT aims to identify the market’s current position within a larger pattern, providing a framework for forecasting the most likely future path of prices based on historical wave structures and Fibonacci relationships.
So, Elliott Wave Theory emerged from R.N. Elliott’s detailed study of market history, proposing that collective investor psychology creates identifiable, fractal wave patterns that adhere to Fibonacci proportions.
EWT is built on several key concepts:
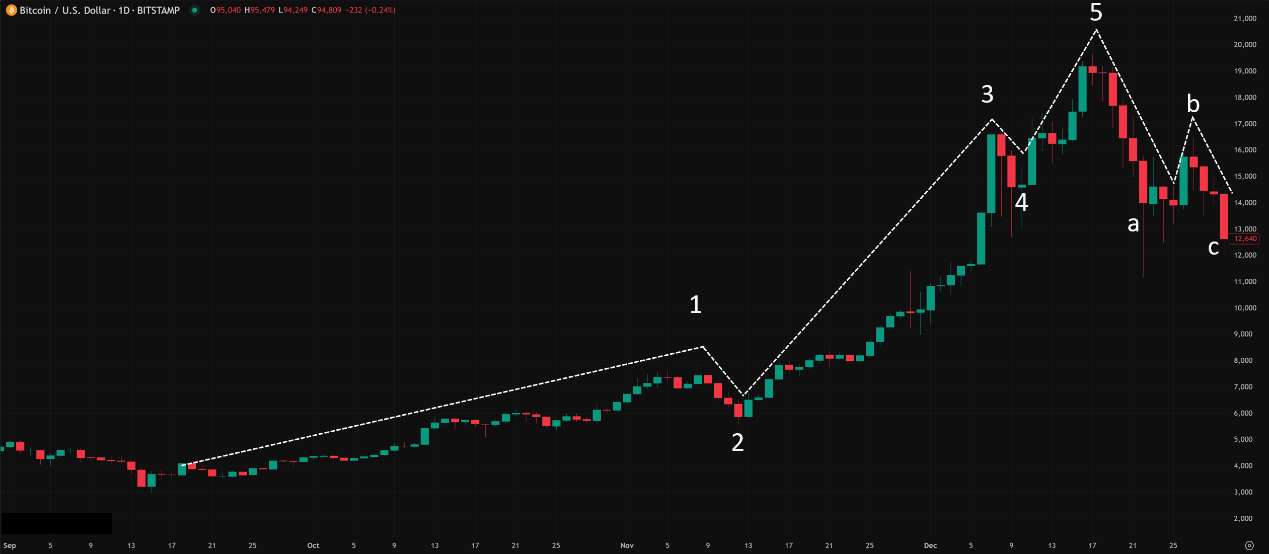
The Basic 5-3 Wave Pattern: This is the absolute foundation!
Impulse Waves (Moves with the main trend): Consist of 5 sub-waves, labeled 1, 2, 3, 4, 5.
Waves 1, 3, 5 are motive waves, moving in the direction of the larger trend.
Waves 2, 4 are corrective waves, moving against the direction of the larger trend (pullbacks or consolidations).
Wave 3 is often the longest and strongest impulse wave (but cannot be the shortest).
Corrective Waves (Moves against the main trend): Follow the 5-wave impulse and typically consist of 3 sub-waves, labeled A, B, C.
Waves A and C move against the primary trend established by the prior 1-5 sequence.
Wave B moves temporarily with the primary trend (a “sucker rally” or pullback within the correction).
A complete cycle consists of 8 waves (5 up, 3 down in a bull market; 5 down, 3 up in a bear market).
「The Basic 5-3 Elliott Wave Pattern」
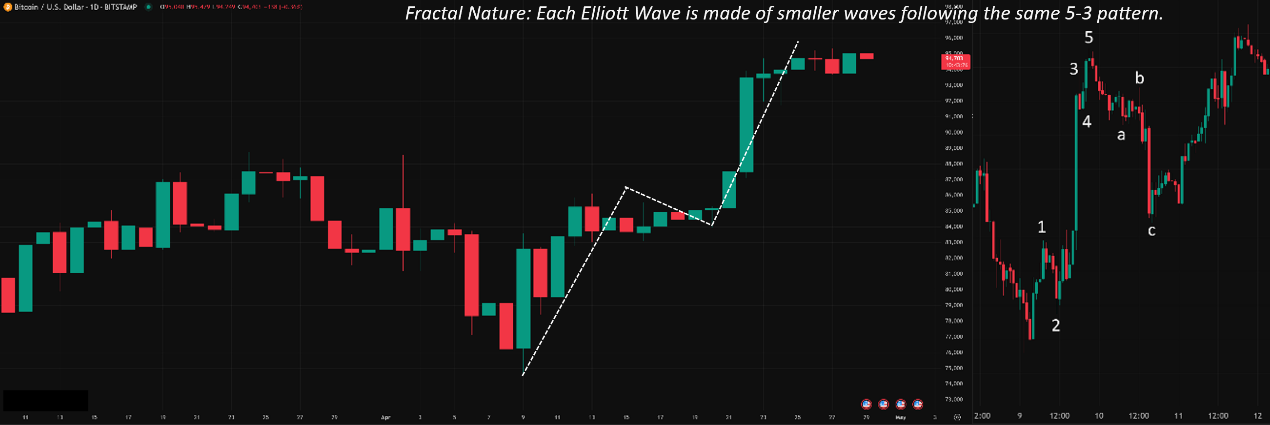
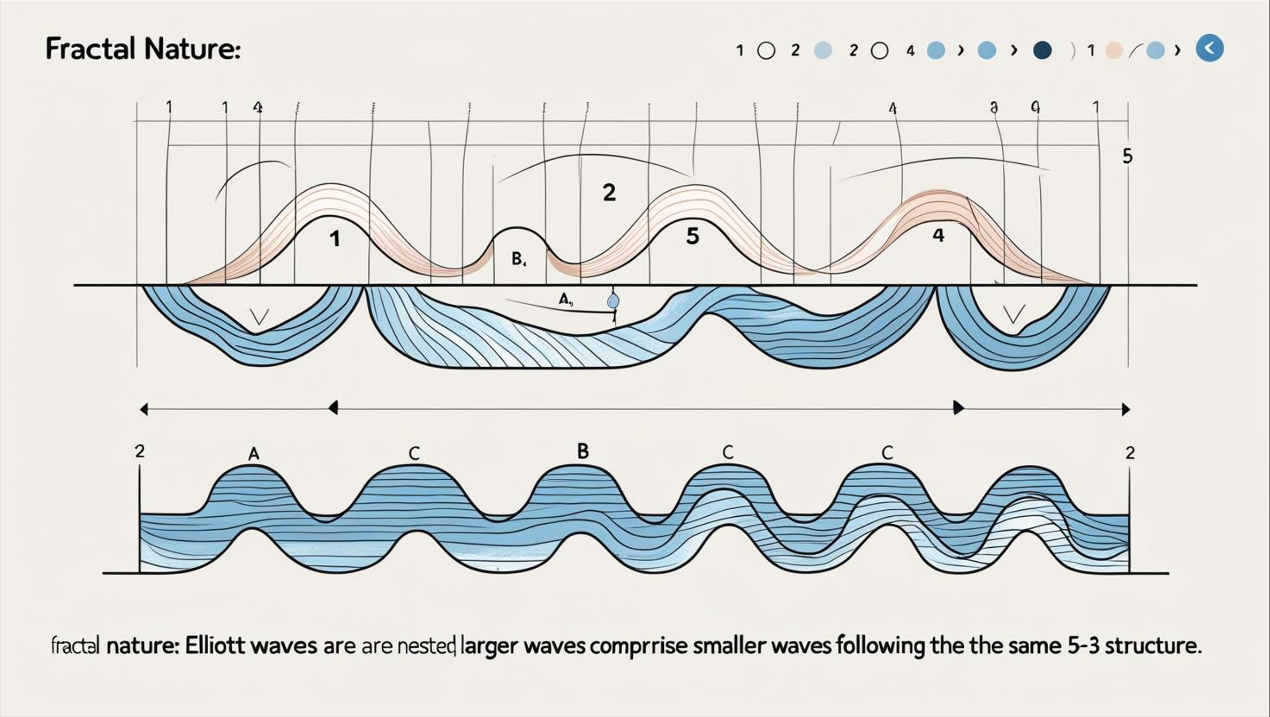
Fractal Nature (Waves Within Waves):
This is mind-bending but crucial! Each wave is itself composed of smaller waves following the same 5-3 pattern, and is also part of a larger wave pattern.
Waves exist on all timeframes, from minutes to centuries. Elliott identified different “degrees” of waves (e.g., Subminuette, Minuette, Minute, Minor, Intermediate, Primary, Cycle, Supercycle, Grand Supercycle).
Implication: What looks like a Wave 1 on a daily chart might be composed of 5 smaller waves on an hourly chart, and might itself be just a part of a larger Wave (III) on a weekly chart. Context is everything!
「Fractal Nature of Elliott Waves」
The Three Cardinal Rules (Cannot Be Broken!): For an impulse wave (1-2-3-4-5) count to be valid, these rules MUST hold:
Rule 1: Wave 2 never retraces more than 100% of Wave 1. (If it goes below the start of Wave 1, the count is wrong).
Rule 2: Wave 3 can NEVER be the shortest of the three impulse waves (1, 3, 5). It’s often the longest, but it absolutely cannot be the shortest.
Rule 3: Wave 4 never overlaps with the price territory of Wave 1. (The bottom of Wave 4 cannot go below the top of Wave 1. Exception: sometimes seen in highly leveraged markets or diagonal triangles, but this is advanced).
Guidelines (Common Tendencies, Not Rules): There are many guidelines that help identify waves, including:
Alternation: Wave 2 and Wave 4 often have different forms (if W2 is sharp and simple, W4 might be complex and sideways, and vice versa). Corrective waves A, B, C also alternate.
Wave Equality: Sometimes Wave 5’s length is approximately equal to Wave 1’s length.
Wave 3 Extension: Wave 3 is often 1.618 or 2.618 times the length of Wave 1.
Channeling: Impulse waves often stay within parallel trend channels.
Fibonacci Relationships: Retracements (Waves 2, 4, B) and Extensions (Waves 3, 5, C) frequently relate to each other via Fibonacci ratios (38.2%, 50%, 61.8%, 161.8%, etc.).
EWT is primarily an analytical framework, not a direct trading system with simple buy/sell triggers.
Level 1: Basic Application – Identifying the Pattern & Context
Identifying the Current Wave Count (The Main Challenge!):
This is the hardest part and where most subjectivity lies. You need to look at the chart (start with higher timeframes like Daily/Weekly) and try to fit the price action into the 5-3 wave structure, ensuring the 3 rules aren’t broken.
Process: Find significant swing highs/lows, try labeling them 1-2-3-4-5 or A-B-C, check if the rules hold, see if Fibo relationships fit. Often, multiple valid counts are possible initially!
Using the Count for Directional Bias:
If you believe the market is in an impulse wave up (1, 3, or 5), your bias should be bullish. Look for buy opportunities on corrective sub-waves (like Wave 2 or 4 pullbacks).
If you believe the market is in a corrective wave down (A or C), your bias should be bearish. Look for short opportunities on corrective sub-waves (like Wave B rallies).
If you believe the market is in Wave 2 or 4 pullback, expect a move against the main trend, but anticipate the main trend resuming afterwards.
If you believe the market is in Wave B rally, expect a move with the previous main trend, but anticipate the correction resuming with Wave C downwards.
Setting Expectations:
Knowing the “typical” characteristics of each wave helps set expectations. E.g., Don’t expect Wave 4 to be as powerful as Wave 3. Expect Wave C to potentially go below the low of Wave A.
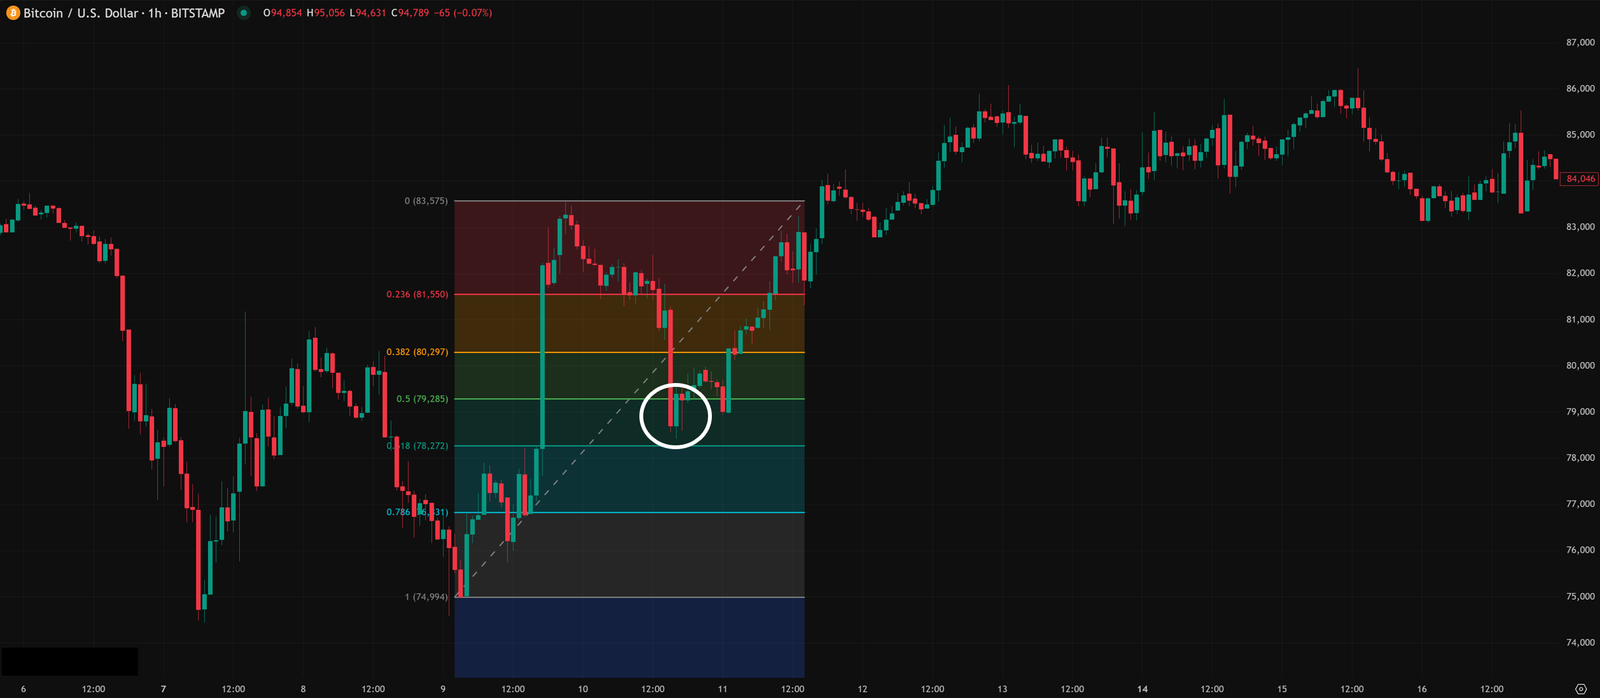
MASTERING Fibonacci Ratios within EWT: This is non-negotiable for serious wave analysis!
Retracements:
Wave 2: Often retraces 50% or 61.8% of Wave 1 (sometimes 38.2% in strong trends). Crucial for Rule 1 check!
Wave 4: Often retraces 38.2% or 50% of Wave 3 (typically shallower than Wave 2 due to Alternation). Crucial for Rule 3 check!
Wave B (in ABC): Highly variable, but often retraces 38.2%, 50%, or 61.8% of Wave A. Can sometimes exceed Wave A’s start in complex corrections (Expanded Flat).
Extensions/Projections:
Wave 3: Often extends to 1.618, 2.618, or even 4.236 times the length of Wave 1 (projected from the bottom of Wave 2). Finding Wave 3 is key!
Wave 5: Often has a relationship with Wave 1 (e.g., Wave 5 length = Wave 1 length) OR Wave 5 length = 0.618 or 1.618 times the length from the start of Wave 1 to the top of Wave 3 (projected from the bottom of Wave 4).
Wave C: Often has a relationship with Wave A (e.g., Wave C length = Wave A length, or 1.618 times Wave A length, projected from the end of Wave B).
How to Use: Use Fibonacci tools (Retracement & Extension/Projection) drawn on the waves identified by your count to find high-probability targets for wave endings and potential entry zones for the next wave.
「Fibonacci Retracement on Wave 2」
Combining EWT with Other Tools (Confluence is STILL King!):
NEVER use EWT in isolation! Its subjectivity requires confirmation.
Indicators: Look for RSI/MACD divergence at the end of Wave 5 or Wave C to confirm potential exhaustion. Use momentum readings to gauge Wave 3 strength.
Trendlines/Channels: Draw trendlines connecting wave pivots (e.g., 2-4 trendline in an impulse). Price often respects Elliott Wave Channels drawn parallel to the 0-2 or 2-4 line. A break of these lines can signal wave completion.
Volume: Should ideally confirm the trend (high volume in impulse waves 1, 3, 5; lower volume in corrective waves 2, 4). Volume spikes can signal Wave 3 or Wave 5 exhaustion.
Market Structure (Dow Theory): EWT counts must align with basic Dow Theory principles (HH/HL, LH/LL). A valid EWT reversal count should correspond to a Dow Theory structure break.
Multiple Timeframe Analysis (MTF is Essential):
Due to the fractal nature, you MUST analyze waves on multiple timeframes.
Workflow: Start with Weekly/Daily to identify the likely major wave count (Primary/Cycle degree). Then zoom into H4/H1 to count the sub-waves within the current Daily/Weekly wave. Use M15/M5 for precise entry timing based on the H1/H4 count.
Context: The higher timeframe count provides the context and bias for lower timeframe analysis. An apparent 5 waves up on H1 might just be Wave 1 of a larger Wave (3) on Daily, or it could be Wave C of a correction on Daily – the implications are vastly different!
Dealing with Subjectivity & Alternate Counts:
Often, especially in real-time, there can be multiple valid ways to count the waves according to the rules.
Pro Approach: Identify the preferred count (the one that seems most likely based on guidelines, Fibo, and other indicators) but ALSO keep alternate counts in mind.
Scenario Planning: Have a plan for what price action would invalidate your preferred count and validate an alternate count. Be ready to adapt!
EWT Itself: NO Parameters! The 5-3 structure, the 3 rules – these are fixed principles, not adjustable settings like an indicator’s period length.
The “Parameters” Are Your Interpretation & Tools:
Wave Count Choice: Which pivots define your waves? (Subjective)
Wave Degree Labeling: How do you classify the waves? (Subjective but needs consistency)
Fibonacci Tool Application: Drawing Fibo ratios correctly.
Helper Indicator Parameters (e.g., Zig Zag): If you use Zig Zag to help identify pivots for EWT, its parameters (Deviation/Depth) become relevant to your process, but not to EWT itself.
Timeframe:
EWT applies to ALL timeframes due to its fractal nature.
Higher Timeframes (W1, D1): Define the major, most significant wave structures and long-term trend. Counts are generally more reliable but slower moving.
Lower Timeframes (H4, H1, M15): Show the sub-waves within the larger waves. Used for more precise entry/exit timing and managing trades based on the higher timeframe bias.
Hottest/Most Effective “Combo”?
It’s not a parameter combo, but an analytical approach:
Top-Down MTF Analysis: Start W1/D1 for the big picture count, then drill down to H4/H1 for the current wave structure.
Focus on High-Probability Waves: Wave 3 (strongest trend move), end of Wave 2/4 (pullback entries), end of Wave C (correction end).
Fibonacci is Mandatory: Use Fibo retracements for entry zones (end of W2/W4/B) and extensions/projections for targets (end of W3/W5/C).
Seek Confluence: High probability setups occur where the EWT count, key Fibo levels, market structure (Dow), trendlines/channels, AND indicator signals (like divergence) all align.
Manage Risk & Alternate Counts: Always know where your count is invalidated and have a backup plan. EWT is probabilistic, not deterministic.
Best Parameter Combo?
None for EWT itself.
For Fibonacci tools: Standard levels (23.6, 38.2, 50, 61.8, 78.6 for retracements; 61.8, 100, 161.8, 261.8 for extensions) are universal.
For helper tools like Zig Zag: Parameters depend entirely on the timeframe and swing size you want it to identify for your wave counting process – requires personal testing.
Conclusion: The “best settings” for EWT are your brain, your experience, your consistent application of the rules and guidelines, and your mastery of Fibonacci relationships, applied across multiple timeframes.
The Bottom Line: EWT – A Market Map, Not a GPS
Elliott Wave Theory is a fascinating and potentially powerful framework for viewing markets as patterned, psychologically-driven systems. It’s not an easy “indicator” but a comprehensive analytical methodology.
It helps you:
Understand market cycles and structure.
Identify the current position within a potential trend.
Forecast high-probability future price paths (using waves and Fibo).
Set potential price targets and invalidation levels.
Gain insight into market psychology.
However, for young traders diving in:
It’s COMPLEX and SUBJECTIVE. Requires significant study and practice.
Multiple valid counts often exist. It provides probabilities, not certainties.
Not a standalone system. MUST be combined with other forms of analysis (price action, indicators, volume, S/R).
Focus on mastering the basics (5-3 pattern, rules, Fibo) before complex counts.
If you’re willing to put in the work, EWT can offer a unique and deep understanding of market movements. But don’t expect it to be a simple plug-and-play solution.
Hope this deep dive into Elliott Wave Theory gives you a solid starting point! Hit the books, hit the charts, and start counting! See ya! May your wave counts be profitable! ♂️