Alright, all you sharp traders, crypto heads, and fintech fans! Wanna crush the market? Just knowing how to read candlestick charts isn’t enough! Today, we’re gonna break down a must-have weapon for pro-level players — the EMA indicator (Exponential Moving Average). Don’t let the name scare you off; nail this down, and your trading game could seriously level up!
Yo, what the heck is EMA? Why should you even care?
Simply put, EMA is a type of Moving Average (MA). You’ve probably heard of SMA (Simple Moving Average). Well, EMA is the upgraded, high-speed version! Why high-speed? Because EMA gives more weight to recent price data, making it react faster and more sensitive to price changes.
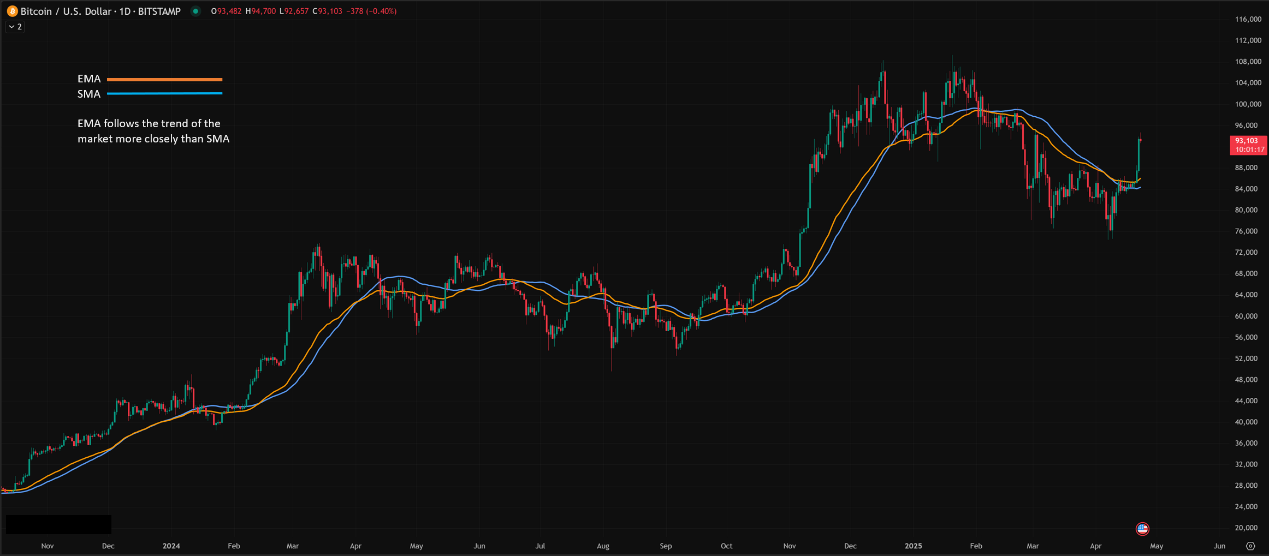
In the super volatile, 24/7 crypto battlefield, or when you’re day trading or running short-term plays, reacting slow can get you wrecked. So, EMA’s speed is its biggest asset.
EMA’s “Origin Story”: Why Does This Line Even Exist?
Think back, originally people used SMA… (Skipping some background)… To fix these pain points, especially the lag, financial analysts thought, “Hey, what happened recently is way more important! Yesterday’s price matters more than the price N days ago!” And boom, EMA was born. It uses a specific Smoothing Factor to give more importance (weight) to recent data. Older data still counts, just less and less, but never completely drops off. This lets the EMA catch market shifts faster.
How’s EMA Calculated? (Don’t sweat it, you don’t need to do this by hand, just get the idea)
EMA’s calculation is recursive, meaning today’s EMA uses yesterday’s EMA value:
EMA(today) = (Price(today) * Smoothing Factor) + (EMA(yesterday) * (1 – Smoothing Factor))
The Smoothing Factor (α) is usually calculated like this: α = 2 / (N + 1), where N is the EMA period you choose (like 9 EMA, 20 EMA).
- Key Point: Smaller N = bigger α = more weight on recent prices = faster EMA. Bigger N = smaller α = smoother EMA = slower reaction.
EMA Basics (Getting Started Zone):
- Spotting the Trend (Trend Identification):
-
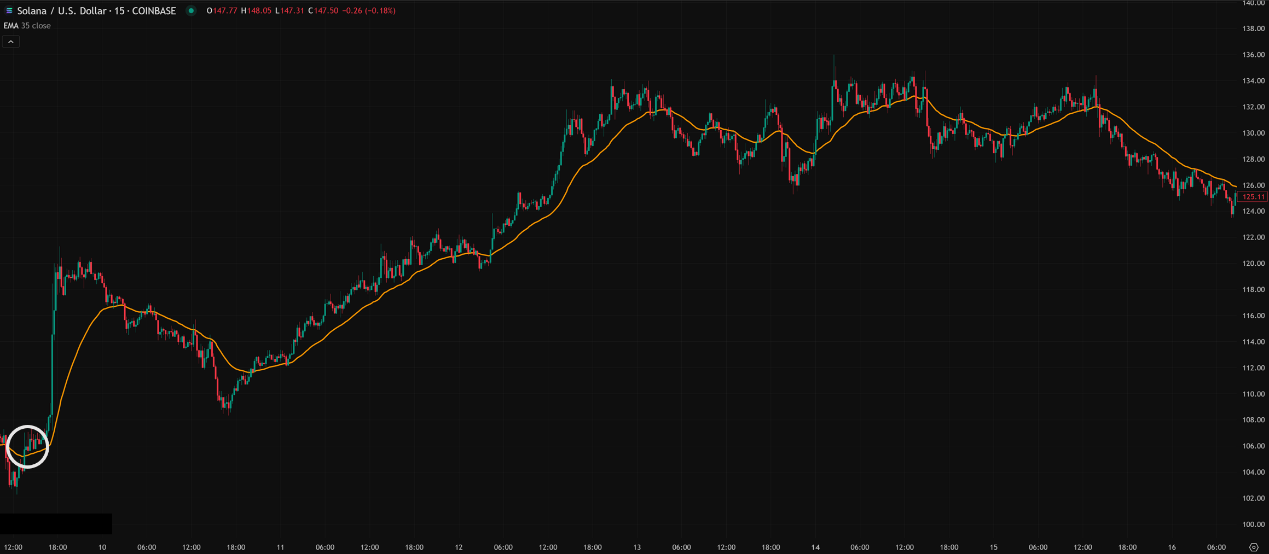
- EMA sloping up, price stays above the EMA: Usually means an uptrend.
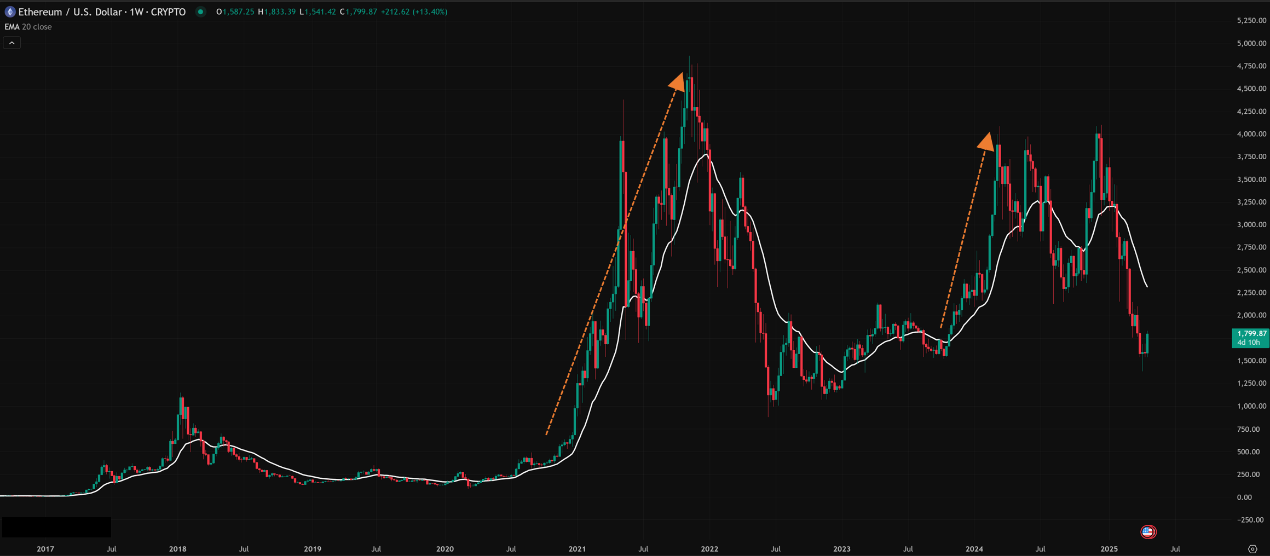
-
- EMA sloping down, price stays below the EMA: Usually means a downtrend.
-
- EMA going flat: Might be consolidation (ranging) or the trend is unclear.
- Mantra: Stays above the line, look for buys; breaks below the line, look for sells.
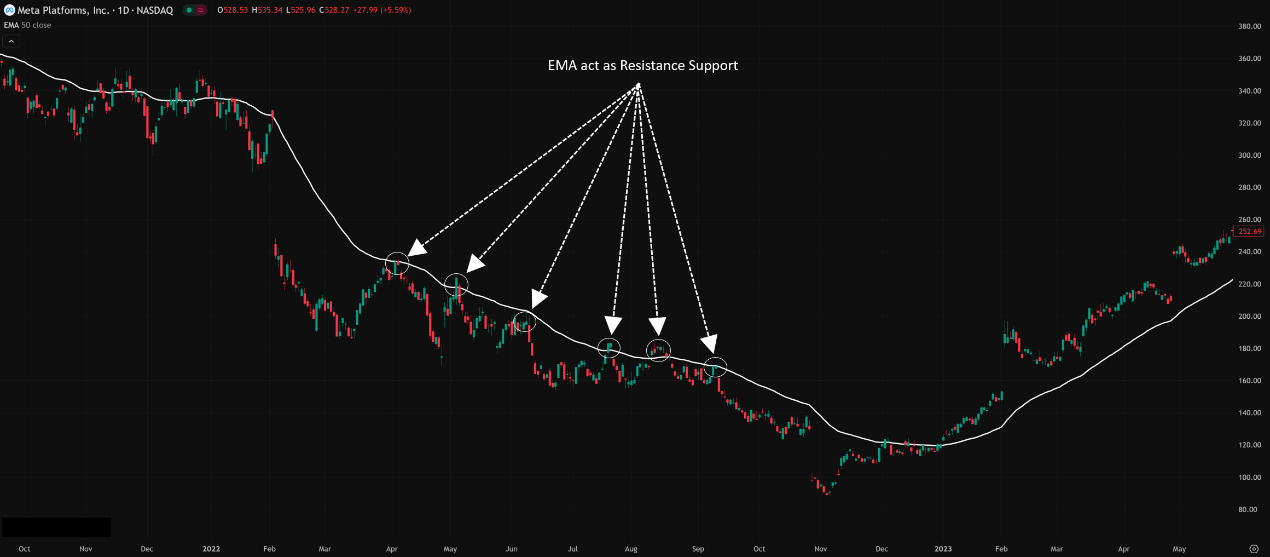
2. Dynamic Support & Resistance:
-
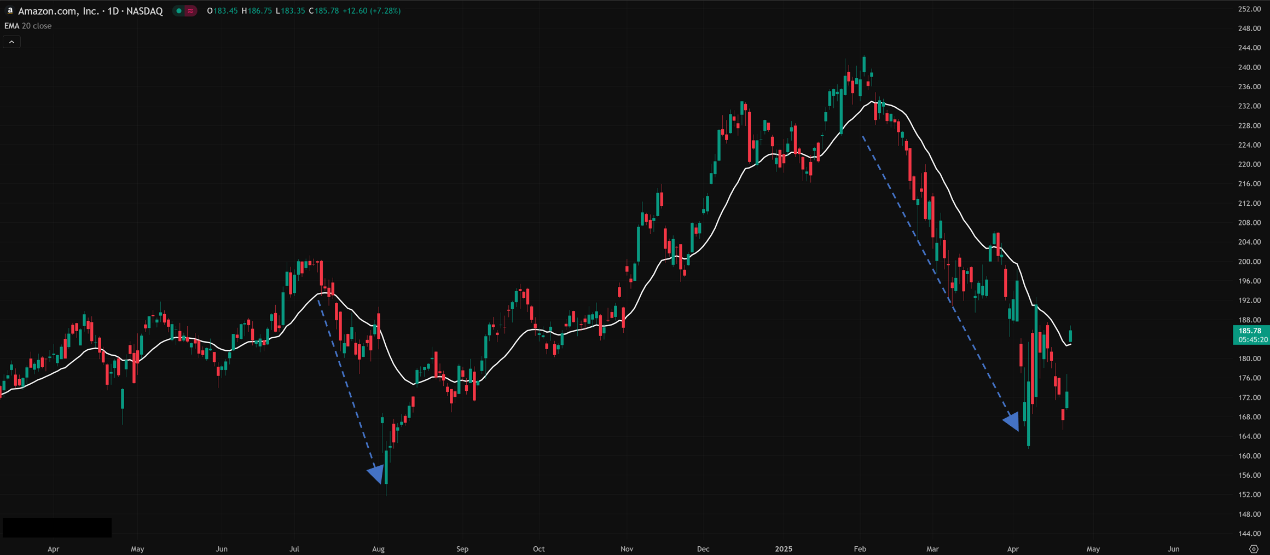
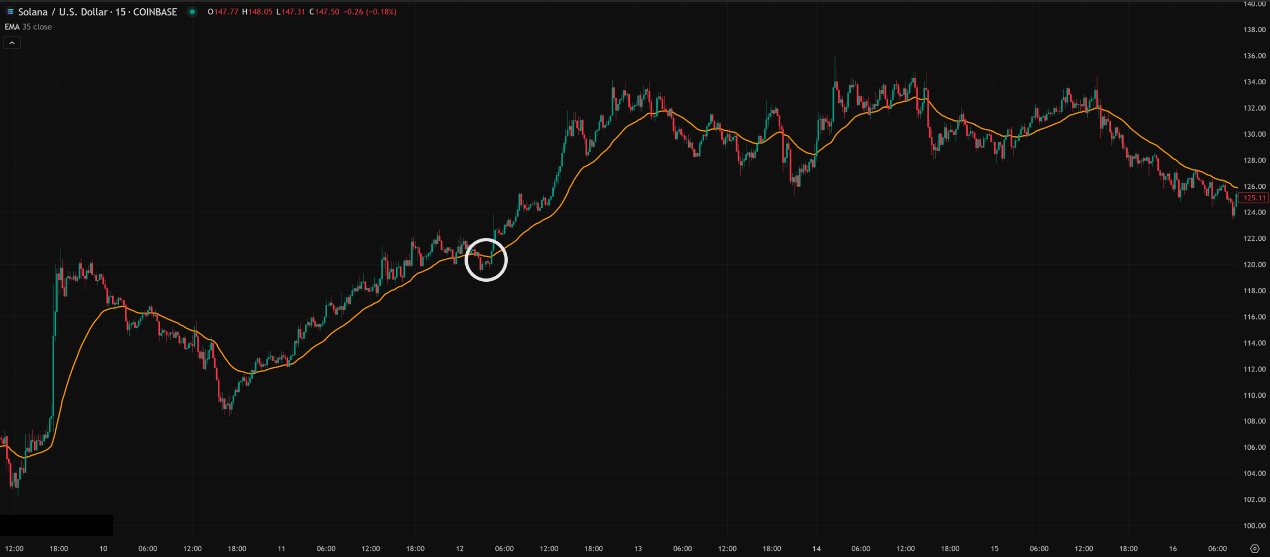
- In an uptrend, when price pulls back to the EMA, it might find support and bounce.
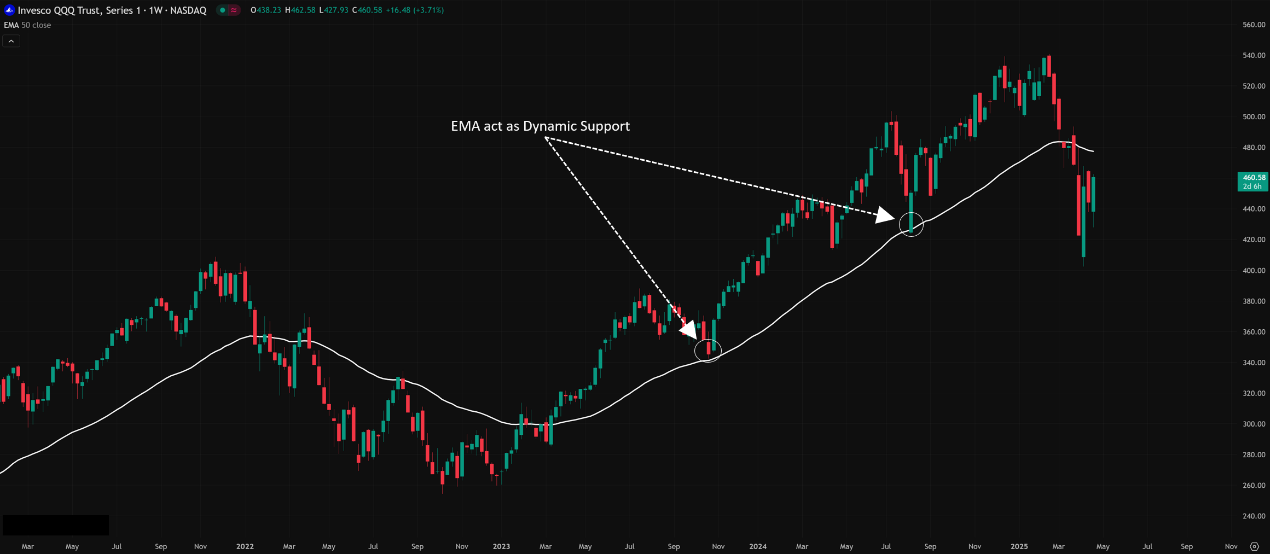
-
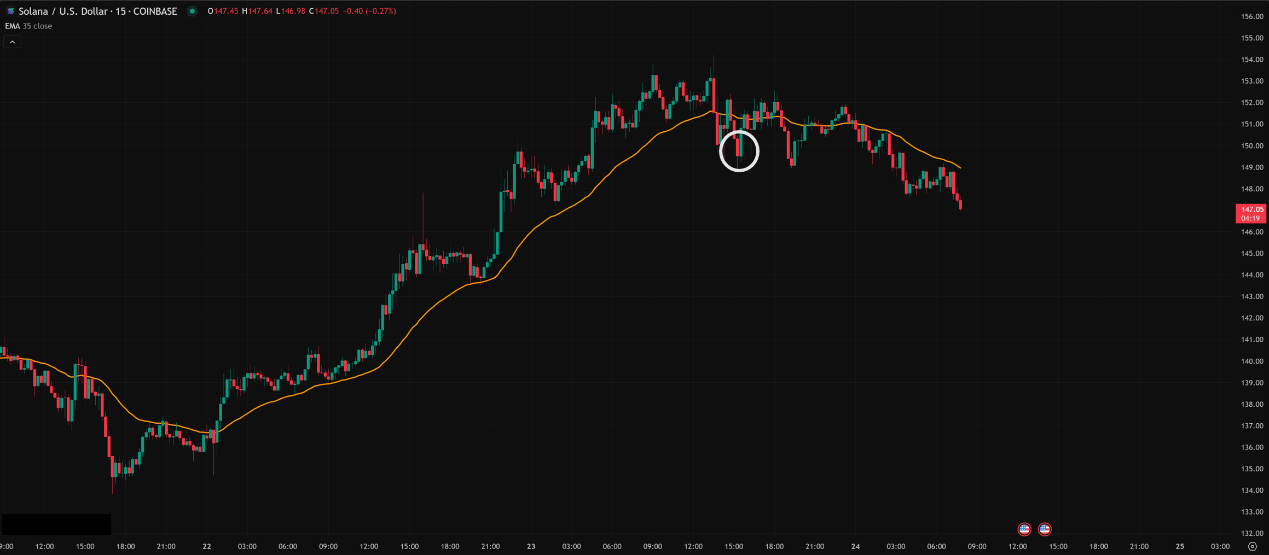
- In a downtrend, when price rallies up to the EMA, it might hit resistance and fall back.
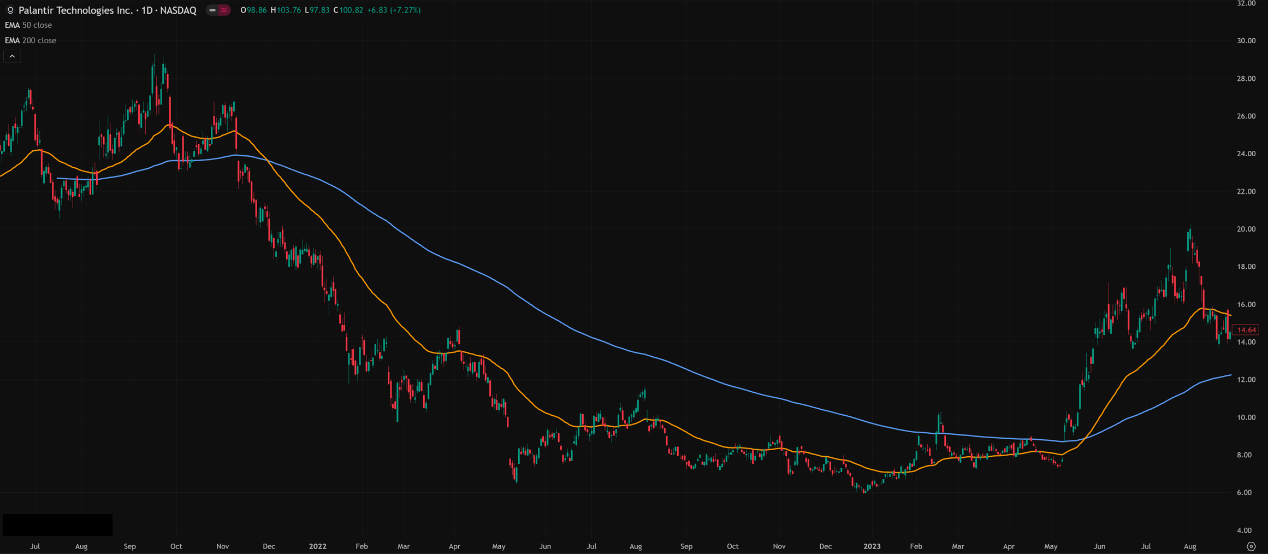
3. Golden Cross & Death Cross:
-
- Golden Cross: Short-term EMA (e.g., 50 EMA, maybe blue) crosses UP through a long-term EMA (e.g., 200 EMA, maybe red). Often seen as a signal for a potential long-term uptrend start (especially on Daily charts or higher).
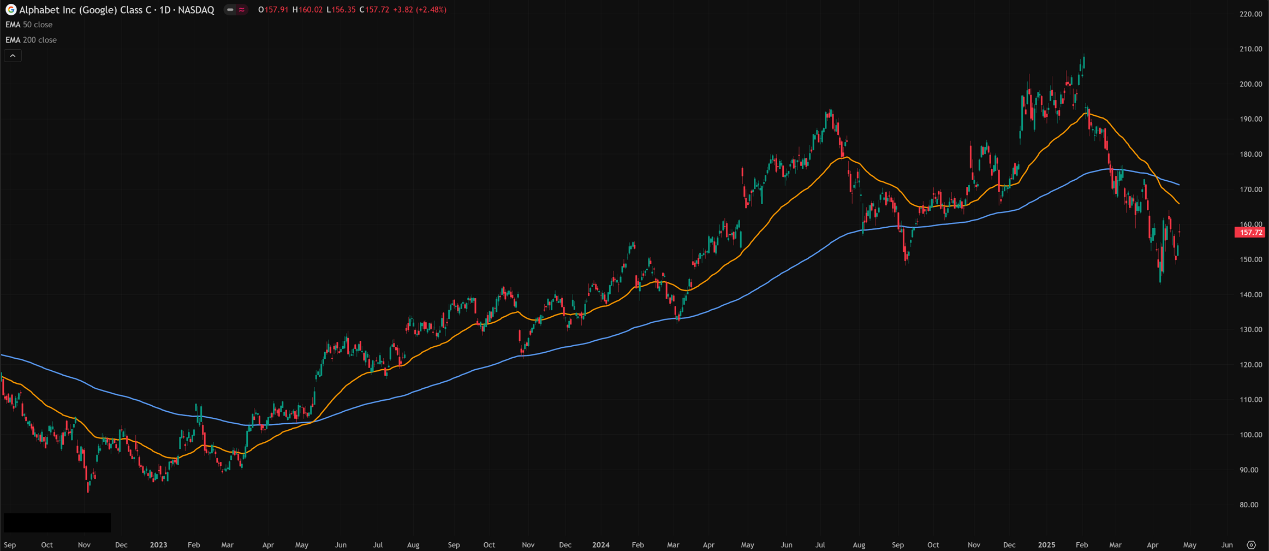
-
- Death Cross: Short-term EMA crosses DOWN through a long-term EMA. Often seen as a signal for a potential long-term downtrend start.
-
- Heads Up! These crosses lag and can give false signals (whipsaws) in choppy markets. Don’t rely on them alone! Especially in crypto, confirmation is key.
EMA Pro Moves & Granville’s 8 Rules (Expert Zone)
Granville’s 8 Rules (EMA Version):
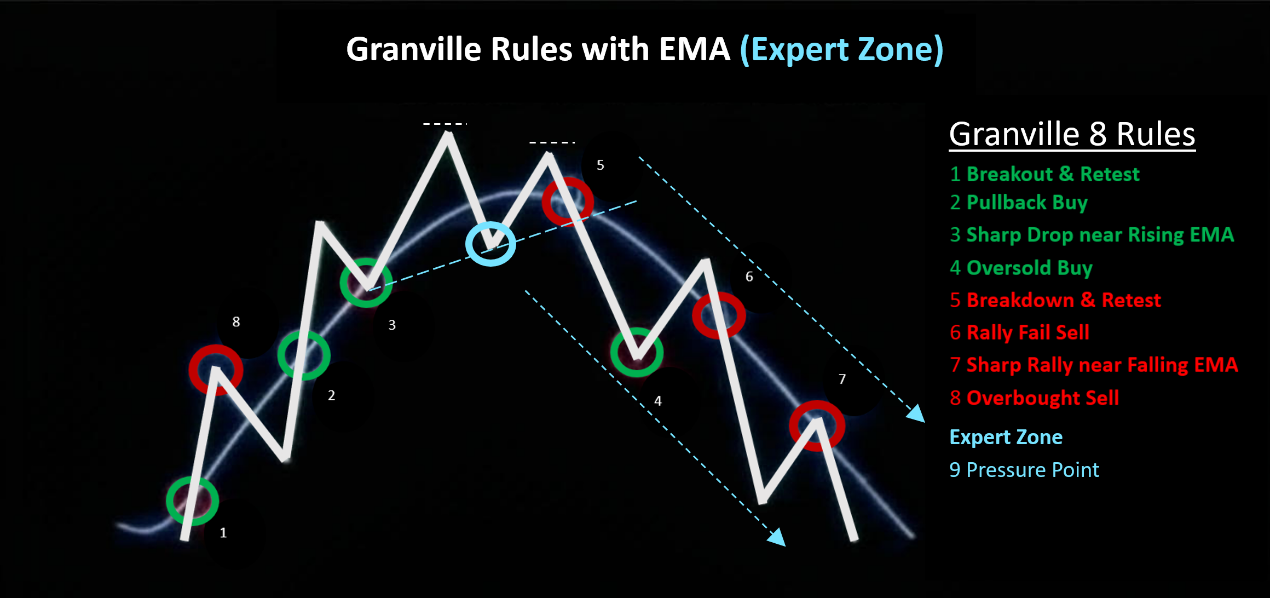
Buy Signals:
- Breakout & Retest Buy: EMA turns from down to flat or rising, and price breaks UP through the EMA. This is an early sign the trend might be reversing. Safer play: wait for price to pull back, test the EMA as support (hold above it), then consider buying.
2. Pullback Buy: EMA is clearly rising, price dips briefly below the EMA but quickly closes back above it. Shows the uptrend is strong, and the dip was a buying opportunity.
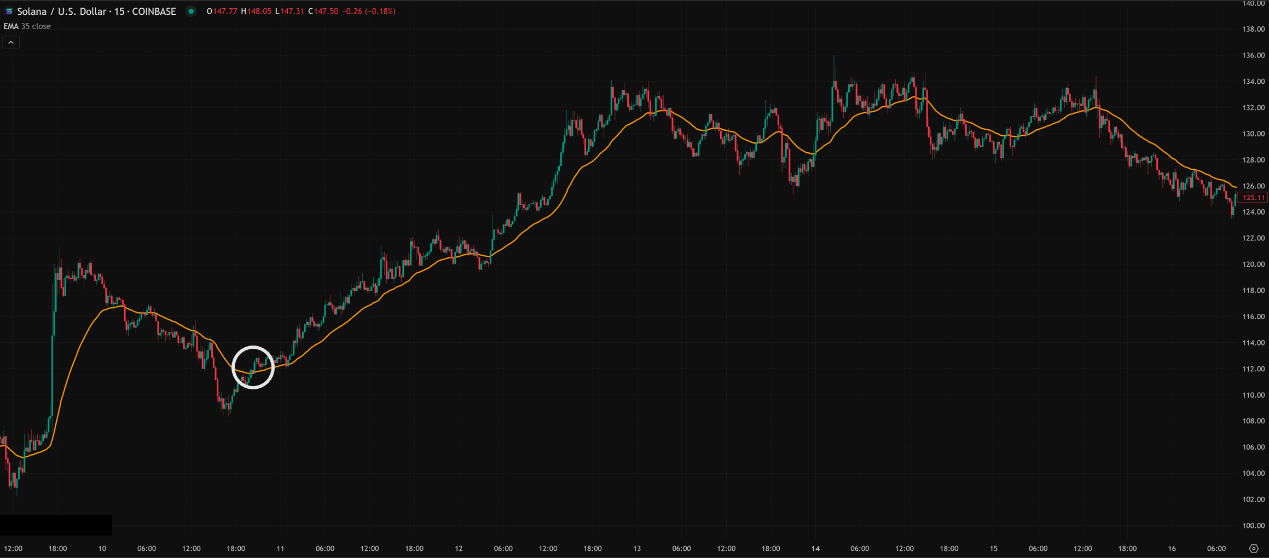
3. Sharp Drop near Rising EMA: Price is above a rising EMA, drops sharply towards the EMA but stops falling and bounces before or right at the line. Suggests strong buying interest below. (Visually similar to #2, but the drop is faster/steeper).
4. Oversold Buy (Less used with EMA alone): Price falls very fast and is now far below a falling EMA (large gap/divergence). Expect a possible technical bounce. Usually needs confirmation from other oversold indicators (like RSI). High risk.
Sell Signals:
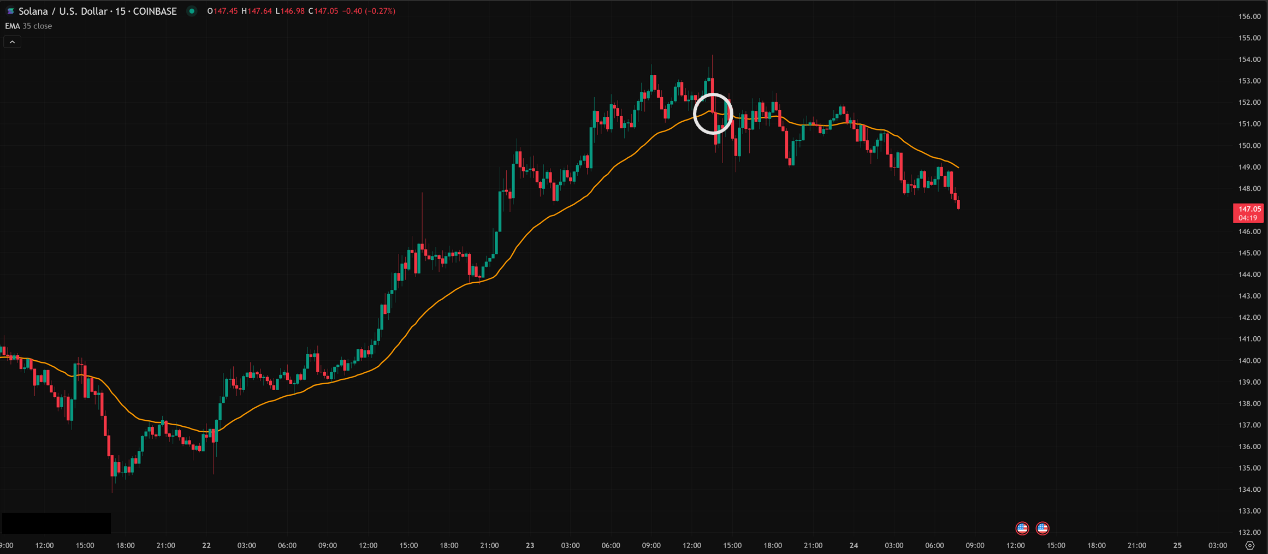
5. Breakdown & Retest Sell: EMA turns from up to flat or falling, and price breaks DOWN through the EMA. Early sign of a potential trend reversal. Consider selling/shorting after price rallies back up to the EMA and gets rejected (fails to break back above).
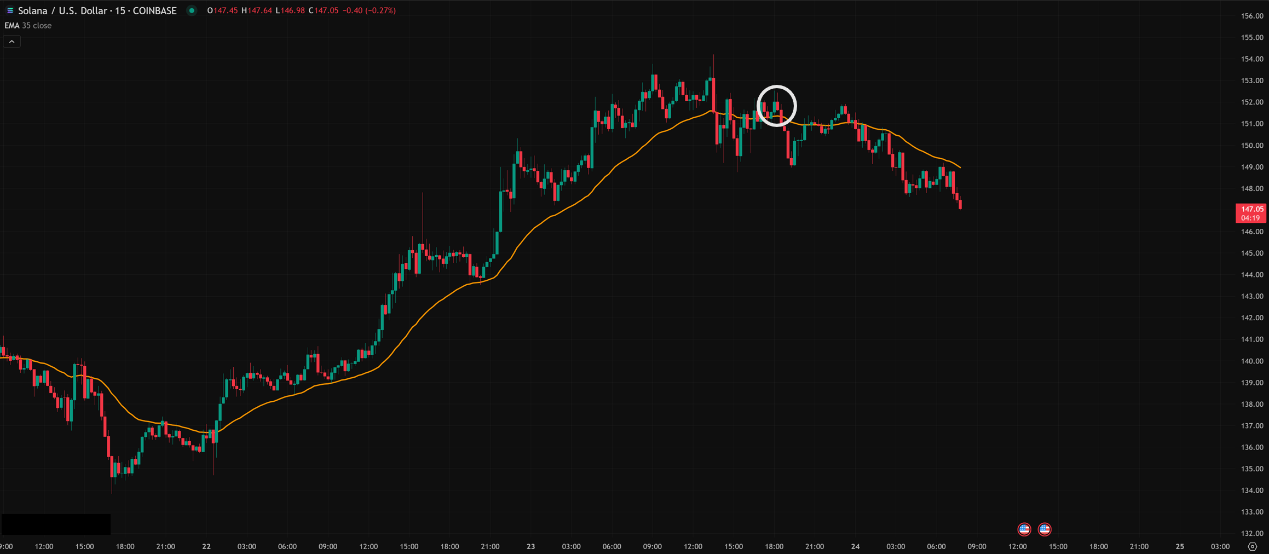
6. Rally Fail Sell: EMA is clearly falling, price briefly pops above the EMA but quickly closes back below it. Shows the downtrend is intact, and the rally was a selling/shorting opportunity.
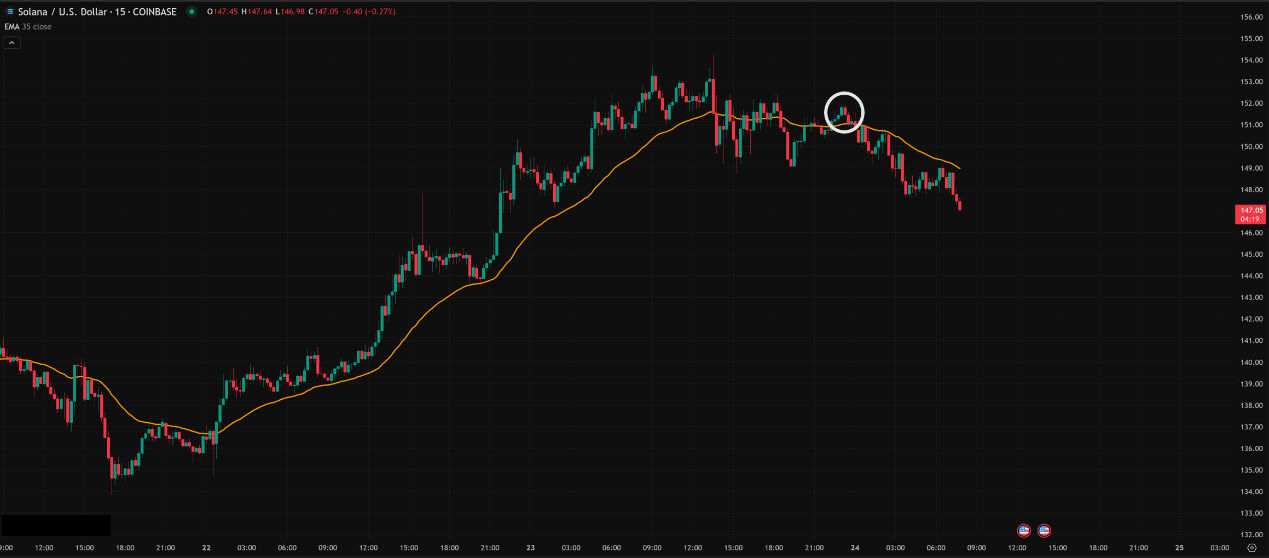
7. Sharp Rally near Falling EMA: Price is below a falling EMA, rallies sharply towards the EMA but stalls and reverses before or right at the line. Suggests heavy selling pressure above. (Visually similar to #6, but the rally is faster/steeper).
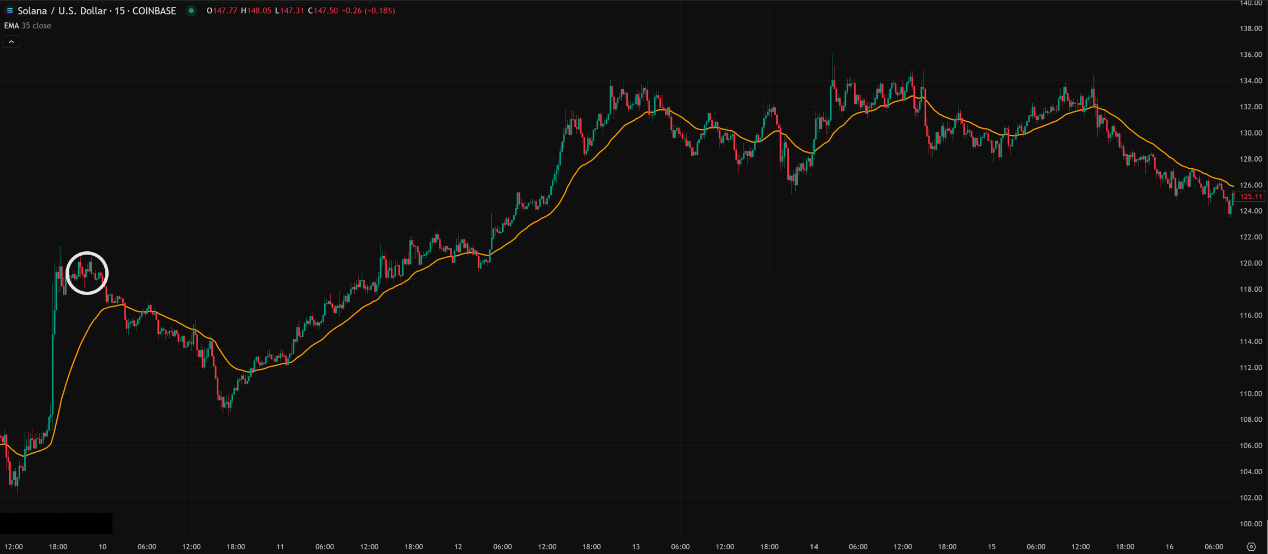
8. Overbought Sell (Less used with EMA alone): Price rises very fast and is now far above a rising EMA (large gap/divergence). Expect a possible technical pullback. Needs confirmation from other overbought indicators (like RSI).
Other Pro Techniques:
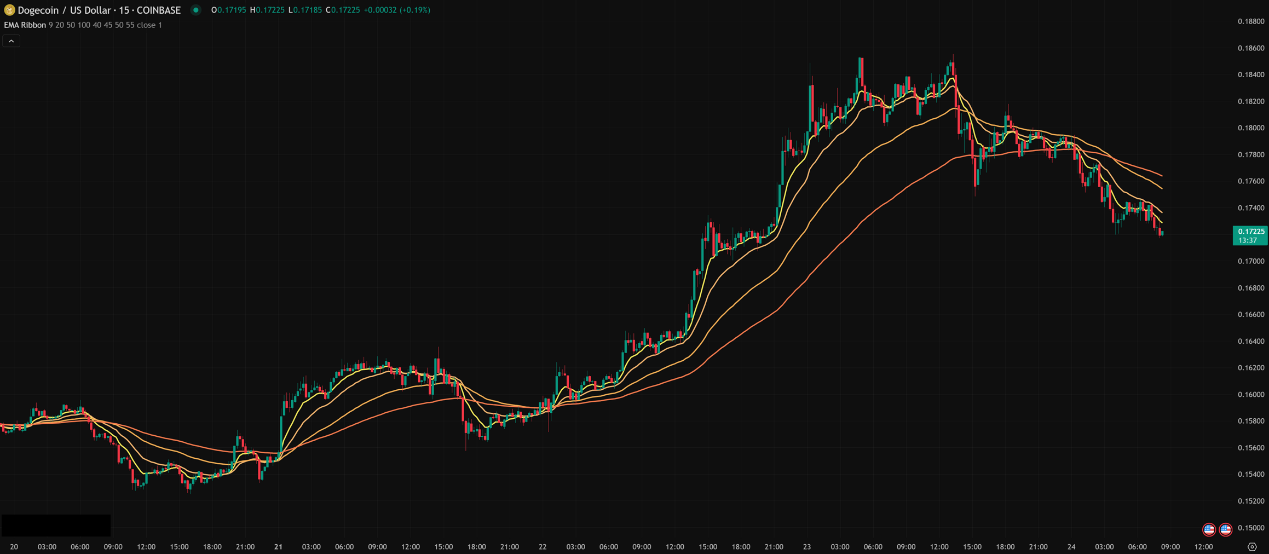
- EMA Ribbons / Clouds: Plot multiple EMAs with different periods on the same chart (e.g., 9, 13, 20, 50, 100, 200 EMA).
- When all EMAs are stacked neatly (shortest on top, longest on bottom) and fanning out upwards (“Bullish Alignment”), it’s a strong uptrend signal.
-
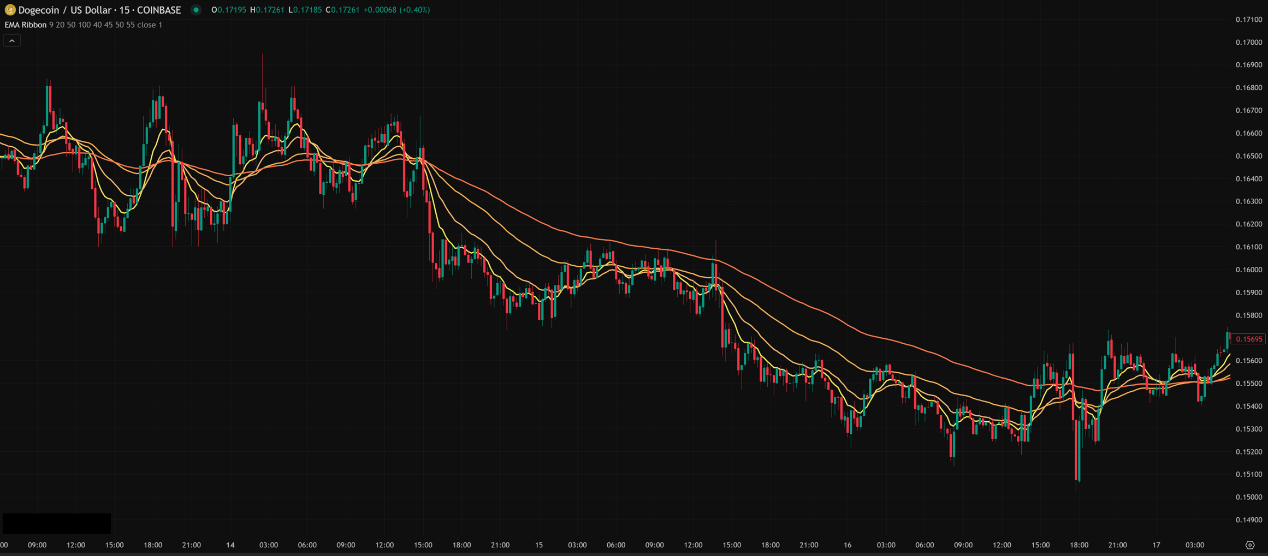
- When they’re stacked neatly downwards (shortest on bottom, longest on top) and fanning out (“Bearish Alignment”), it’s a strong downtrend signal.
-
- The space between the EMAs can act as dynamic support/resistance zones. Price entering the ribbon might mean the trend is weakening or consolidating.
- Combining with Other Indicators (Confluence): EMA isn’t magic. Combine EMA signals with other tools (e.g., Volume, RSI, MACD, Bollinger Bands) for confirmation. This seriously boosts your odds. Example: Price pulls back to a rising 20 EMA + RSI shows oversold + volume confirms the bounce = higher probability buy signal.
Parameter Settings: Defaults & The “Best” Combo?
This is the most asked question and the one with NO single right answer!
- Common/Default Parameters:
- Short-term: 9, 12, 20, 21, 26 EMA (12 & 26 are the basis for MACD defaults)
- Mid-term: 50, 55 EMA
- Long-term: 100, 200 EMA (The 200 EMA is watched by many institutional traders as a key bull/bear line)
- The So-Called “Best” Parameters:
- The Truth is: There’s NO ‘magic bullet’ or ‘one-size-fits-all’ parameter combo that works for all markets, all timeframes, all strategies!
- Why? Because market conditions (trending vs. ranging), the asset’s volatility (BTC vs. a stable blue-chip stock), your trading style (Day Trade vs. Swing Trade vs. Long-term Investing), and your chosen timeframe (1-min chart vs. Daily chart) ALL affect what works best.
- Examples:
- Short-term/Day Trading (e.g., 5-min, 15-min charts): Might use faster EMA combos like 9/21 EMA crossover, or 10/20 EMA for quick trend direction and entries/exits. Goal: Catch small moves, need speed.
- Mid-term/Swing Trading (e.g., 1-hour, 4-hour, Daily charts): Might use 20/50 EMA combo for mid-term trend and pullback entries, or 50/200 EMA for the bigger picture.
- Long-term Investing (Daily, Weekly charts): Mainly watch the 50/100/200 EMA alignment and support/resistance levels.
- How to Find Your Parameters?
1. Understand the Principle: Know that short periods = fast but noisy; long periods = smooth but slow.
2. Match Your Strategy: Are you trend-following? Counter-trend scalping? Different strategies need different EMA speeds.
3. Backtest Relentlessly! Use historical data on your chosen market/timeframe to test different EMA combos. See which performed best in the past (returns, max drawdown, win rate, etc.). Many platforms (like TradingView) have backtesting tools.
4. Keep Optimizing: Markets change. No setup works forever. Review and tweak your parameters periodically.


EMA vs. SMA: When to Use Which?
- EMA:
- Pros: Fast reaction, good for catching early trend shifts, suits volatile/fast markets (Crypto, short-term trading).
- Cons: Prone to false signals (whipsaws), especially in choppy/ranging markets.
- Best Use: Short-term trading, early trend entry, strategies needing quick signals.
- SMA:
- Pros: Smoother, less noise, better reflects long-term average price/trend, provides more stable S/R in clear trends.
- Cons: Significant lag, might miss optimal entry/exit points.
- Best Use: Long-term investing, identifying major trends, less volatile markets, strategies filtering out short-term noise.
Bottom Line: EMA is Your Accelerator, But It’s Not Autopilot!
EMA is definitely a powerful tool, especially for us younger folks active in crypto and always watching the markets. Its speed can help you catch the market’s pulse faster.
But remember:
- No Holy Grail: EMA isn’t 100% accurate. It will give false signals.
- Don’t Use It Alone: ALWAYS combine it with other indicators, chart patterns, volume, maybe even fundamental analysis (Confluence is King!).
- Parameters Aren’t Absolute: The “best” is relative. You need to test and find what fits YOUR style and market.
- Risk Management is KING: No matter the indicator, Stop Losses and Position Sizing are ALWAYS the most crucial things!
Hope this deep dive into EMA helps you out! Now, open your TradingView / trading platform, add those EMAs to your charts, and start observing, experimenting, and backtesting! Only through practice can you turn this knowledge into a real edge in the market!
Next Steps:
- Add the 9, 20, 50, and 200 EMAs to your favorite charts.
- Watch how price interacts with the different EMA lines.
- Find recent Golden Crosses and Death Crosses and see what happened next.
- Try analyzing recent price action using Granville’s rules.
- Most importantly: Keep Learning, Keep Testing, Keep Trading Smart!
Wish you all successful trading, catch every wave! Peace! 🚀🌕