Physical Address
304 North Cardinal St.
Dorchester Center, MA 02124
Physical Address
304 North Cardinal St.
Dorchester Center, MA 02124
What’s Gucci, Trendsetters and Crypto Mavericks! Time again to unlock another level in the technical analysis masterclass! Today we’re tackling a tool that’s pretty much “god-tier” in the TA world. Whether you’re trading crypto, forex, stocks, or whatever else, you’ve definitely seen this bad boy around – it’s the one and only Fibonacci Retracements! ✨
Don’t let the mathematician’s name scare you off! No complex calculations needed here, but learning to use this tool is like getting a market “treasure map” or “gravity map.” It helps predict where price pullbacks might stall and highlights potential sweet spots for getting in or out! The magic? These levels are mysteriously linked to nature’s secret code – the Fibonacci sequence!
Wanna know how to draw this widely used tool? How to use it to find support/resistance? How to combine it with other indicators for higher probability trades? Which Fibo levels are the real MVPs? Okay! Let’s dive deep, from origin to execution, and fully master the essential Fibonacci Retracement tool! Let’s retrace the steps to profit!
Why is this indicator so famous? Where did the name come from?
The Man: Leonardo Fibonacci – Yep, named after a brilliant 13th-century Italian mathematician, Leonardo Bonacci (aka Fibonacci). He wasn’t a trader, but while studying rabbit breeding (seriously!), he introduced a fascinating number sequence: 0, 1, 1, 2, 3, 5, 8, 13, 21, 34… (each number is the sum of the two preceding ones). This is the Fibonacci Sequence.
The Magic Ratio: The Golden Ratio (Phi / φ) – The cool part about this sequence is that as the numbers get larger, the ratio of a number to the next one approaches approximately 0.618, and the ratio of a number to the previous one approaches 1.618. This 1.618 / 0.618 is the legendary Golden Ratio, found everywhere in nature, art, and architecture (think seashell spirals, sunflower seeds, the Mona Lisa’s proportions).
How Did It Get Into Trading? – Why did math make its way into financial markets?
Observers of Natural Laws: Early market theorists like R.N. Elliott (founder of Elliott Wave Theory) and W.D. Gann believed market movements weren’t totally random but followed certain natural laws and proportions. They noticed that market price retracements and extensions often coincided with Fibonacci ratios (like 0.382, 0.500, 0.618).
Market Psychology & Self-Fulfilling Prophecy: Because so many traders use Fibonacci Retracements to identify potential S/R levels and place orders there, when price approaches these levels, a large volume of orders gets triggered, actually causing these levels to act as effective S/R. It’s like everyone using the same map – people naturally stop at the same key intersections.
So, the application of Fibonacci Retracements stems from observing natural ratios, combined with the powerful effect of collective market psychology, making it a very popular and practical tool in technical analysis.
This is crucial! Fibo Retracements aren’t like RSI or MACD, which are calculated indicator lines. It’s an analysis tool that YOU need to draw manually on your chart!
Step One: Identify a Significant Swing
First, you need to find a clear, major price swing (an uptrend or downtrend leg) on your chart. This swing needs a distinct starting point and ending point.
Uptrend Swing: Starts at a clear Swing Low and ends at a clear Swing High.
Downtrend Swing: Starts at a clear Swing High and ends at a clear Swing Low.
Choosing the right swing is KEY to using Fibo effectively! (More on this later).
Step Two: Use the Fibo Retracement Tool
Virtually all charting platforms have a built-in Fibonacci Retracement tool.
How to Draw:
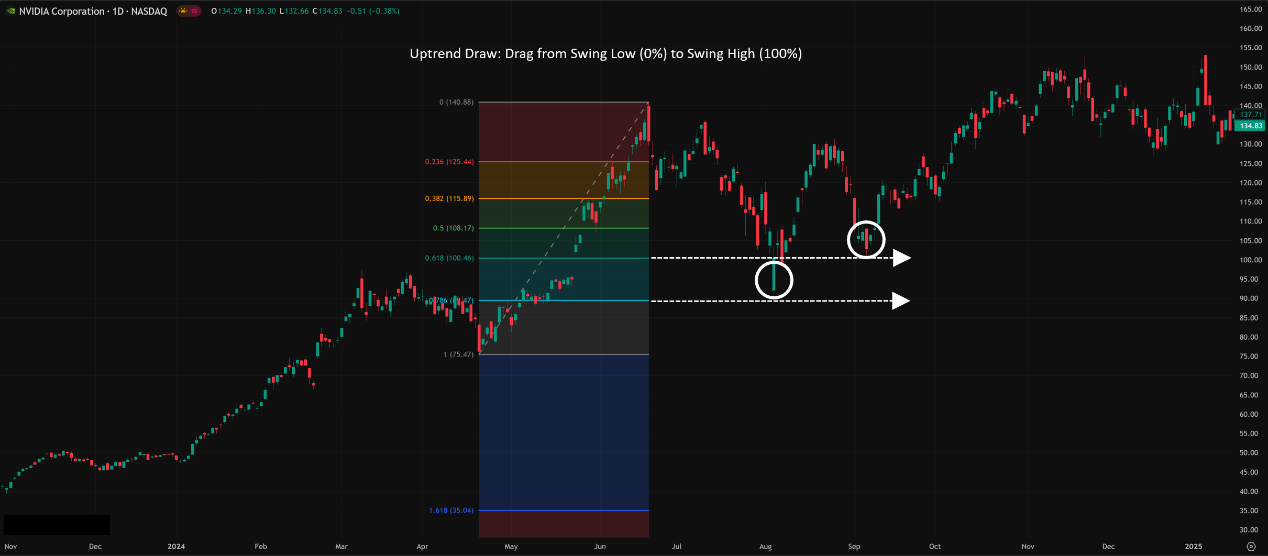
For an Uptrend: Click and drag the tool from the starting Swing Low (0%) up to the ending Swing High (100%).
For a Downtrend: Click and drag the tool from the starting Swing High (100%) down to the ending Swing Low (0%).
(Note: Some platforms might have slightly different drawing mechanics, but the principle of anchoring the 0% and 100% levels correctly is the same).
Step Three: Automatic Ratio Levels Appear
Once you’ve drawn the line connecting the start and end points (defining the 0% to 100% range of the swing), the tool automatically draws several horizontal lines in between. These lines represent the key Fibonacci Retracement levels.
The Core Retracement Levels (Default Levels):
23.6% (0.236)
38.2% (0.382)
50.0% (0.500) – Technically not derived directly from the Fibonacci sequence ratios, but included because a 50% pullback is a hugely important psychological level.
61.8% (0.618) – The Golden Ratio! One of the most watched levels.
Other Commonly Used Levels:
78.6% (0.786) – Square root of 0.618, sometimes seen as a deeper retracement level.
(Some platforms might include 76.4%, which is 1 – 0.236).
0% and 100%: Represent the start and end points of the swing you selected.
Core Concept: The theory behind Fibonacci Retracements is that after a primary trend move (up or down), the price usually doesn’t continue in a straight line. It experiences a Retracement (pullback in an uptrend) or a Bounce (rally in a downtrend). These counter-trend moves often find support or resistance near key Fibonacci ratio levels before potentially resuming the original major trend.
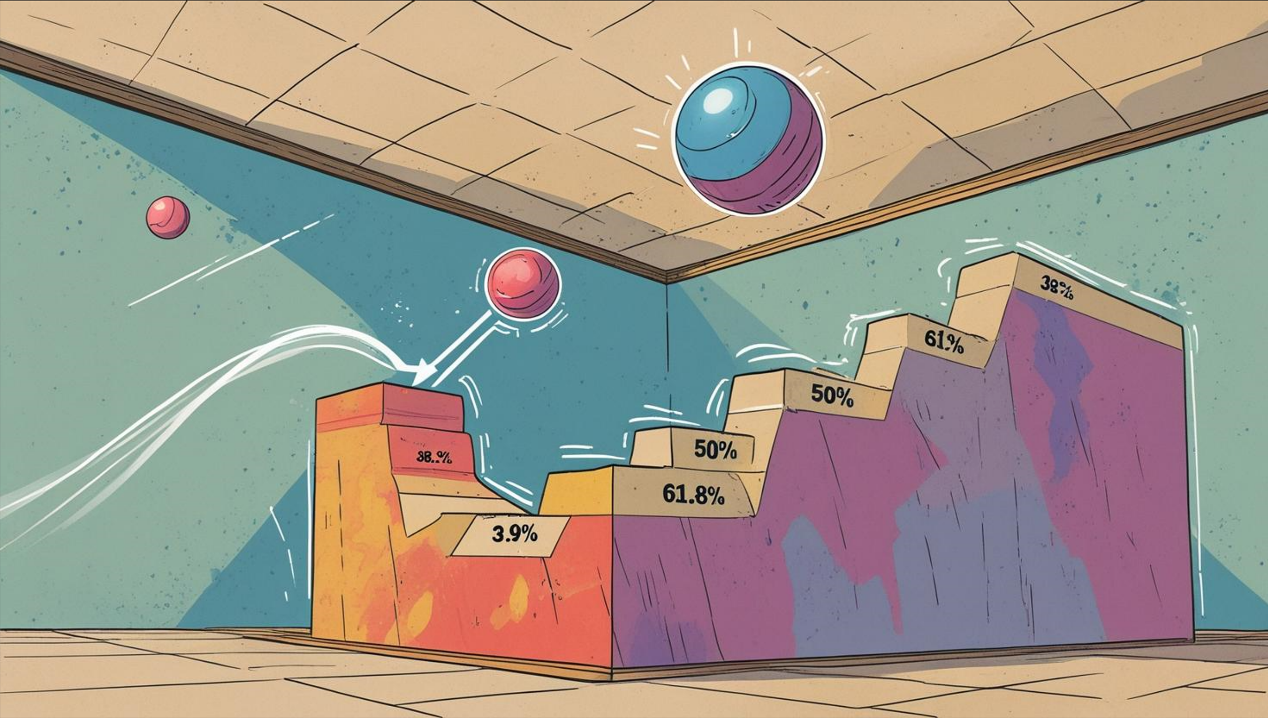
Think of a Bouncing Ball:
You throw a ball from the floor up to the ceiling (an uptrend).
After hitting the ceiling, it falls back down (retracement).
It usually won’t fall straight back to the floor (0%). It will likely bounce off an intermediate level (like 38.2%, 50%, or 61.8% of the total height) before deciding its next move. Fibonacci helps predict these potential “bounce points.”
「How to Draw Fibonacci Retracements (Uptrend)」
Level 1: Basic Usage – Identifying Potential S/R
The most fundamental use of Fibo Retracements is finding potential Support/Resistance zones:
Support in an Uptrend:
After an uptrend, when price starts pulling back, the Fibo levels (23.6%, 38.2%, 50%, 61.8%, 78.6%) become potential support zones.
Watch for price to stall at these levels and look for bullish reversal candlestick patterns (like Hammers, Bullish Engulfing) or other buy signals. This could be a good opportunity to enter with the trend.
Resistance in a Downtrend:
After a downtrend, when price starts bouncing, the Fibo levels become potential resistance zones.
Watch for price to stall at these levels and look for bearish reversal candlestick patterns (like Shooting Stars, Bearish Engulfing) or other sell signals. This could be a good opportunity to enter short with the trend.
Focus on Key Levels:
38.2%: A relatively shallow retracement. If price reverses here, it might indicate the original trend is very strong.
50%: The halfway point, a critical psychological level.
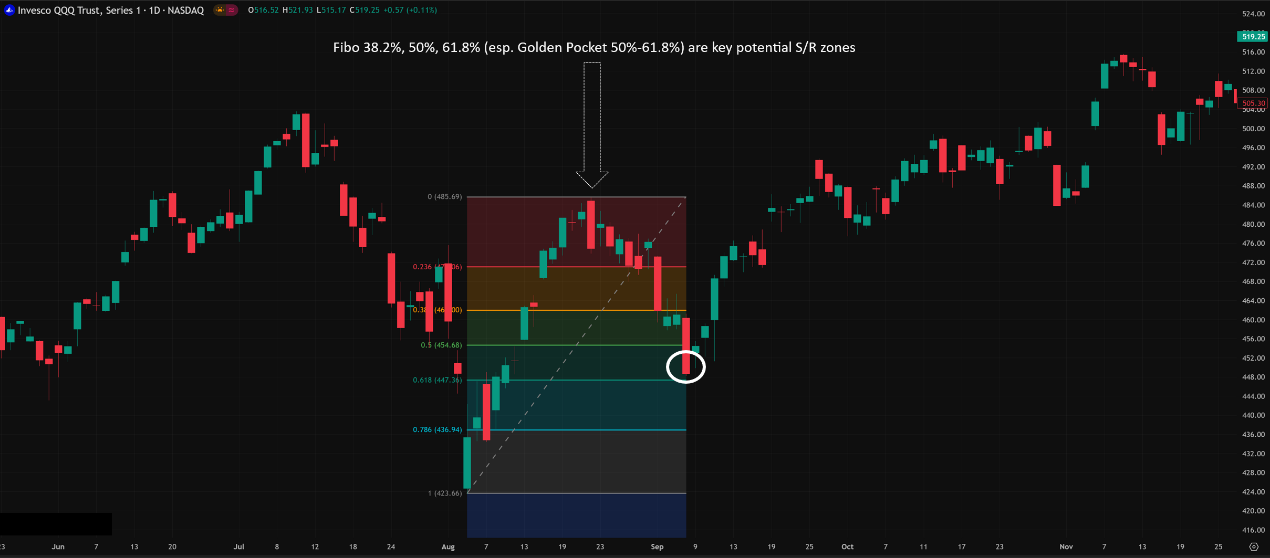
61.8% (Golden Ratio): One of the most closely watched levels! A reversal near this level is often considered a strong signal. The zone between 38.2% and 61.8% (especially 50%-61.8%) is often called the “Golden Pocket.”
23.6%: Often too shallow, might just be noise, generally less reliable as a major reversal point.
78.6%: A deep retracement. If price breaks through this level, the validity of the original trend might be questionable; a reversal could be underway.
「Fibonacci Levels as S/R Example (Golden Pocket)」
Level 2: Advanced Plays – Confluence, Extensions & Strategy Integration
Mastered the basics? Let’s get pro!
A. “Parameters” & Timeframes? It’s HOW You Draw!
Fibo Itself Has No Parameters: The ratios (23.6%, 38.2%, etc.) are fixed. You don’t set them.
The Real “Parameter”/Variable: Which Swing Low & Swing High Do You Choose?
Drawing on different swings results in completely different Fibo levels!
Short-Term Traders: Might draw Fibos on recent minor swings (few hours/days) to find intraday or short-term S/R.
Swing/Long-Term Traders: Might draw Fibos on major primary swings (weeks, months, even years) to find significant long-term retracement levels.
Execution: There’s no single “right” way. It depends entirely on your trading style, timeframe, and analytical goal.
Timeframe Impact:
Fibo Retracements work on all timeframes, from M1 to Monthly.
BUT! Generally, Fibo levels drawn on higher timeframes (like Daily, Weekly) using major swings are considered more significant and reliable. They represent a consensus formed over longer periods and by more participants.
Shorter timeframe Fibo levels might only provide temporary S/R.
B. Confluence – The Secret Weapon for High Probability!
This is the most crucial advanced technique! A single Fibo level has limited reliability, but when a Fibo level overlaps (confluences) with other technical S/R indicators, its significance increases dramatically!
Common Confluence Examples:
Fibo + Horizontal S/R: A Fibo level lines up perfectly with a previous major high or low.
Fibo + Moving Average (MA): A Fibo level coincides with a key MA (e.g., 50 EMA, 200 SMA).
Fibo + Trendline: A Fibo level touches an ascending or descending trendline.
Fibo + Pivot Points: A Fibo level matches a daily or weekly Pivot Point.
Fibo + Volume Profile (VPFR/VPSV) Level: A Fibo level hits a POC, VAH, VAL, or significant HVN.
Multiple Fibo Confluence: Different Fibo levels drawn from different swings happen to overlap near the same price!
How to Use: Actively look for these Confluence Zones. The probability of a reversal signal being valid is much higher when price reaches a confluence area!
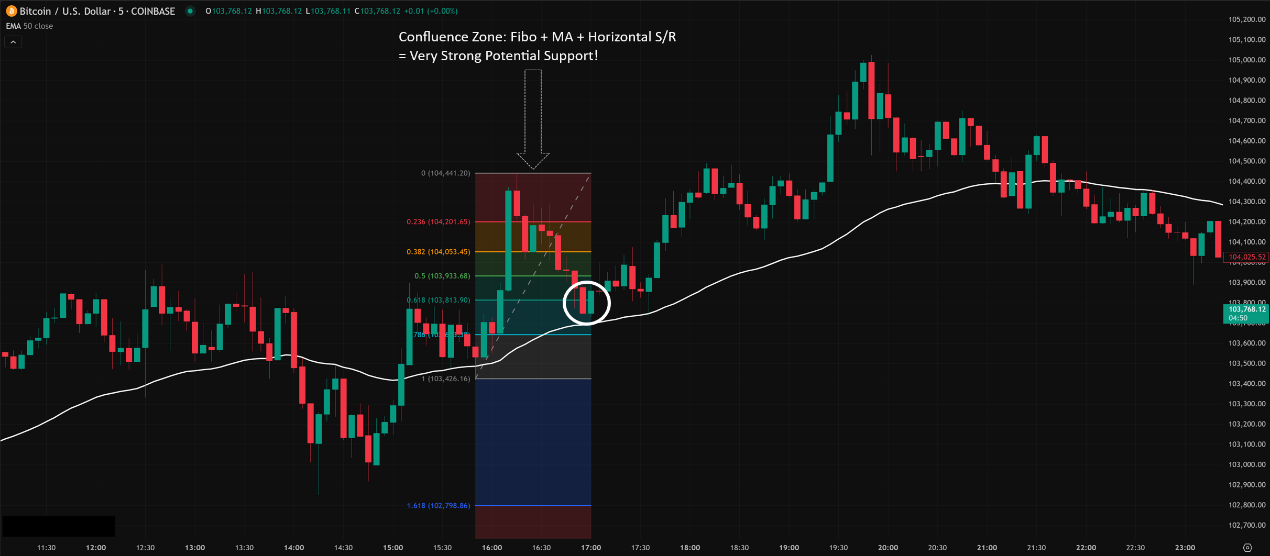
「Fibo Confluence Example (Fibo + MA + Horizontal S/R)」
C. Fibonacci Extensions: Finding Profit Targets
Concept: Retracements look for pullback levels; Extensions project where price might go after breaking the original swing high/low.
Common Extension Levels: 127.2% (1.272), 161.8% (1.618 – Golden Extension!), 261.8% (2.618), 423.6% (4.236), etc. These are multiples of the original swing’s length.
How to Draw: Usually involves three points (e.g., Swing Low -> Swing High -> Retracement Low to project uptrend targets).
How to Use: When price successfully resumes the original trend from a retracement level and breaks beyond the 100% level, Extensions can be used to set potential Profit Targets.
Note: Today’s focus is Retracements, Extensions are another topic, but be aware they exist.
D. Which Combos Are “Hot” & Effective? (Effective Fibo Setups)
There’s no single “hottest,” but here are effective frameworks:
Core Setup 1: Key Fibo Level + Candlestick Reversal Signal + Confluence Confirmation
Execution: Wait for price to retrace to a key Fibo level (esp. 38.2-61.8), ideally one with other S/R confluence. Then, wait for a clear reversal candlestick pattern to form before entering.
Example: Price falls to 61.8% Fibo + 200 SMA confluence, forms a Bullish Engulfing -> Consider long entry.
Core Setup 2: Multi-Timeframe (MTF) Fibo Analysis
Execution:
Draw Fibo Retracements on the Weekly/Daily chart for the major trend to identify long-term key support zones.
Switch to H4/H1 chart and draw Fibo Retracements on the shorter-term pullback swing.
If a short-term Fibo support level falls within a long-term Fibo support zone, this confluence offers very strong support.
Effectiveness: High timeframe sets direction and key zones, low timeframe provides precise entry timing.
Core Setup 3: Fibo as Stop Loss / Take Profit Reference
Stop Loss: Place stops just below (for longs) or above (for shorts) a key Fibo level, giving some buffer. E.g., Enter at 61.8% support, consider stop below 78.6%.
Take Profit: Besides Extensions, you can use opposing Fibo levels as targets. E.g., Buy at a 50% retracement in an uptrend, first target might be the 23.6% level or even the 0% level (previous high).
E. Default Parameters & Best Parameter Combos? (The Levels That Matter)
Default Levels: Platforms usually include 0%, 23.6%, 38.2%, 50%, 61.8%, 100%. Some add 78.6%. These are generally sufficient.
Best Level Combo?
No absolute “best.” But the most watched levels by the market are: 38.2%, 50%, 61.8%. These three are the core.
61.8% (Golden Ratio) holds special significance for many traders.
“Best” is relative: In some markets or strong trends, a 38.2% retracement might be enough; other times, price might need to pull back to 78.6%.
The focus isn’t which level is “best,” but which level gets confirmed by confluence and price action!
Conclusion: Don’t obsess over adding/removing Fibo levels. Master the use of the default core levels, focusing on confluence and price confirmation.
Fibonacci Retracements are a powerful analytical tool based on natural mathematical ratios applied to market movements. They aren’t a crystal ball, but they provide a high-probability framework for anticipating where trend retracements/bounces might find support or resistance.
They help you:
Identify potential high-probability S/R zones.
Find potential entry points for trading with the trend.
Set more logical reference points for stops and targets.
Understand the market’s natural rhythm of pullbacks.
Dramatically increase analysis accuracy through Confluence.
For young traders wanting to grasp the market’s pulse and improve trading precision, mastering the drawing and interpretation of Fibonacci Retracements is an absolutely essential skill in your TA arsenal!
Remember:
Fibos are drawn, selecting the right swing is key.
38.2%, 50%, 61.8% are core levels; watch the Golden Pocket.
Confluence is KING!
MUST wait for Price Action Confirmation!
Works on all markets, all timeframes (but higher TFs are more significant).
Alright! Hope this deep dive into Fibo helps you out! Go open your charts, find some clear trend swings, draw those Fibs yourself, and start feeling the power of these magic numbers! See ya next time! May the ratios be with you!