Physical Address
304 North Cardinal St.
Dorchester Center, MA 02124
Physical Address
304 North Cardinal St.
Dorchester Center, MA 02124
Okay! What’s good, Chart Jedis and Market Voyagers! Time for another level-up in our TA journey! Today, we’re tackling one of the most mysterious, complex, controversial, yet revered theoretical systems in technical analysis – yeah, we’re talking about Gann Theory, and its associated tools like Gann Angles (Gann Fans) and the Gann Square of 9! ✨ ️
Yo! Heard the name and already feeling the mystical vibes? Right on! W.D. Gann, the legend himself, and his theories often intertwine geometry, numerology, and even astronomy! Unlike typical indicators giving straightforward buy/sell signals, Gann Theory attempts to use geometric angles, time cycles, and numerical relationships on the chart to forecast future market turning points (in both time and price)! It’s like trying to find the hidden “cosmic order” or “mathematical blueprint” behind market movements!
Wanna know how this once-in-a-century figure viewed the markets? How to draw and use the common Gann Angles? Peek into the mysterious Square of 9? Understand why his theories are so challenging yet studied by so many? Okay! Brace yourselves as we venture into the enigmatic realm of Gann Theory! Let’s explore the geometry of time and price!

Everything about Gann Theory revolves around its founder – a highly controversial and legendary figure.
The Founder: William Delbert Gann (W.D. Gann) – He was an incredibly famous (and prolific) market theorist, trader, and author in the early 20th century. Born in rural Texas, reportedly without much formal higher education, he made a name for himself on Wall Street through his intellect and hard work.
Astonishing Forecasts (Legend?): Many legends surround Gann, the most famous being his purported ability to predict market tops and bottoms with uncanny accuracy in both price and time. Some reports even claimed his trading success rate was over 90%! (Of course, many of these claims are hard to verify and have a mythical quality.)
Theoretical Foundation: Geometric Relationship Between Time & Price – Gann’s core idea was revolutionary: Time equals Price, and Price equals Time. He believed time units and price units could be interchanged and balanced through specific proportional relationships. He asserted that market movements follow certain “Natural Laws,” which could be described and predicted using geometry, mathematics (especially squaring numbers), and (most controversially) astronomical cycles.
Prolific but Obscure Writings: Gann wrote numerous books and courses, like Truth of the Stock Tape, Wall Street Stock Selector, and 45 Years in Wall Street. However, many find his writing style cryptic, with key predictive methods often hinted at rather than explicitly stated. Some even believe he deliberately kept his core secrets hidden. This makes learning and applying Gann Theory challenging.
Purpose: Forecasting Market Turning Points – Unlike many indicators designed to “follow” trends, Gann Theory’s primary goal is to attempt to forecast future key turning points in the market, pinpointing when and at what price significant changes might occur.
So, Gann Theory is a complex system developed by W.D. Gann based on his understanding of markets, geometry, numerology (and possibly esoteric studies), attempting to predict market turning points in time and price. Its accuracy and verifiability remain highly debated, but the tools and concepts he introduced still influence technical analysis today.
To grasp Gann’s tools, you need to get his fundamental ideas:
Time = Price, Price = Time: The absolute core! Gann believed time units and price units could be equated and balanced through specific ratios. E.g., a market rally of 100 points might require 100 days, weeks, or months to achieve balance.
Importance of Geometric Angles: Gann believed trends ascend and descend following specific geometric angles. He felt certain angles represented perfect balance or specific levels of support/resistance strength.
Squaring of Numbers: Gann placed immense importance on squares and square roots. He believed significant support/resistance levels often occurred at prices related to the square root of important highs/lows, or related to the square root of time cycles. (This is fundamental to the Square of 9).
Cyclicality: Gann believed markets move in cycles of various lengths, such as 90 days, 144 days (12×12), 1 year, 10 years, even longer 60-year cycles, etc. He watched these time points for potential turns.
The Three Pillars: Price, Time, Pattern: Complete Gann analysis requires considering all three aspects simultaneously.
Based on these principles, Gann developed many analytical tools. The most common are:
【Gann Angles / Gann Fan】
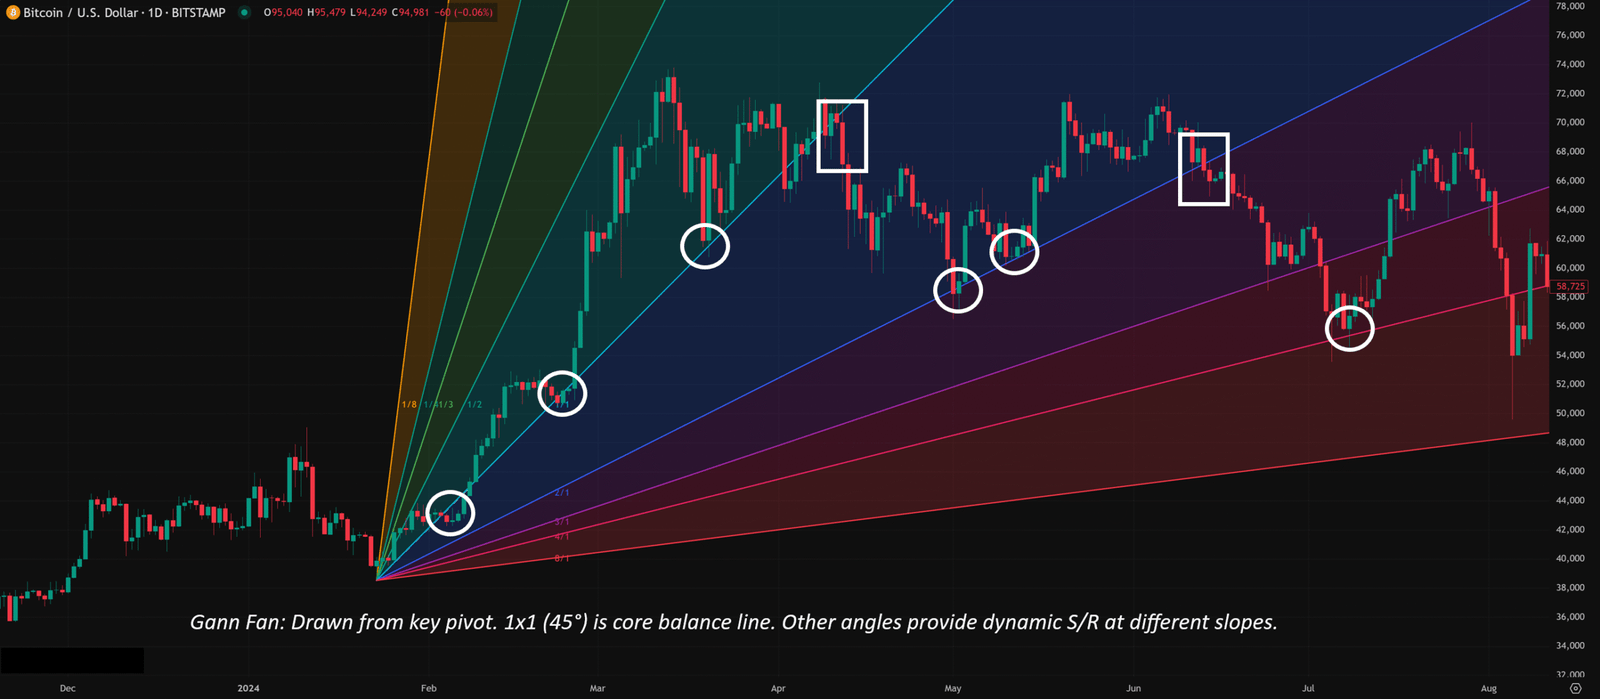
Design Principle: Combines time and price at specific geometric angles. The resulting diagonal lines represent dynamic support and resistance.
The Core Angle: 1×1 (45-degree line)
Definition: Represents a perfect balance where price moves one unit for every one unit of time (e.g., up/down 1 point per day). Gann considered this the most important angle of balance.
Meaning:
Price trading above the 1×1 line indicates a strong uptrend (price rising faster than time). The 1×1 line acts as major support.
Price trading below the 1×1 line indicates a strong downtrend (price falling faster than time). The 1×1 line acts as major resistance.
Price oscillating around the 1×1 line suggests a relatively balanced trend.
Other Important Angles (Common ones):
Ascending Angles (Support Angles – typically drawn from lows):
1×2 (63.4°): Price moves 2 units per 1 unit of time (steeper, strong support).
1×4 (75°): Price moves 4 units per 1 unit of time (very strong support).
1×8 (82.5°): …
2×1 (26.6°): Price moves 1 unit per 2 units of time (flatter support).
4×1 (14°): …
8×1 (7.1°): …
Descending Angles (Resistance Angles – typically drawn from highs): Same angles but sloping downwards, acting as resistance.
How to Draw (Crucial!):
1. Choose the Right Anchor Point! Find a very significant Swing High or Swing Low as the origin for all angle lines. This choice is highly subjective and drastically affects all lines!
2. Set the Correct Scale (Scale Locked)! To ensure 1×1 is truly 45 degrees, many platforms require you to lock the price/time scale (Lock Scale / 1:1 Scale). If the scale is distorted, the angles lose their intended meaning! Many people miss this step!
3. Use Gann Fan Tool: Most platforms have a Gann Fan tool. Select your anchor point, draw the 1×1 line (might need to visually align to 45° or use tool guides), and the tool often automatically generates the other parallel angle lines based on the standard ratios.
Basic Usage: Dynamic S/R & Trend Confirmation
Treat ascending angles as potential support. Look for buy signals if price pulls back to a line.
Treat descending angles as potential resistance. Look for short signals if price rallies to a line.
Price consistently staying above/below a specific angle line suggests the trend is respecting that angle’s support/resistance.
Angle Line Break: A significant signal! E.g., price breaking down from the 1×2 line to the 1×1 line suggests the uptrend is weakening. Breaking below the 1×1 line could signal a trend reversal.
「Gann Fan Example」
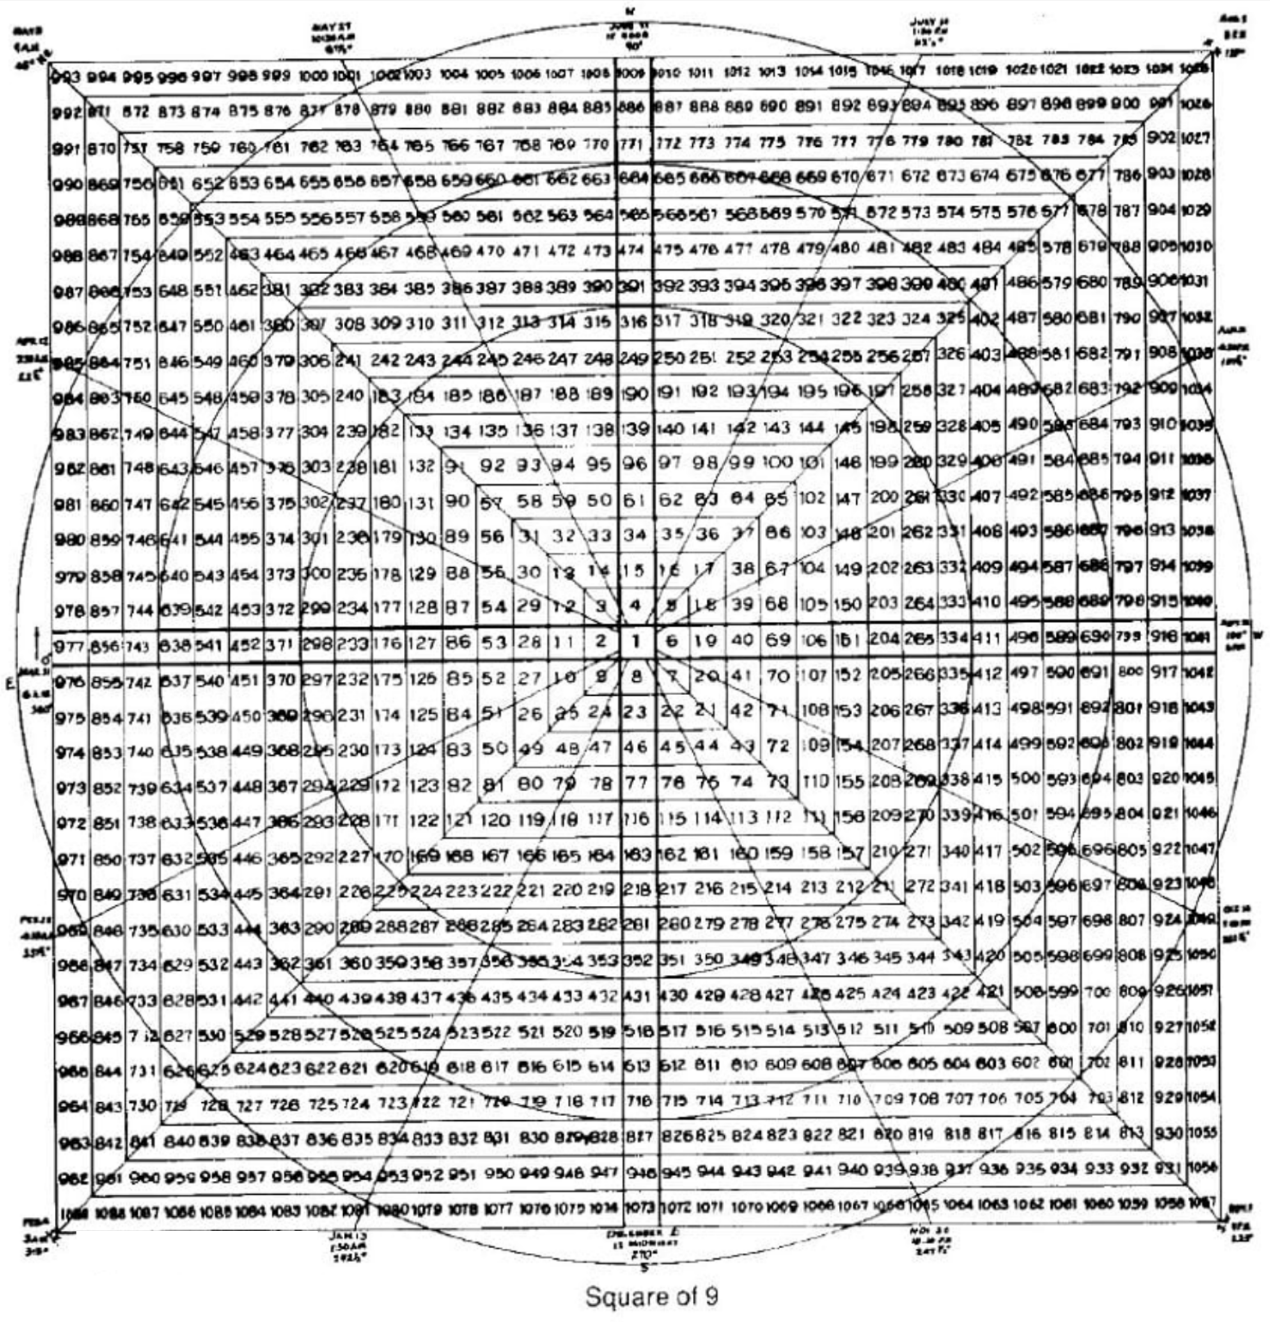
【Gann Square of 9】
Design Principle: This is one of Gann’s most mystical and complex tools. It’s a numerical grid starting with 1 at the center and spiraling outwards clockwise. Gann believed this square revealed geometric and harmonic relationships between price and time.
Core Elements:
Center: Usually anchored to a historically significant low price (or starting at 1).
Cardinal Cross & Ordinal Cross: Lines extending horizontally/vertically (Cardinal) and diagonally (Ordinal) from the center. Numbers falling on these cross lines are considered critically important support/resistance levels.
Squaring Relationship: Numbers on the grid relate closely to their square roots. E.g., numbers along the 45-degree angle lines are often squares of odd numbers (1, 9, 25, 49…).
Basic Usage (Highly Simplified):
1. Set Center/Start Point: Find a major historical low price.
2. Calculate Potential S/R: Use a Square of 9 calculator (many online) or a charting tool (if available). Input the starting price, and it will calculate future potential S/R price levels based on square root and angular relationships.
3. Time Forecasting? The Square can also be used to forecast time turning points by substituting time units (like trading days) into the grid and seeing which angles they fall on, but this is even more complex and controversial.
Current Status: Due to its complexity and mystical nature, fewer traders directly apply the Square of 9, and its methods are hard to verify or replicate consistently. Understanding the underlying idea that “price and time have geometric relationships” is often sufficient.
「Gann Square of 9 Conceptual Diagram」
【Time Cycles】
Gann also heavily emphasized time analysis, believing markets turn at specific time intervals.
Common Cycles: 7 days (and multiples), 45 days, 90 days, 144 days, 1 year, and longer cycles like 10 or 60 years.
Usage: Start from a significant high/low and project these time cycles forward, expecting potential turns around those dates.
Current Status: Time cycle analysis is also highly subjective and difficult to validate consistently.
Advanced application of Gann theory is more of an integrative analytical art than just tweaking settings.
A. Parameters? It’s Really “Anchors” & “Scale”!
Gann Tools Lack Traditional “Parameters”: The angle ratios (1×1, 1×2) are fixed; the Square of 9 structure is fixed.
The Real “Subjective Settings” Are:
Anchor Point Selection: Which high/low do you choose to start your Gann Fan? Which price anchors your Square of 9? This choice dramatically impacts the results! Requires experience and understanding of market structure.
Scale Lock: When drawing angles, did you ensure the correct price/time ratio (1:1 = 45°)? Incorrect scaling distorts all angles.
Cycle Selection: Which time cycles do you believe are relevant to the current market?
How Global Traders Play It?
No universal standard; highly personalized.
Many use Zig Zag or Fractals to help identify “significant” highs/lows as potential anchors, adding objectivity.
When drawing angles, traders might experiment drawing fans from multiple potential anchors to see which set of lines seems to align best with recent price action.
Those using the Square of 9 and cycles usually follow specific calculation and application rules they’ve learned through dedicated study.
B. Confluence is King (Even in Gann):
Given the subjectivity in Gann tools, combining their signals with more objective tools is crucial for reliability!
Look for Confluence:
Gann Angle + Fibo Level + Horizontal S/R?
Square of 9 projected level + Key Moving Average?
Time cycle due date + Reversal Candlestick pattern?
Effectiveness: When different analytical methods point to the same zone, the significance of that zone increases dramatically.
C. Timeframe: Fractal but Needs Matching
Gann believed his principles applied to all timeframes (fractal nature).
In Practice:
Angles: Fans drawn from major pivots on higher timeframes (D1, W1) better represent long-term trend trajectories and S/R. Short-term fans change quickly and break easily.
Square of 9: Usually used with daily or weekly data for longer-term price targets.
Time Cycles: Primarily applied on daily charts or higher.
Key: Match the timeframe of your data and anchor points to the trend level you are analyzing.
D. Which Combos Are “Hot” & Effective? (Hottest & Effective Setups – The Gann Way)
Due to complexity and subjectivity, it’s hard to define universally “hottest” parameter combos. Gann followers often develop their own refined methods after deep study.
Relatively “Mainstream” or “Approachable” Usages:
Usage 1: 1×1 Angle as Primary Trend Filter & Dynamic S/R
Execution: Draw the 1×1 line from the last confirmed major high/low. Price above = bullish bias; below = bearish bias. Look for confirmed bounces/rejections at the 1×1 line for trend entries. A break of the 1×1 is a major warning.
Effectiveness: Provides a simple, dynamic trend bias and S/R reference.
Usage 2: Key Angle Break + Retest Confirmation
Execution: Identify a significant angle line (e.g., 1×1, 1×2) that has been tested multiple times. Wait for a closing price break. Then wait for a retest of the broken line as new S/R before entering.
Effectiveness: Catches potential trend shifts after an angle fails.
Usage 3: Gann Angle + Fibo Confluence Zone Trading
Execution: Find price zones where a Gann Angle intersects with a key Fibo level. Look for candlestick reversal signals within this high-probability confluence zone.
Effectiveness: Uses confluence to increase trade probability.
E. Best Parameter Combos? (Optimal Settings – The Gann Enigma)
Angle Ratios: 1×1, 1×2, 2×1, 1×4, 4×1, 1×8, 8×1 are the most common set. No single “best”; depends on the trend’s slope. 1×1 is always core.
Anchor Point Selection: No best, only most relevant! Depends on the trend leg you want to analyze.
Square of 9 / Time Cycles: Requires dedicated, specialized study; no simple “best settings.”
Conclusion: Mastering Gann Theory isn’t about finding secret parameters. It requires deeply understanding Gann’s philosophy, mastering the drawing and interpretation of the tools, and extensive chart practice and validation. It’s more akin to a “craft” or even a “belief system” than a plug-and-play indicator.
Gann Theory is a unique, complex, and controversial system within technical analysis. It attempts to decode and forecast market movements using geometry, numerology, and time cycles.
Its potential lies in:
Offering a unique framework combining price and time analysis.
Attempting to forecast future key turning points (price and time).
Gann Angles providing unique dynamic S/R levels.
However, young traders approaching Gann Theory must be prepared:
It’s extremely complex with a steep learning curve.
Highly subjective, especially in anchor point selection and cycle identification.
Many concepts are difficult to scientifically verify, sometimes bordering on the esoteric.
Provides few simple, direct buy/sell signals; it’s more of an analytical philosophy.
Requires significant time investment for study and practice.
If you’re deeply interested in the underlying structure of markets, time-price relationships, and are willing to dedicate substantial effort to research, Gann Theory might open new doors. But if you’re looking for simple, objective, easily replicable trading systems, Gann might not be your cup of tea.
Remember:
Gann’s core is time-price balance and geometric relationships.
Gann Angles (Fans) are the most accessible and commonly used tool.
Anchor point selection and chart scaling are critical for angles.
Square of 9 and Time Cycles are highly advanced and subjective.
Confluence remains a valuable approach for increasing reliability.
Maintain critical thinking; don’t fall into blind belief.
Alright! Hope this “expedition” into Gann Theory gives you an initial overview! If you’re genuinely intrigued, be prepared to seek out specialized resources for deeper study! See ya next time! Stay curious, stay grounded!