Alright, all you slick traders and crypto pioneers! Wanna absolutely dominate the financial markets? Just knowing single moving averages isn’t gonna cut it. Today, we’re breaking down an indicator that looks kinda like spaghetti but packs a serious punch – the GMMA (Guppy Multiple Moving Average)! Don’t let all the lines freak you out; figure out its playbook, and you can practically get an X-ray view of the psychological battle between short-term and long-term players in the market!
What the heck is GMMA? Why should you care?
GMMA isn’t just one line; it’s a collection of two distinct groups of EMAs (Exponential Moving Averages). It was invented by a heavy-hitting full-time trader from Australia, Daryl Guppy. His idea was that the market isn’t just one monolithic block; it’s made up of people with different game plans:
- Short-term Traders / Speculators: These folks react fast. They’re sensitive to news, headlines, and short-term price swings. They jump in and out quickly, mainly influencing near-term price action.
- Long-term Investors: These big players think longer-term. They focus on fundamentals and major trends. Their money flow dictates the market’s long-term direction.
GMMA aims to visualize the behavior of these two groups and their relationship to judge the strength, stability, and potential turning points of a trend.
「GMMA Structure: Short-Term Group (Blue) vs. Long-Term Group (Red)」
GMMA’s Design Principle: Why Two Groups of EMAs?
- Why EMAs? Guppy believed EMAs react faster to price changes, better capturing the sentiment shifts of short-term traders.
- Why Two Groups? The core idea is to separate the noise from the trend. The short-term group represents market “noise” or short-term sentiment, while the long-term group represents market “consensus” or the power behind the long-term trend.
- Why Multiple Lines? Having several EMAs with different periods within each group shows the degree of agreement (consensus) among those players. If the lines within a group spread apart (fan out), it means strong agreement and a powerful trend. If they squeeze together (compress), it signals disagreement, meaning the trend might be weakening or reversing.
Reading GMMA Basics (Must-Know for Starters):
- Spotting Trend Direction & Strength:
-
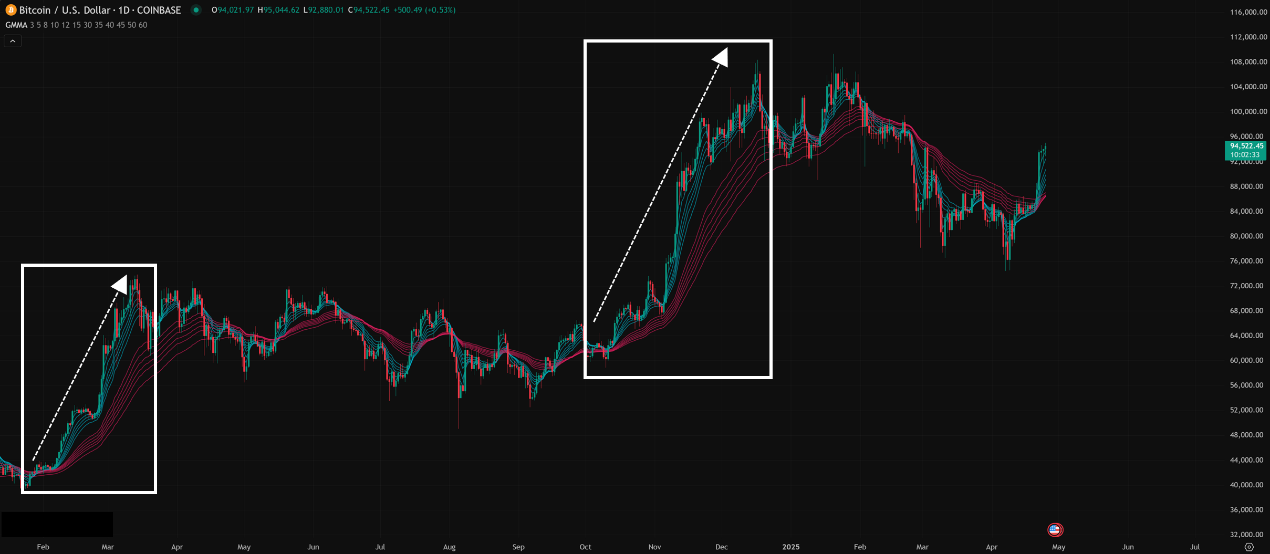
- Both groups parallel UP, and fanning out within each group: Strong uptrend! Both short-term traders and long-term investors are bullish and in sync. Lots of momentum, the lines are spread apart like a fan (expansion).
「GMMA Showing Trend Strength: Expansion = Strong」
-
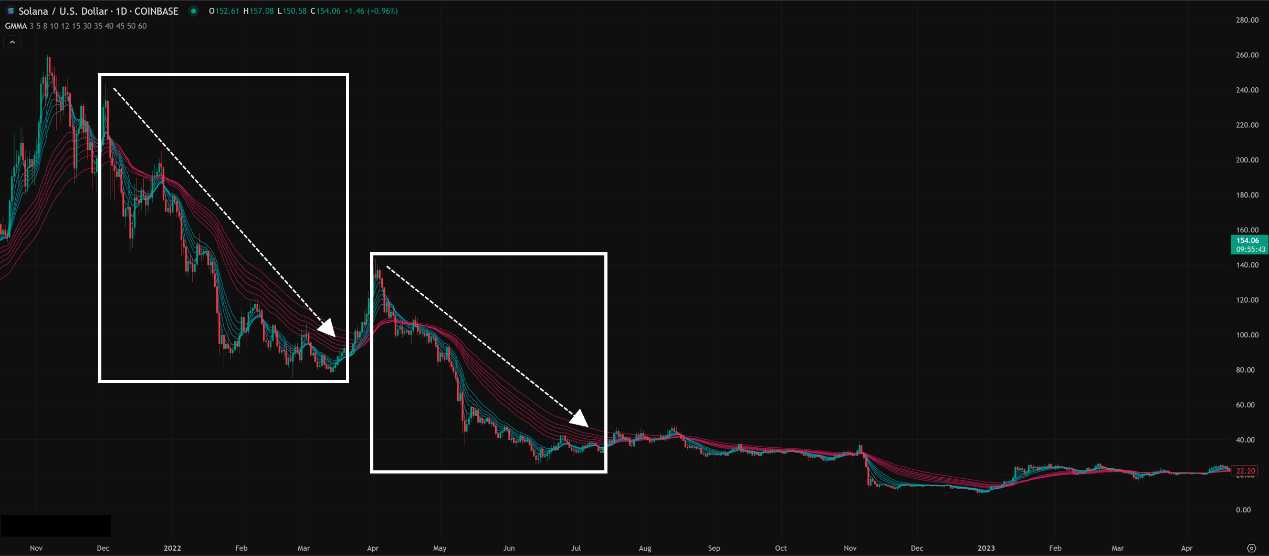
- Both groups parallel DOWN, and fanning out: Strong downtrend! Everyone agrees the direction is down. Price is trading below all lines. means “Strong Downtrend – Expansion”.
「GMMA Showing Downtrend Strength」
-
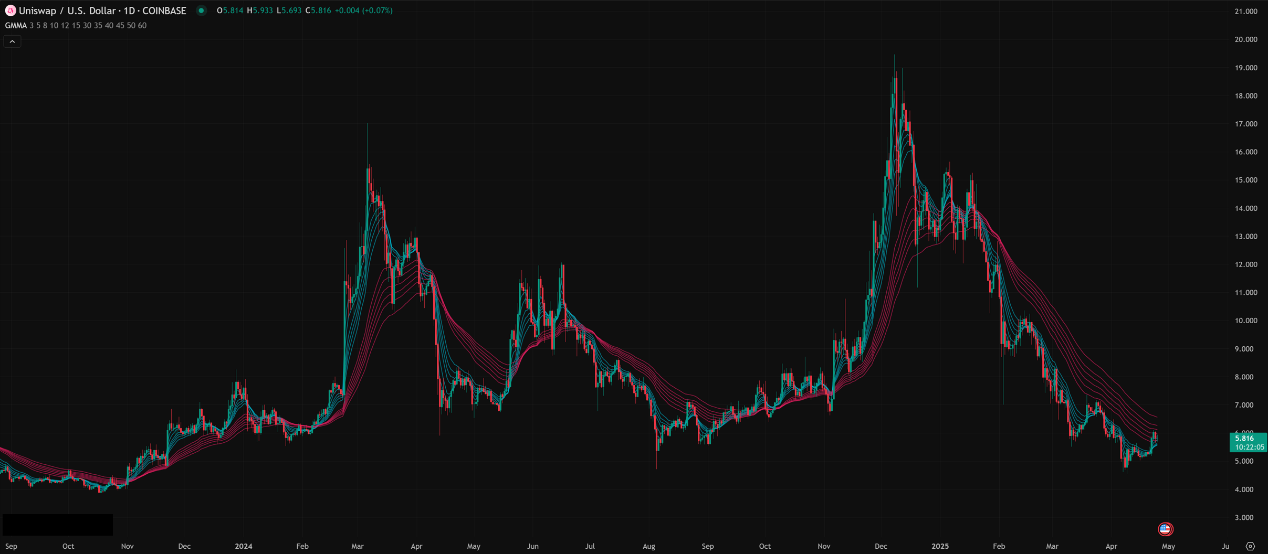
- Groups compressing or tangling together: Means Trend weakening, consolidation (ranging), or potential reversal. Short-term and long-term players disagree, or everyone’s unsure. Be extra cautious here! Price is chopping through the tangled lines means “Consolidation / Indecision – Compression”.
「GMMA Showing Trend Weakness: Compression = Weak or Reversal?」
2. Watching the Interaction Between Groups:
-
- Short-term Group (Blue) Crossing the Long-term Group (Red):
- Crossing UP from below: Potential start or resumption of an uptrend. Stronger signal if the red group also starts fanning upwards during the cross.
- Crossing DOWN from above: Potential start or resumption of a downtrend.
- Short-term Group Testing the Long-term Group:
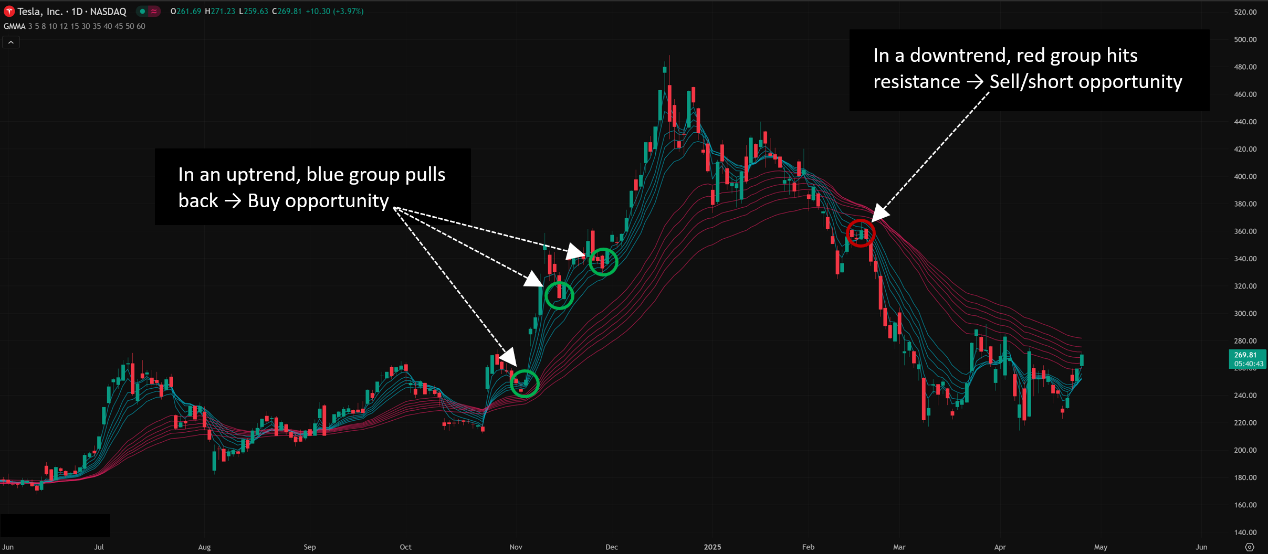
- In an uptrend, blue group pulls back to the red group, finds support, and turns back up → Buy opportunity within a continuing trend.
- In a downtrend, blue group rallies up to the red group, hits resistance, and turns back down → Sell/short opportunity within a continuing trend.
「GMMA as Dynamic Support/Resistance Zone」
3. Watching Price vs. the Short-Term Group:
-
- Price consistently stays above the blue group → Short-term strength.
- Price breaks down through the blue group → Short-term weakness possible; watch if the red group provides support.
GMMA Advanced Plays & Low Timeframe Breakdown (Pro Zone):
Traditionally, GMMA works best on higher timeframes (like 1-hour, 4-hour, Daily) because it’s designed to compare short vs. long-term forces, and lower timeframes have too much noise. However, lots of you trading crypto or day trading want to know how to use it on shorter charts. Let’s break it down:
Deep Dive into Short Timeframes (1-min / 5-min / 15-min Charts):
- The Core Challenge: On these super short timeframes, price action is wild, and “noise” is extreme. Both GMMA groups, especially the blue short-term one, become hyper-sensitive and volatile. Lines tangle, compress, and expand frequently, leading to many false signals. The red “long-term” group here doesn’t represent true long-term investors but rather the average cost basis of slightly less hyperactive traders.
- 1-Minute Chart (1M):
- Analysis: Extremely chaotic! The blue group basically dances with every single candle. The red group might be slightly smoother but still changes direction rapidly. Expansion/compression happens so fast it’s hard to catch a stable trend. Using traditional GMMA crossover or pullback strategies here is super risky.
- Potential Uses (High Risk!):
- Catching Volatility Spikes: Watch for moments when both groups get extremely compressed (squeezed super tight), followed by price breaking out explosively with a volume surge. This might be a scalping opportunity for just a few ticks/pips.
- Filtering Chop (Barely): Use the general direction of the red group as an ultra-short-term bias, trying to only take trades in that direction. But even the red group’s direction flips constantly on the 1M.
- Bottom Line: Strongly advise against using GMMA for decision-making on the 1M chart, especially for beginners. Too many false signals, and the lag here will just make you chase tops and sell bottoms.
「GMMA on 1-Minute Chart: High Noise!」
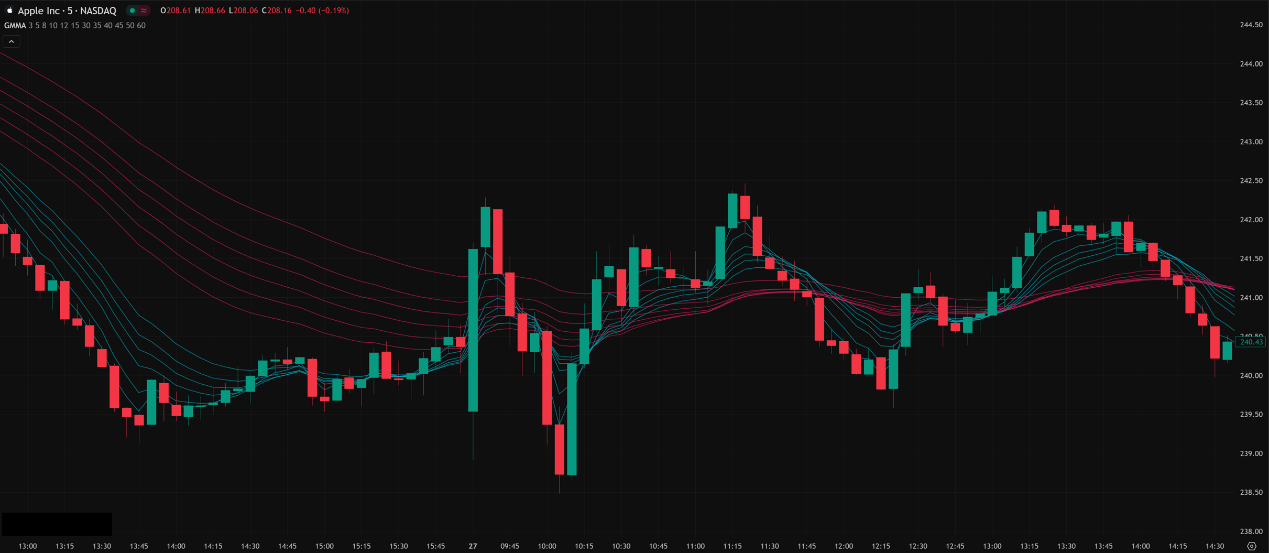
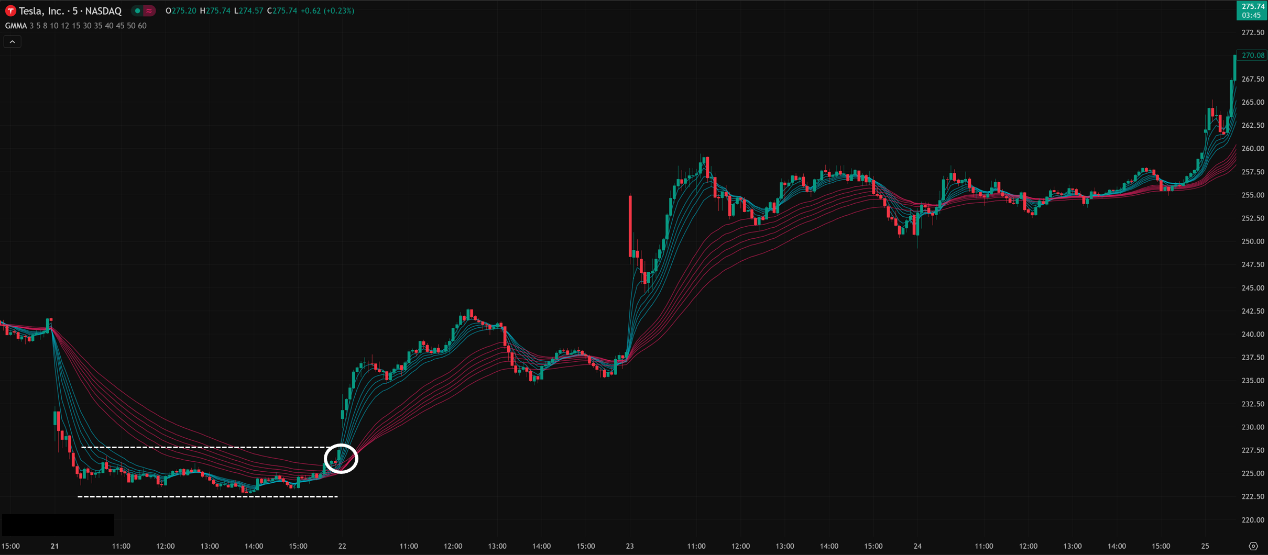
- 5-Minute Chart (5M):
- Analysis: Slightly better than 1M, but still very noisy. The red long-term group starts showing a tiny bit more stability, allowing you to maybe identify a very short intraday micro-trend. The blue group remains highly volatile.
- Potential Uses:
- Intraday Momentum Plays: When the red group shows a relatively clear direction (e.g., consistently angled up and slightly expanding) AND the blue group is also fanning out in the same direction, you could consider a trend-following trade. E.g., Red group up, wait for the blue group to pull back near the red, then enter long as the blue group starts expanding upwards again.
- Compression Breakouts: Look for periods where both groups squeeze together tightly, then price breaks out decisively (with volume!) in the direction the red group was pointing. Slightly more reliable than on the 1M.
- Bottom Line: Using GMMA on the 5M still requires heavy filtering! You absolutely need to combine it with other tools (like Volume Profile, VWAP, or a fast oscillator like Stochastics) and use strict stop losses. Don’t rely solely on GMMA signals here.
「GMMA on 5-Minute Chart: Still Noisy, Use with Caution」
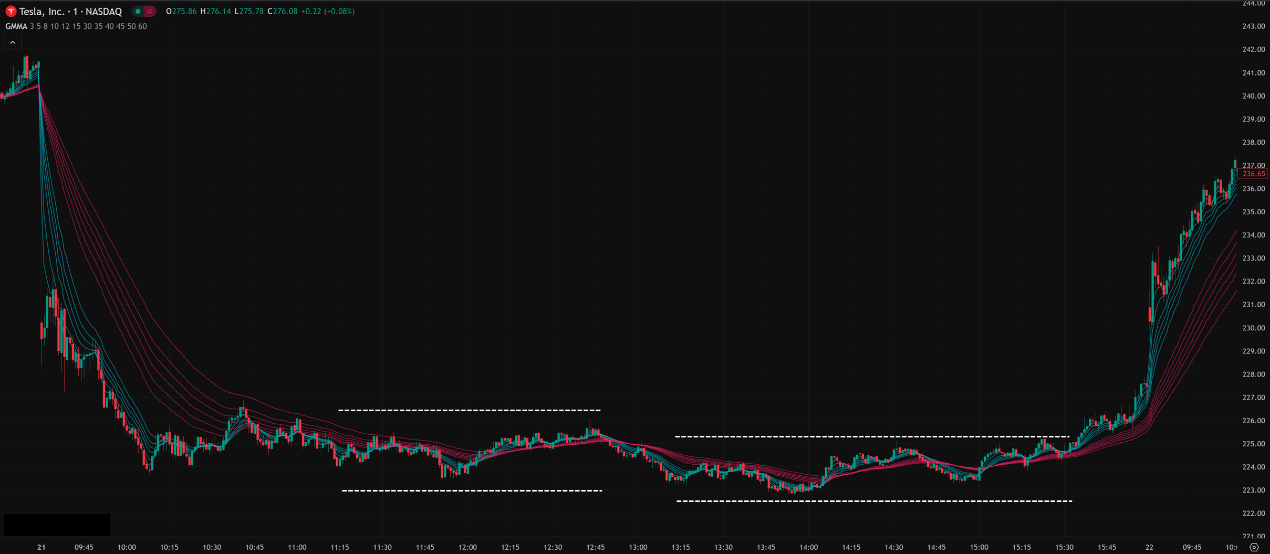
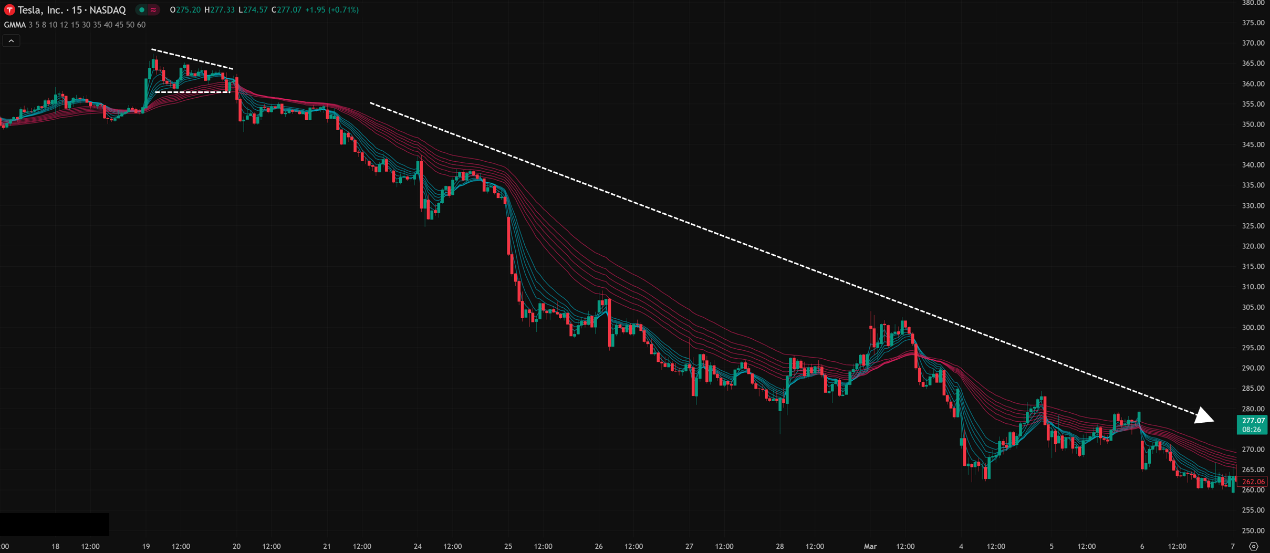
- 15-Minute Chart (15M):
- Analysis: Among these three low timeframes, the 15M is where GMMA becomes relatively the most reliable. The red long-term group’s direction is more stable and better reflects the main intraday trend or range. While the blue group still fluctuates, its interaction with the red group starts offering more meaningful insights.
- Potential Uses:
- Trend Confirmation & Pullbacks: When the red group is stable and expanding up/down, consider this the intraday trend. Wait for the blue group to pull back into or touch the red group, then look for entries (with candlestick confirmation) as the blue group starts expanding again in the direction of the red group.
- Trend Weakness Warning: If previously expanding groups start consistently compressing, especially if the red group itself begins to flatten and squeeze, be warned that the trend might be ending or transitioning into consolidation.
- Breaking Consolidation: When both groups have been tangled and compressed in a tight range for a while, and then price breaks out of this range with volume, accompanied by both groups starting to fan out in the breakout direction – this is a more potent breakout signal.
- Bottom Line: GMMA on the 15M chart starts to become usable more systematically, especially for confirming intraday trends and finding trend-following pullback entries. Still highly recommended to use it with other analysis tools.
「GMMA on 15-Minute Chart: Becoming More Usable」
Which Low Timeframe Combo is Hottest & Most Effective? How to Use It?
- Hottest & Most Effective? Let’s be real, GMMA isn’t really in its element on these ultra-low timeframes (1M, 5M, 15M). There isn’t one “hottest” combo here. Its design genius truly shines in catching bigger waves on Daily, 4-Hour, or at least 1-Hour charts.
- If You Must Use It Short-Term, How Do You Make It Work?
- Timeframe Choice: 15-Min > 5-Min > 1-Min. The longer the timeframe, the relatively more reliable the signals.
- Core Focus: Don’t get too hung up on the crosses! Focus on:
- Red Group’s Direction & Expansion: Use this to gauge the immediate primary direction and trend strength.
- Compression vs. Expansion of Both Groups: Compression = energy building/indecision; Expansion = energy release/consensus. Try to catch the transition from extreme compression to simultaneous expansion.
- Trend-Following Pullbacks: Only look for entries in the direction of a clear red group trend, when the blue group pulls back towards the red.
3. Mandatory Condition: Combine with Other Tools!
-
-
- Volume: Breakouts from compression MUST have volume confirmation!
- Price Action: Candlestick patterns (Pin Bars, Engulfing) appearing at key levels (like blue group testing red group) increase your odds.
- Support/Resistance: Use traditional horizontal S/R levels, Pivot Points, etc.
- Other Indicators: Maybe RSI to judge if a pullback is oversold/overbought, or Bollinger Bands to gauge volatility.
4. Mindset Management:
-
-
- Low timeframe trading requires lightning-fast reactions and iron discipline. GMMA here is just one part of your toolkit, not a magic bullet.
GMMA Default Parameters & “Best” Parameters?
- Classic Default Parameters (Daryl Guppy’s Original):
- Short-Term Group (Blue): 3, 5, 8, 10, 12, 15 EMA
- Long-Term Group (Red): 30, 35, 40, 45, 50, 60 EMA
- Why These Numbers? Guppy reportedly chose these based on trading experience and observation, some say there’s a loose connection to Fibonacci numbers. The goal was to capture different speeds of short-term traders and different perspectives of long-term investors.
- Is There a “Best” Parameter Combo?
- For GMMA, the vast majority of users stick with the default parameters. This is because the indicator’s strength lies in the overall visual pattern, the expansion/compression, and the interaction between the groups as a whole, not the precise crossover of a single line. Changing individual parameters might not significantly alter the overall visual message, or could even disrupt Guppy’s intended design.
- Conclusion: Unless you have very strong reasons and extensive backtesting data to support a change, it’s highly recommended to just use the default parameters. Spend your optimization energy on combining GMMA with other tools and improving your execution.
Bottom Line: GMMA is Your Market “X-Ray,” But You Need to Know How to Read It!
GMMA offers a unique perspective, helping you see beneath the market’s surface to understand the tug-of-war between short-term money and long-term capital, and to feel the true strength and health of a trend.
But remember:
- It’s Lagging: All moving averages follow the trend; they don’t predict the future.
- Noisy on Low Timeframes: Using it on 1M/5M/15M requires extreme caution and filtering. It excels on H1 and above.
- Visually Complex: It can look messy at first. It takes time to get used to interpreting the group patterns.
- Don’t Use It Alone (Combine & Confirm): Always use it with price action, volume, or other indicators.
- Risk Management is Boss: No matter the indicator, stops and position sizing are how you survive and thrive.
「GMMA in Action = Visuals + Interpretation + Risk Control」
Hope this deep dive into GMMA, especially the analysis of low timeframes, helps those of you wanting to use this tool in fast-paced markets! Go add GMMA to your charts and start observing, feeling the dance of the line groups!
Next Steps:
- Add GMMA (with default settings) to your frequently used charts (try 15M, 1H, 4H, Daily).
- Compare how the GMMA groups look and behave differently across these timeframes.
- Observe how the two groups interact during trend initiation, continuation, consolidation, and exhaustion phases.
- Try combining GMMA with volume on the 15M chart to spot “compression-to-expansion” opportunities.
- Keep Learning, Keep Practicing, Keep Adapting! May your trades Rooooocket!🚀