Physical Address
304 North Cardinal St.
Dorchester Center, MA 02124
Physical Address
304 North Cardinal St.
Dorchester Center, MA 02124
Alright Crew! What’s poppin’? Ready to level up your technical analysis game again? We’ve talked Standard Deviation, we’ve wrestled the Gator… now let’s get real about measuring the actual wildness of the market. Today, we’re diving deep into Historical Volatility (HV)!
You might think, “Volatility? Duh, I see the crazy swings in crypto!” But HV isn’t just about feeling the bumps; it’s about measuring them scientifically. It tells you how much the price actually jiggled and jumped around in the past. Knowing this is clutch for figuring out risk, spotting potential turning points (in volatility itself!), and even comparing how crazy different assets are (like, is Bitcoin really crazier than that new meme coin?).
So, buckle up, grab your energy drink (or coffee, we don’t judge ), and let’s decode Historical Volatility together!
HV isn’t some flashy new kid on the block. Its roots are deep in the world of finance, especially options trading.
The Problem: Back in the day (and still today!), people needed a way to quantify how much an asset’s price tended to move in the past. This wasn’t just curiosity; it was crucial for pricing options. Options prices heavily depend on how volatile the underlying asset is expected to be.
Enter Statistics: Academics and traders realized they could use a familiar statistical tool – standard deviation – but apply it specifically to price returns (the percentage changes day-to-day, week-to-week, etc.).
Black-Scholes Connection: The famous Black-Scholes options pricing model (you’ll hear this a lot if you dive into options) explicitly uses volatility as a key input. While that model often uses Implied Volatility (the market’s guess about the future), Historical Volatility provides the essential baseline – what actually happened. It gives context to whether the market’s future guess (IV) seems high or low compared to reality (HV).
Beyond Options: Traders quickly saw that HV was useful even if you weren’t trading options. It’s a pure measure of realized risk and market activity level.
So, HV was born out of the need to put a number on past price fluctuations, primarily for risk assessment and derivatives pricing, but its usefulness extends far beyond that.
Okay, how does this thing actually get calculated? Don’t worry, you won’t need a PhD, just the basic idea.
Get the Price Changes: First, the indicator looks at the price history over a certain period (e.g., the last 20 days). It calculates the percentage change from one period’s close to the next (e.g., daily returns). Why percentages? Because a $1 jump means way more for a $10 stock than a $1000 stock. Percentages keep it relative.
Measure the “Spread”: Next, it calculates the standard deviation of these percentage returns. Remember Standard Deviation from our last chat? It measures how spread out the numbers are from their average. A high standard deviation here means the daily returns were all over the place (big up days, big down days); a low standard deviation means the returns were pretty consistent (small moves).
Annualize It (The Weird Part?): This is key. The standard deviation of daily returns is then usually annualized. This means converting the daily volatility figure into an equivalent yearly figure. Why? It allows for apples-to-apples comparison. You can compare the 20-day HV of Bitcoin to the 90-day HV of Apple, or the HV of stocks (which trade ~252 days/year) to crypto (365 days/year). The standard formula involves multiplying the daily standard deviation by the square root of the number of trading periods in a year (e.g., √252 for stocks, √365 for crypto).
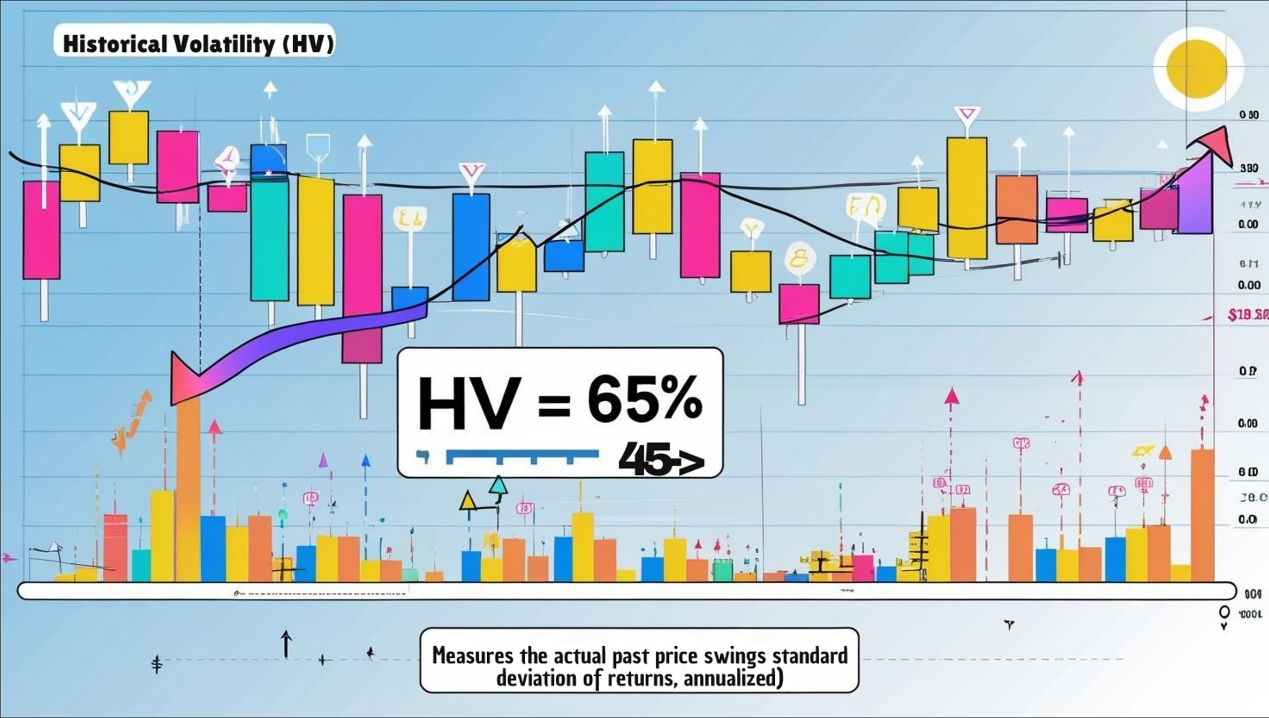
The Output: The final HV number is typically expressed as an annualized percentage. For example, an HV of 50% means the asset’s price, based on its recent past behavior, has fluctuated in a way that would correspond to a potential 50% move up or down from the average over a full year (statistically speaking, within one standard deviation).
Think of it like this: HV is the market’s historical speedometer. A high number means the price has been flooring it and swerving; a low number means it’s been cruising steadily.
「Historical Volatility Concept Explained」


Level 1: The Quick Read (Basic Interpretation)
The most straightforward use is to gauge the current market vibe:
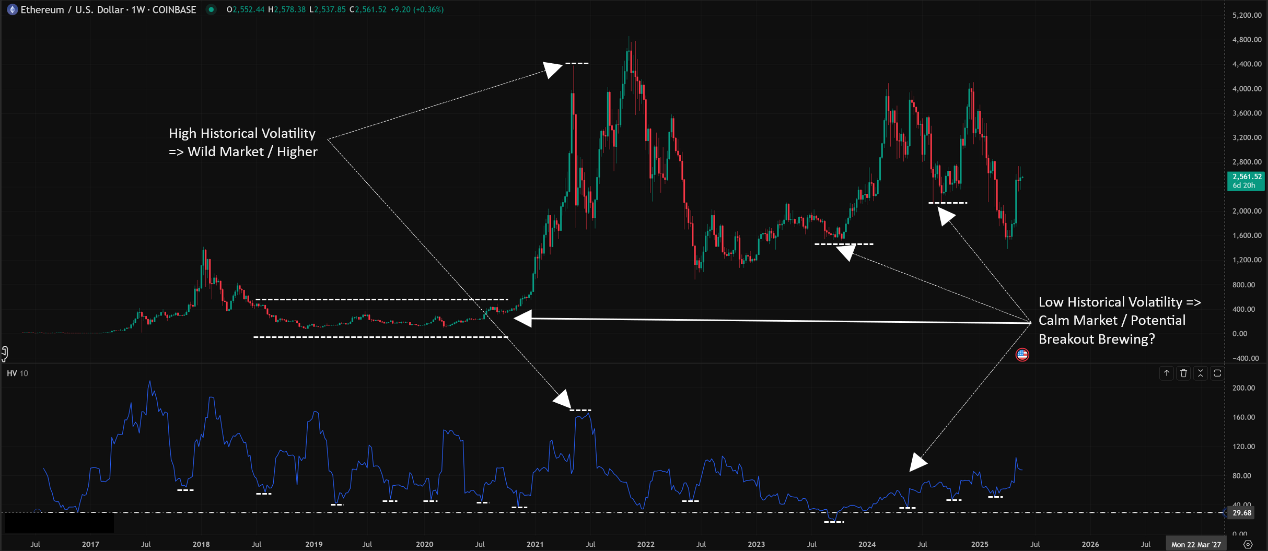
High HV:
Meaning: The market has been choppy, wild, making big moves recently.
Implication: Higher risk, but also potentially higher reward (if you catch the right side of a move). Trends might be strong or reversals sharp. Think of Bitcoin during a major pump or dump.
Low HV:
Meaning: The market has been calm, prices moving in a narrow range, not much excitement.
Implication: Lower immediate risk, maybe boredom? BUT, extremely low HV is often seen as the “calm before the storm.” Like we discussed with Standard Deviation, prolonged low volatility periods often precede explosive breakouts. Think of a stablecoin (usually!), or Bitcoin during a long sideways grind.
Comparing HV:
Across Assets: Check the HV of BTC vs. ETH vs. SOL vs. Gold vs. Tesla. It gives you a quantifiable way to see which asset has actually been more volatile recently.
Over Time: Look at an asset’s current HV compared to its own history (e.g., its average HV over the past year). Is the current volatility unusually high or low for this specific asset?
「High vs. Low HV on a Chart」

Ready to go beyond just high/low? Let’s get sophisticated.
A. Volatility Cycles & Mean Reversion:
Concept: Volatility isn’t random; it tends to cluster. Periods of high volatility are often followed by more high volatility, and low by low. However, it also tends to revert to its mean over time. Extreme highs in HV often eventually cool down, and extreme lows often eventually heat up.
Usage:
Identify extreme HV readings (compared to the asset’s own history). Extremely high HV might suggest a climax (though not necessarily a price reversal, maybe just a volatility peak), making chasing trends riskier. Extremely low HV signals complacency and increases the odds of a significant volatility expansion (breakout) soon.
Look for HV turning points: When HV starts dropping sharply from a peak, or rising sharply from a trough, it signals a potential change in the market’s character.
B. The HV vs. IV Spread (Crucial for Options Geeks, Insightful for All):
Concept: As mentioned, HV is what happened, Implied Volatility (IV) is the market’s expectation of future volatility (derived from options prices). Comparing them is key.
Usage:
HV > IV: Realized volatility was higher than what the market expected. Options were likely “underpriced” looking back. Could suggest the market is underestimating future moves.
HV < IV: Realized volatility was lower than expected. Options were likely “overpriced.” Could suggest the market is fearful or expecting fireworks that haven’t materialized (yet).
For Non-Options Traders: This spread gives you a feel for market sentiment. Is the market currently pricing in more chaos than is actually happening (high IV vs. HV), or is it too chill compared to reality (low IV vs. HV)?
C. Parameters & Timeframes Deep Dive:
Default Parameter: Often 10, 20, or 21 periods (days).
Why? 10 is two trading weeks. 20/21 roughly corresponds to one trading month for stocks, a common reference point. These capture relatively recent volatility. Some platforms might use 30. For crypto (trading 24/7), using periods based on weeks (7, 14) or months (30) makes sense too.
Global Trader Variations & Styles:
Short-Term Traders (Day Traders, Scalpers – common in fast markets like Crypto):
Parameters: Tend to use shorter periods, like 5, 10, or 14 days/periods.
Why: Need to capture the most recent shifts in volatility quickly. A 10-day HV gives a better feel for the immediate “temperature” than a 100-day HV.
Example: A crypto trader might use a 10-period HV on an H4 or D1 chart to gauge if the current consolidation is unusually quiet (low HV) before placing a breakout trade.
Swing & Position Traders (Stocks, FX, Longer-term Crypto):
Parameters: Often use 20, 30, 60, or even 90 days/periods.
Why: Want a smoother, more stable measure of volatility that filters out daily noise. Helps assess the broader risk environment or compare volatility regimes over weeks/months.
Example: A stock swing trader might look at the 60-day HV to see if the overall market volatility is elevated before deciding position size.
Long-Term Investors / Risk Managers:
Parameters: May use 100, 180, or 252/365 days/periods (representing roughly 6 months to a year).
Why: Interested in the asset’s fundamental volatility character over long cycles, for asset allocation or long-term risk modeling.
Timeframe Impact:
Using HV on a Daily chart (e.g., 20-day HV) measures volatility based on daily closing prices.
Using HV on a Weekly chart (e.g., 10-week HV) measures volatility based on weekly price changes, giving a much broader, smoother perspective.
Consistency is Key: Match your HV period length to your trading timeframe and goals. A 10-period HV on a Weekly chart looks at 10 weeks; a 10-period HV on a Daily chart looks at 10 days.
D. “Hottest” Combos & Effective Setups (No Magic, Just Logic):
Remember, HV measures the past; it doesn’t predict the future directly. But you can use it smartly:
Setup 1: HV Rank / Percentile (Super Useful!)
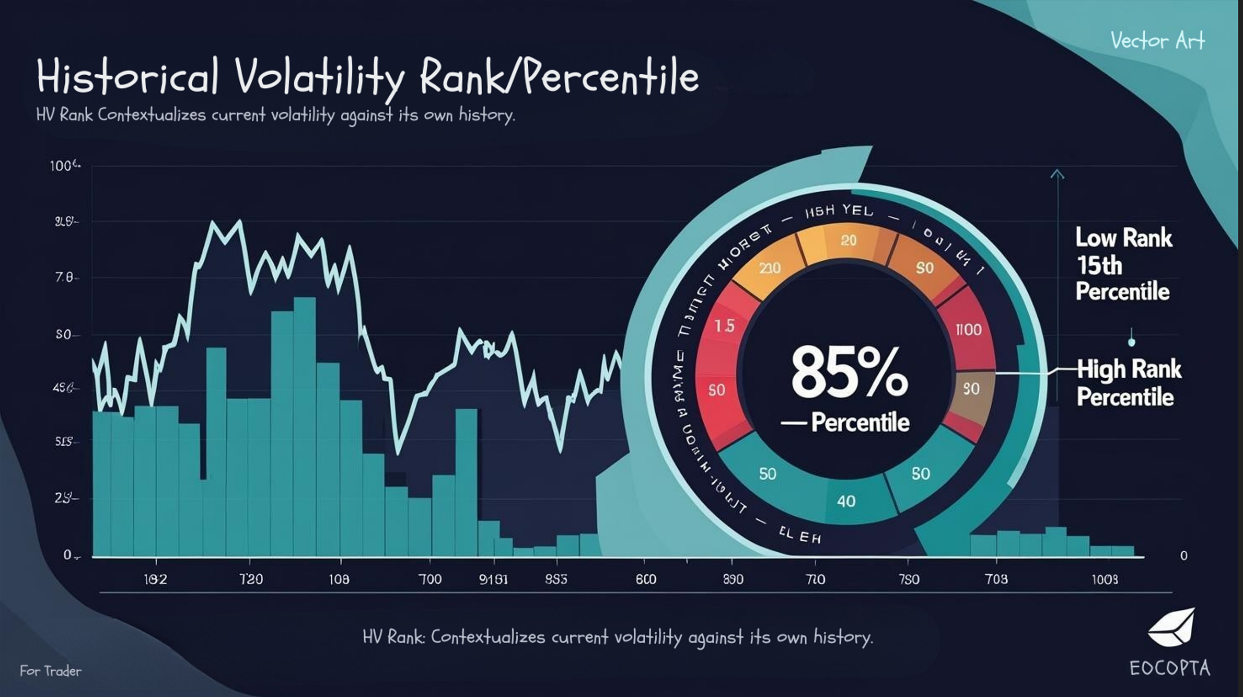
Concept: Instead of just looking at the absolute HV number, calculate where the current HV sits relative to its own range over a longer period (e.g., the past year or 252 days). Are we in the top 10% of historical readings (High Rank)? Or the bottom 10% (Low Rank)? Many platforms call this “IV Rank” when applied to Implied Volatility, but the concept is identical for HV.
How to Use:
Low HV Rank (e.g., < 20th percentile): Market is historically calm. Be cautious of breakouts (might be fakeouts in low vol), or prepare for potential volatility expansion (the “squeeze”). Some strategies work better in low vol (e.g., range trading).
High HV Rank (e.g., > 80th percentile): Market is historically wild. Trend-following might work well if price action confirms, but reversals can be sharp. Mean reversion in volatility is more likely (volatility might cool down). Some traders avoid initiating new trades in extreme high vol or reduce size.
Effectiveness: Provides crucial context. An HV of 40% might seem high, but if the asset’s HV has been between 30% and 100% over the last year, 40% is actually on the low side (Low Rank).
「HV Rank/Percentile Concept」

Setup 2: Volatility as a Regime Filter
Concept: Use the HV level or rank to decide which type of strategy to deploy.
How to Use:
Low HV / Low Rank: Maybe focus on range-bound strategies, mean reversion plays, or prepare for potential breakouts (using other indicators for entry).
Rising HV / High Rank: Trend-following strategies might be more effective. Use wider stops initially. Be aware of potential exhaustion.
Effectiveness: Helps adapt your approach to the prevailing market conditions, acknowledging that no single strategy works well in all volatility environments.
Setup 3: Confirming Breakouts (Used with Caution)
Concept: While Standard Deviation or Bollinger Bands might be more direct for price breakouts, a sharp spike in HV accompanying a price breakout from a low-volatility consolidation adds confirmation that energy is being released.
How to Use: Look for price breaking a key level simultaneously with HV starting to rise significantly from a low base.
Effectiveness: Can help filter out weak/false breakouts that occur without a corresponding increase in volatility.
E. Optimal Parameter Combos? (The Reality Check)
You guessed it: There’s NO single “best” parameter set for HV. It totally depends on:
Your Goal: Short-term trading? Long-term analysis? Risk management?
The Asset: Crypto HV behaves differently than bond HV.
The Timeframe: Daily, Weekly, H4?
Market Conditions: What worked last year might not work this year.
Guidelines, Not Rules:
Short-Term Analysis / Trading (Intraday – Few Days): Focus on shorter HV periods like 10, 14, 20, 30 on timeframes like H1, H4, D1. Use HV Rank over maybe the last 60-100 periods.
Medium-Term Analysis / Swing Trading (Weeks – Months): Use periods like 30, 60, 90 on D1 or W1 charts. Calculate HV Rank over the past year (252/365 periods).
Long-Term Analysis / Investing: Use 100, 180, 252/365 periods on W1 or even MN charts.
The Real “Best Practice”:
Understand Your Needs: What are you trying to measure?
Start with Defaults/Common Settings: 10, 20, 60, 252 are good starting points to explore.
Context is King: Always compare current HV to its past using Rank/Percentile.
Combine, Don’t Isolate: Use HV alongside price action, trend indicators, momentum, etc. It provides context, not entry signals on its own.
Test and Adapt: See what works for your specific assets and strategies through backtesting and forward testing.
Historical Volatility is like your car’s trip computer telling you how rough the road has been. It doesn’t have a crystal ball for the road ahead, but it gives you invaluable, objective data about the journey so far.
It helps you:
Objectively Measure Past Risk/Activity: Puts a number on the “wildness.”
Contextualize Current Conditions: Is this level of chop normal or extreme? (HV Rank!)
Identify Potential Regime Shifts: Spotting shifts from low-to-high or high-to-low volatility.
Compare Apples to Apples: Assess the relative volatility of different assets.
Filter Strategies: Adapt your approach based on the measured volatility environment.
For young traders navigating the often-insane swings of crypto and other markets, understanding HV moves you from simply reacting to volatility to analyzing it. It’s a core piece of the risk management and strategy puzzle.
Key Takeaways:
HV measures past, realized volatility (standard deviation of returns).
Context (HV Rank/Percentile) is more important than the absolute number.
No magic parameters; tailor them to your goals and asset.
Use it as a context and filter tool, not a standalone signal generator.
Alright, that’s the lowdown on Historical Volatility! Go check it out on your charts, see how it relates to price action, and start thinking about how you can use it to sharpen your edge. Stay sharp, stay informed! Peace!