Okay, all you sharp-eyed Traders, Crypto Hunters, and comrades aiming to Level Up in the markets! Today, we’re dissecting a weapon that looks as complex as a Gundam control panel but is actually a complete trading system – the Ichimoku Cloud (Ichimoku Kinko Hyo), or just “Ichimoku” for short! Don’t let the lines and clouds intimidate you; master this, and it’s like having an all-weather market GPS + weather forecast rolled into one!
What the heck is the Ichimoku Cloud? Why bother learning this ‘Cloud’?
Ichimoku Kinko Hyo has a fancy full name meaning “one-look equilibrium chart.” It’s not just a single indicator; it’s a comprehensive technical analysis system integrating multiple pieces of information. It consists of five main lines and a “cloud,” designed to help you see at a glance:
- Trend Direction
- Momentum
- Support & Resistance Levels
- Potential Trade Signals
And the coolest part? It has elements that project into the future (the Cloud is plotted ahead!), something many other indicators don’t offer.
「Ichimoku Cloud: The All-in-One Trading System at a Glance」
Ichimoku’s Origin Story & Design: Why the Cloud?
This system isn’t some new fad. It was developed by a Japanese journalist named Goichi Hosoda, who wrote under the pen name Ichimoku Sanjin (“what a man in the mountain sees”), starting before World War II. He spent decades manually testing and refining it (imagine doing that without computers!) before finally publishing it in the 1960s.
Hosoda’s goal was to create a system that could quickly capture market equilibrium points. He believed the market exists in different states of balance across various timeframes, and Ichimoku aims to visualize these states.
Dissecting Ichimoku’s “Guts”:
Ichimoku has 5 lines + 1 Cloud, each playing a specific role:
- Tenkan-sen (Conversion Line / TS): (Highest High + Lowest Low) / 2, calculated over the past 9 periods.
- Role: The fastest line, like a short-term MA, reflecting short-term momentum and equilibrium. Acts as a signal line or minor support/resistance.
- Kijun-sen (Base Line / KS): (Highest High + Lowest Low) / 2, calculated over the past 26 periods.
- Role: The mid-term equilibrium line, slower than Tenkan. It’s a very important trend confirmation line and key support/resistance level within the Ichimoku system. Price staying consistently above/below the KS indicates a more stable trend.
「Ichimoku Core Lines: Tenkan (Fast) & Kijun (Slow/Baseline)」

3. Senkou Span A (Leading Span A / SSA): (Tenkan-sen + Kijun-sen) / 2, then the result is plotted 26 periods ahead.
-
- Role: The average of TS and KS, representing the midpoint of short and mid-term equilibrium, projected into the future. It forms one edge of the “Cloud.”
4. Senkou Span B (Leading Span B / SSB): (Highest High + Lowest Low) / 2, calculated over the past 52 periods, then the result is plotted 26 periods ahead.
-
- Role: The long-term equilibrium line, the slowest of the 5 lines, representing longer-term balance, also projected into the future. It forms the other edge of the “Cloud.”
5. Kumo (Cloud): The area between Senkou Span A and Senkou Span B, shaded in.
-
- Role: This is Ichimoku’s most iconic feature! It represents a dynamic, thick zone of future support and resistance.
- Cloud Color: Typically green when SSA > SSB (bullish), red when SSA < SSB (bearish). A color change (Kumo Twist) can signal a potential future trend shift.
- Cloud Thickness: Thick cloud = strong S/R, potentially higher volatility; Thin cloud = weak S/R.
- Price vs. Cloud: Where the price is relative to the cloud is crucial for trend assessment (more below).
「Soul of Ichimoku: The Kumo (Cloud) – Future Support/Resistance」
6. Chikou Span (Lagging Span / CS): The current closing price plotted 26 periods back.
-
- Role: Like a time machine, it compares the current price to the price 26 periods ago. It’s a confirmation signal, checking if the current price has broken free from past support/resistance levels.
「Ichimoku Confirmation Line: Chikou (Lagging) – Checking the Past」
Ichimoku Basic Plays (Beginner’s Checklist):
Ichimoku is a system; you need to combine all elements for a complete picture:
- Read the Trend Direction:
- Price vs. Kumo:
- Price above the Cloud → Overall uptrend.
- Price below the Cloud → Overall downtrend.
- Price inside the Cloud → Trend unclear / Consolidation / Transition zone, higher trading risk.
- Future Kumo: Look at the color and direction of the cloud ahead for future trend bias (Green cloud sloping up = bullish; Red cloud sloping down = bearish).
- Kijun-sen (Baseline): Price consistently holding above/below KS also confirms the trend.
- Spot Support & Resistance:
- Kumo (Cloud): The strongest S/R zone. Price pulling back to the top of the cloud in an uptrend, or rallying to the bottom of the cloud in a downtrend are key areas. Thicker cloud = stronger S/R.
- Kijun-sen (Baseline): Significant mid-term S/R.
- Tenkan-sen (Conversion Line): Minor short-term S/R.
- Look for Momentum & Entry Signals (Combine for Confirmation!):
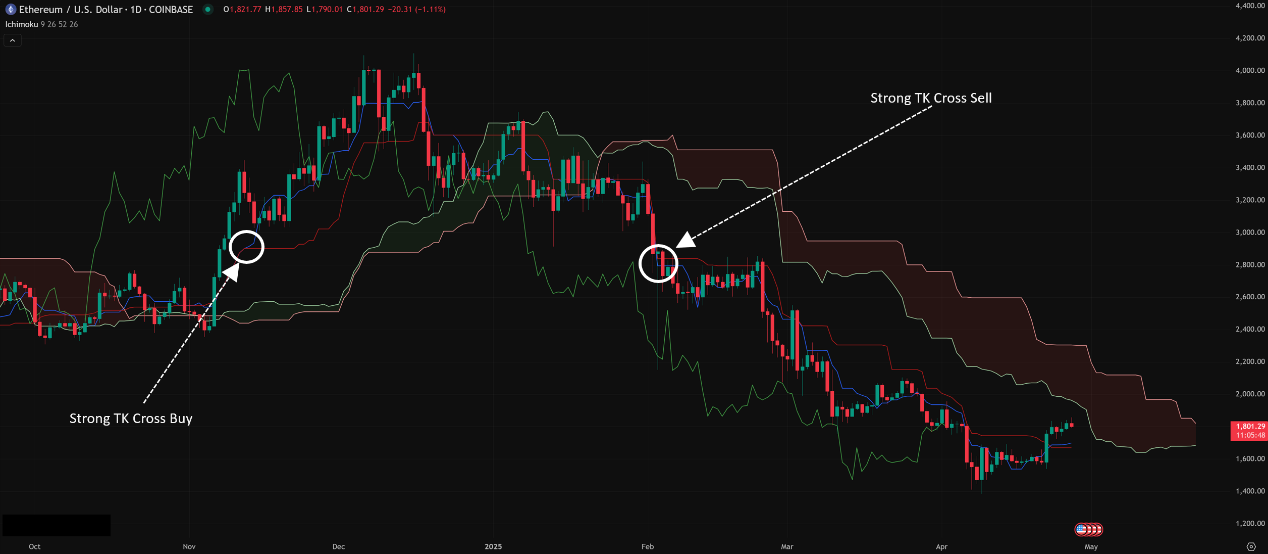
- Tenkan / Kijun Cross (TK Cross):
- TS (Fast) crosses ABOVE KS (Slow): Potential Weak Bullish Signal.
- TS (Fast) crosses BELOW KS (Slow): Potential Weak Bearish Signal.
- Signal Strength Depends on Location vs. Cloud:
- Bullish cross above the Cloud → Strong Buy Signal.
- Bearish cross below the Cloud → Strong Sell Signal.
- Cross happens inside the Cloud → Neutral/Weak Signal.
「TK Cross Signal + Cloud Location = Strength Gauge」
4. Check for Confirmation:
-
- Chikou Span (Lagging Span) vs. Price/Cloud:
- When a buy signal occurs (TK cross, cloud breakout), if the CS is above the price from 26 periods ago, and ideally also outside the cloud → Buy signal confirmed.
- When a sell signal occurs, if the CS is below the price from 26 periods ago, and ideally also below the cloud → Sell signal confirmed.
- If CS is still stuck inside the price candles or the cloud from 26 periods ago → Signal NOT confirmed, wait.
「The Lagging Span (Chikou): The Final Check」
5. Look for Future Warnings:
-
- Kumo Twist: The future cloud changes color (green to red or vice versa). This suggests a potential trend change 26 periods from now. It’s an early warning sign.
Ichimoku Advanced Plays & Parameter/Timeframe Breakdown (Pro Zone):
Parameter Settings: Sacred Ground?
- Classic Default Parameters: 9, 26, 52
- Tenkan-sen: 9
- Kijun-sen: 26
- Senkou Span B: 52
- (SSA period is derived from TS/KS; Chikou/Kumo shifts are also 26)
- Why 9, 26, 52?
- These were based on the Japanese stock market trading schedule back in Hosoda’s day:
- 9 ≈ 1.5 weeks (Japan had 6-day work weeks then)
- 26 ≈ 1 month
- 52 ≈ 2 months
- He believed these cycles captured short, medium, and long-term market equilibrium.
- Traditionalists vs. Reformers:
- Many Ichimoku purists (especially in Japan and traditional circles) consider these parameters sacred! They argue changing them breaks the system’s balance and Hosoda’s intent.
- Their reasoning: Ichimoku already incorporates multiple timeframes; adjusting parameters isn’t necessary. Plus, widespread use of defaults creates a self-fulfilling prophecy.
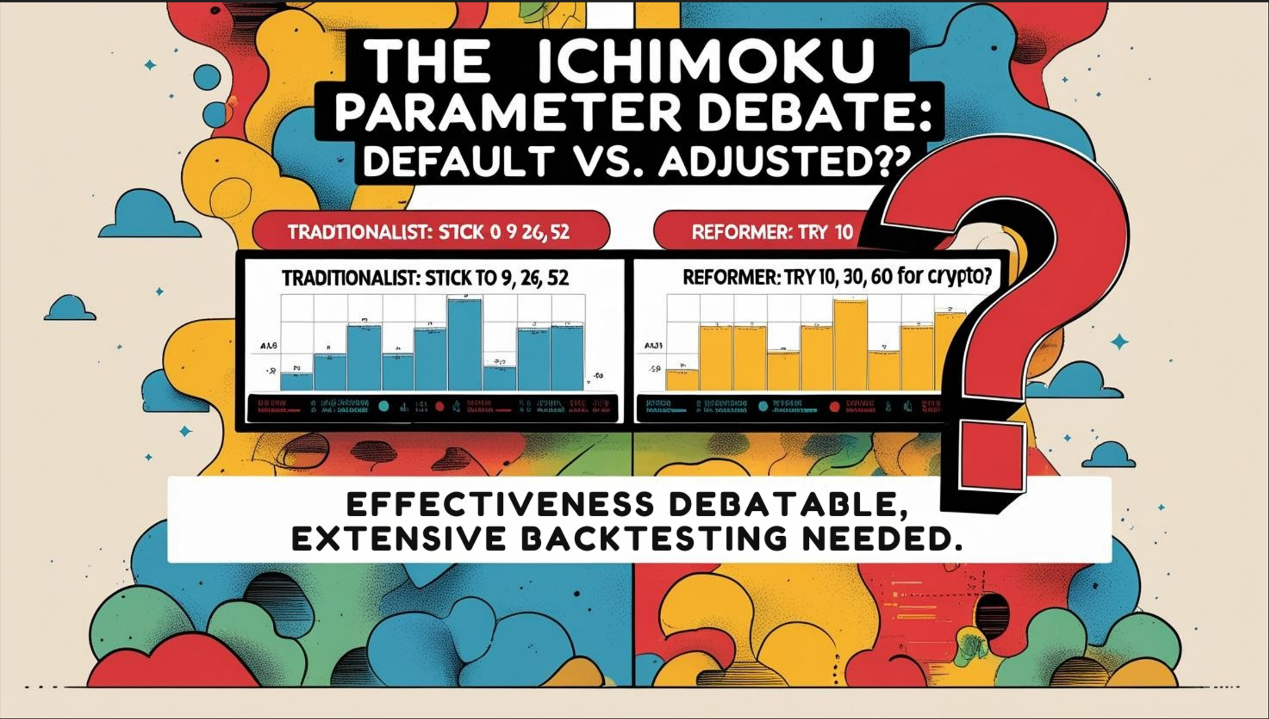
The Crypto / 24-Hour Market Debate & Parameter Adjustments:
- The Issue: The 9, 26, 52 settings were based on a 6-day trading week. Crypto trades 24/7. Do the defaults still work?
- Reformer Attempts (Common adjustments, but HIGHLY Controversial!):
- Combo 1 (Attempting 24-hr adaptation): 10, 30, 60
- Tenkan: 10 (~1/3 month)
- Kijun: 30 (~1 month)
- Senkou B: 60 (~2 months)
- (Forward/Backward shift also changed to 30)
- Combo 2 (Doubled Periods): 20, 60, 120
- Tenkan: 20
- Kijun: 60
- Senkou B: 120
- (Forward/Backward shift also changed to 60)
- The Idea: Trying to align periods better with 24/7 trading, or simply doubling periods to slow down reactions and filter more noise in volatile markets.
- How Do They Perform? Which is Hottest?
- No Consensus! And Heavily Dependent on Backtesting!
- Many who test find that while modified parameters might perform better in specific market conditions or periods, they might perform worse in others, potentially even losing some of Ichimoku’s original characteristics (like the Kijun’s stability as an equilibrium point).
- The “hottest” approach, especially for learners, is still sticking with the default 9, 26, 52! Master interpreting the system with defaults first. Only consider adjustments after becoming highly proficient and having substantial data to back it up.
- Interpretation skill > Parameter tweaking! A skilled Ichimoku trader can do well with defaults.
「The Ichimoku Parameter Debate: Default vs. Adjusted? 」
Timeframe Analysis:
- Ultra Short-Term (M1, M5, M15):
- Highly NOT Recommended! On these timeframes, Ichimoku lines become extremely volatile, the cloud gets very thin or twists constantly, and the Chikou Span tangles with price endlessly. Signals are chaotic, interpretation is difficult, false signals galore.
- Conclusion: Ichimoku’s core strength lies in seeing mid-to-long term balance; it’s unsuitable for scalping or hyper-short-term trading.
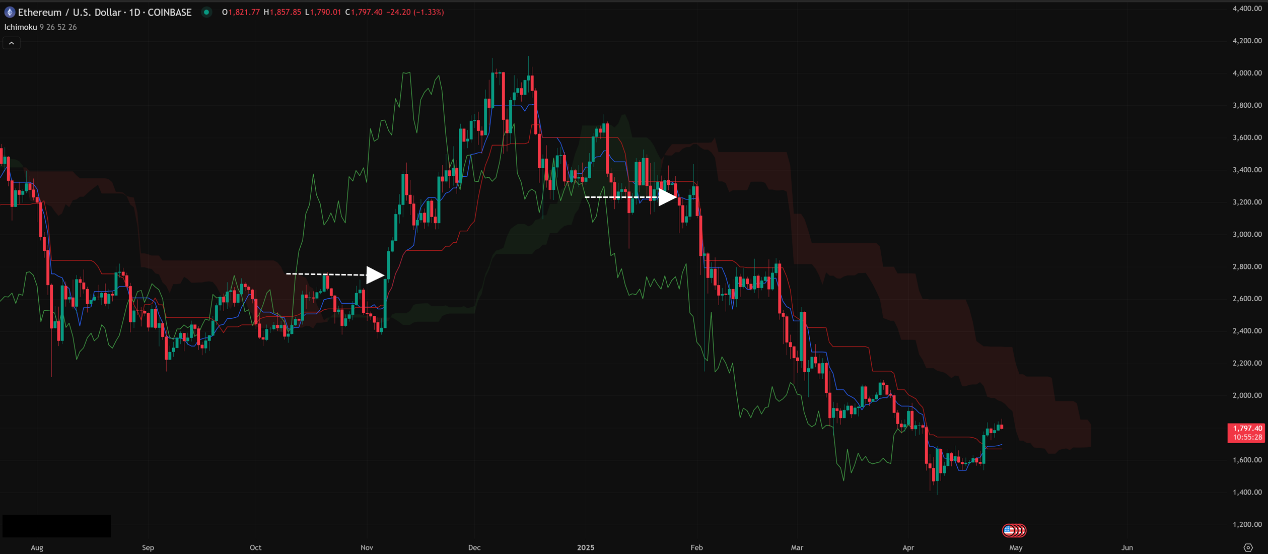
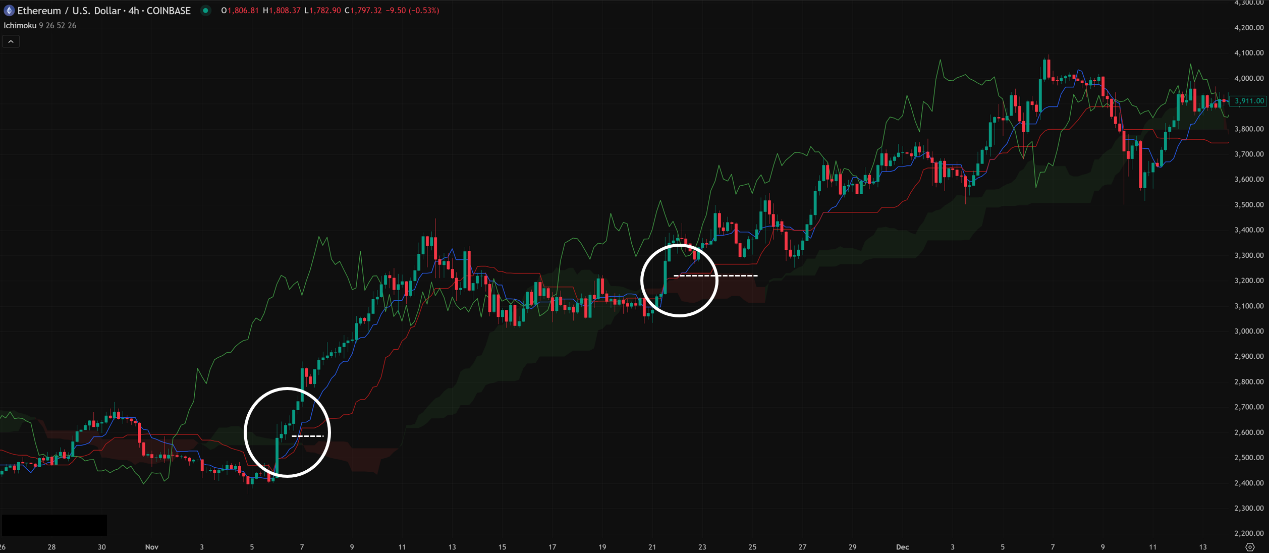
- Intraday / Short Swing (H1, H4):
- Starts making sense, especially H4! H1 is relatively short, the cloud can still be volatile, but the H4 timeframe starts providing more stable trend direction and S/R zones.
- How to Use: Can gauge intraday or multi-day trend bias, look for potential trend-following pullback opportunities (e.g., pullback to H4 Kijun or Cloud). TK crosses and Chikou confirmation remain important.
- Example: H4 price above cloud, Kijun angling up, Chikou free – bullish bias. Wait for an H1 bullish TK cross + Chikou confirmation to consider entry.
「Ichimoku on 4-Hour Chart: Gaining Clarity」
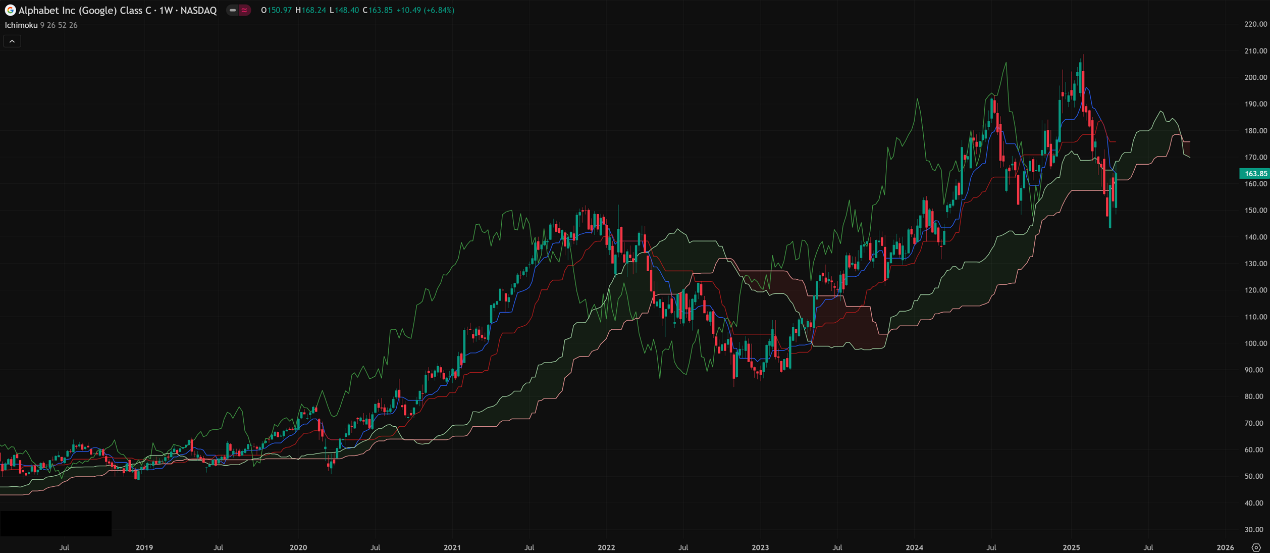
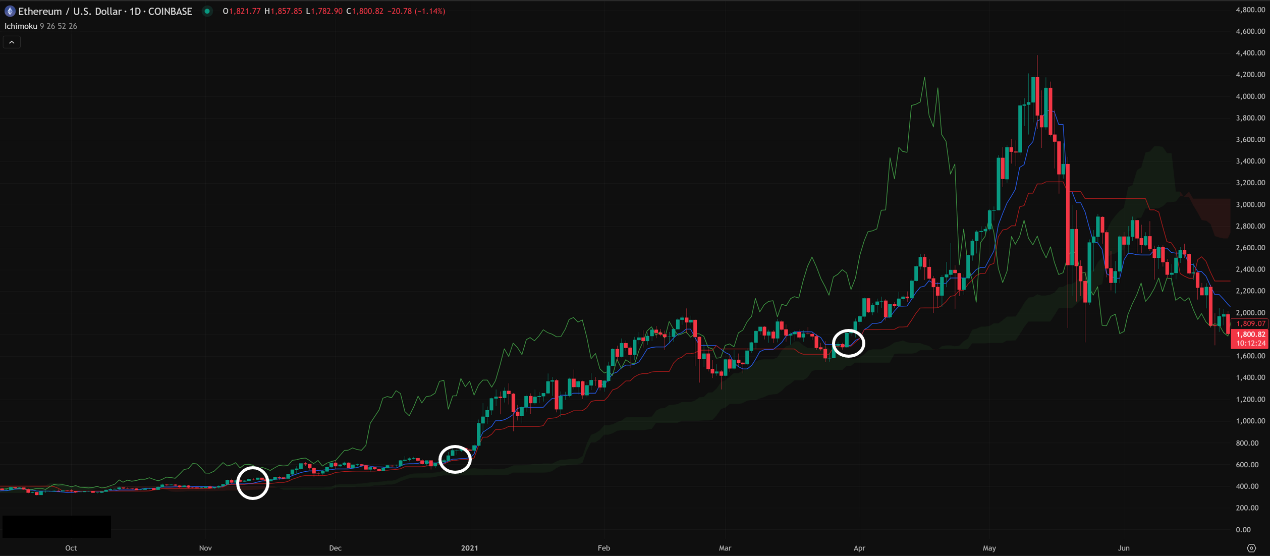
- Swing / Long-Term (Daily, Weekly):
- Ichimoku’s Prime Time! Best Performance Stage! On these longer timeframes, all elements work together beautifully. The Cloud provides broad and strong S/R, Kijun is a reliable trendline, TK crosses carry more weight, and Chikou confirmation is more dependable.
- How to Use:
- Determine major market trend (Price vs. Cloud, Future Cloud).
- Use Kijun or Cloud as mid-to-long-term buy/sell zones.
- Use TK crosses with Chikou confirmation to catch swing opportunities.
- Use Kumo Twists as early warnings for potential long-term trend shifts.
「Ichimoku on Daily/Weekly: Optimal Use Case」
Summary: Which Parameter Combo + Timeframe is Hottest & Most Effective? How to Use It?
- Parameters: (9, 26, 52) is the Gold Standard! Master it first.
- Timeframe: Daily / Weekly Rules! H4 is a practical secondary timeframe. H1 or lower requires extreme caution.
- Hottest / Most Effective Usage = Holistic Analysis Approach:
- Top-Down Analysis: Start with Weekly/Daily to establish the major trend and key S/R (Cloud/Kijun).
- Current Situation: Where is price relative to Cloud? Kijun? Tenkan?
- Future Outlook: What does the Future Kumo look like? Thickness? Color? Direction? Any Kumo Twists?
- Past Confirmation: Is the Chikou Span free or obstructed?
- Signal Hunting: Look for TK crosses or price breaks of Kijun/Cloud in alignment with the major trend.
- Confluence: While Ichimoku is comprehensive, combining it with traditional S/R, trendlines, patterns, or even Volume can improve probability.
Ichimoku Isn’t Just an Indicator, It’s a Philosophy!
Ichimoku Kinko Hyo is a powerful and elegant system. Its beauty lies in:
- Integration: Combines multiple analytical elements on one chart.
- Forward-Looking: The Kumo provides future S/R projections.
- Multi-Dimensional: Considers trend, momentum, and S/R simultaneously.
But its challenges include:
- Visually Busy: Can overwhelm beginners.
- Lagging Elements: Chikou Span and Kumo inherently involve past calculations.
- Requires Practice: Not instantly intuitive; takes time to understand the interplay of elements.
- Parameter Debate: Especially in non-traditional markets.
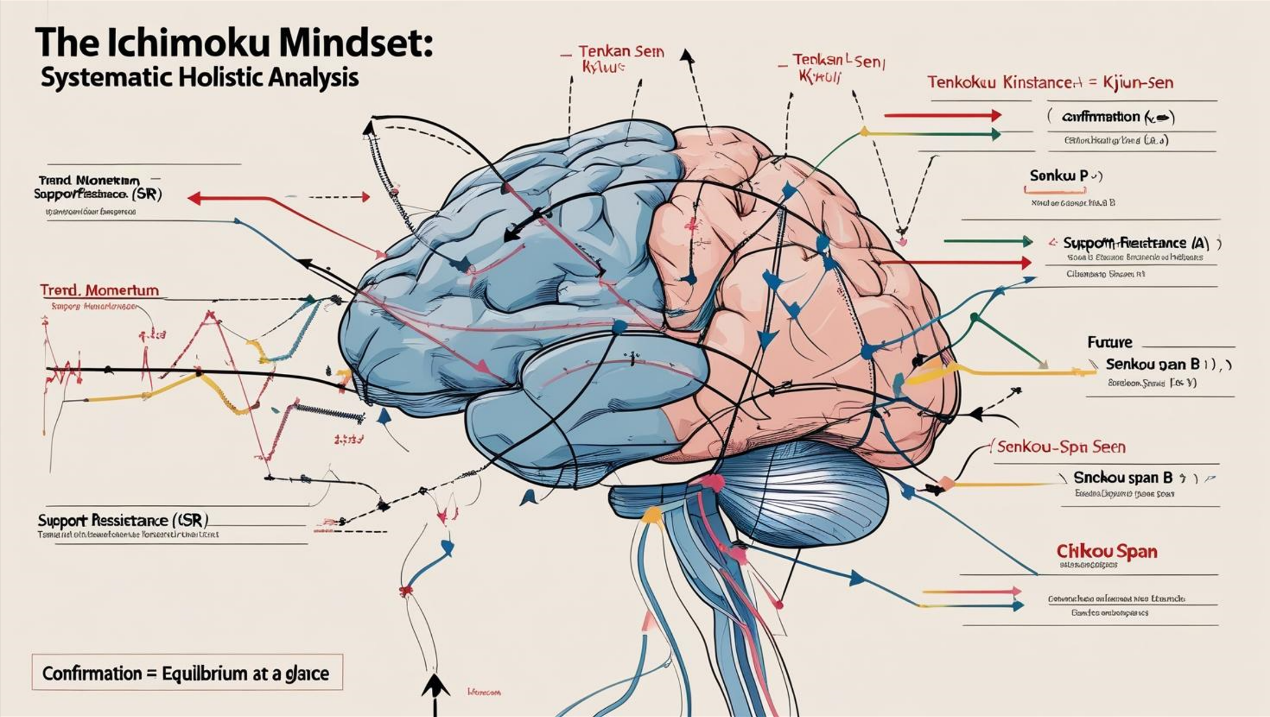
「The Ichimoku Mindset: Systematic Holistic Analysis」
Hope this deep dive into Ichimoku helps you understand this Japanese masterpiece! Don’t be intimidated by its complexity; invest the time to study it, and it could become a powerful ally on your trading journey!
Next Steps:
- Add Ichimoku (using default 9, 26, 52) to your Daily and H4 charts.
- Study each element individually: Price vs. Cloud? Price vs. Kijun? TK Cross locations? Where’s Chikou? What’s the Future Kumo doing?
- Find examples that meet all the bullish/bearish criteria according to the Ichimoku system.
- Backtest! Backtest! Backtest! Especially if you’re tempted to change parameters – let the data guide you!
Wishing you successful learning and profitable trading! ☁️📈