Yo! Check Check! What’s up, Market Hustlers and Crypto Natives! In your technical analysis arsenal, is there one tool you see every day, on every platform, but maybe haven’t truly maxed out? Today, we’re unlocking that TA legend, the “evergreen,” the “Swiss Army knife” indicator that practically everyone knows – the MACD (Moving Average Convergence Divergence)!
Yeah, you know the one – those two lines crossing each other below your price chart, plus those red and green histogram bars? That’s the MACD! It looks simple, but it’s actually a powerful tool combining Trend Following and Momentum analysis!
Wanna know why those two lines (MACD line & Signal line) and the histogram are so important? How to use them to find buy/sell signals? How to use “Divergence” to spot potential reversals? Why some call MACD the “King of Indicators”? Okay! Let’s dive deep, from basics to advanced techniques, and completely dissect this classic indicator! Let’s get this MAC Dizzle!
MACD Indicator: The Origin Story (The King of Oscillators?)
MACD is practically royalty in the world of technical indicators, massively influential.
- The Inventor: Gerald Appel – In the late 1970s, Appel (a professional money manager and market technician) developed the MACD. His goal was to create a tool that could show both trend direction and momentum strength, while being more responsive than simple moving average crossovers.
- Design Concept: The Distance Between Fast & Slow Lines – His core idea was to compare the difference between two Exponential Moving Averages (EMAs) of different speeds.
- When the shorter-term EMA (fast line) crosses above the longer-term EMA (slow line), it indicates strengthening short-term upward momentum, and the difference between them goes from negative to positive and widens.
- When the fast line crosses below the slow line, it indicates strengthening short-term downward momentum, and the difference goes from positive to negative and widens.
- The MACD Line itself simply plots this difference between the fast and slow EMAs.
- Adding the Signal Line & Histogram: To make signals clearer, Appel (or possibly others refining the indicator later) added:
- Signal Line: An EMA of the MACD Line itself, creating a smoother, slower line. Crossovers between the MACD Line and its Signal Line became popular buy/sell signals.
- Histogram: Directly plots the distance between the MACD Line and the Signal Line as bars. This histogram can show accelerating or decelerating momentum before the lines actually cross.
- Purpose: Providing Trend Direction, Momentum Changes, and Trade Signals – Through the interplay of the MACD line (vs. zero), the MACD/Signal line crossover, and the Histogram’s behavior, MACD offers a relatively complete framework for analyzing trend initiation, acceleration, weakening, and potential reversal.
So, MACD was born to overcome the lag of traditional MA crossovers, creating a more sensitive, multi-dimensional tool for trend and momentum analysis, becoming globally popular due to its practicality.
How MACD is Designed (The Recipe – EMA Magic!)
MACD looks like it has three parts. How are they calculated?
- Step One: Calculate Two EMAs
-
- First, set two EMA periods. The standard setting uses the Close price:
- Fast EMA: Typically 12 periods.
- Slow EMA: Typically 26 periods.
- EMAs give more weight to recent data, making them react faster than Simple Moving Averages (SMAs).
2. Step Two: Calculate the MACD Line
-
- MACD Line = Fast EMA (12) – Slow EMA (26)
- This line is simply the difference between the fast and slow EMAs. It oscillates above and below a Zero Line.
- MACD Line > 0: Fast EMA is above Slow EMA, short-term trend bias is bullish.
- MACD Line < 0: Fast EMA is below Slow EMA, short-term trend bias is bearish.
- The further the MACD Line is from zero, the wider the gap between the EMAs, potentially indicating stronger momentum.
3. Step Three: Calculate the Signal Line
-
- Signal Line = 9-period EMA of the MACD Line
- This smooths out the MACD Line itself, creating a slower reference line.
4. Step Four: Calculate the Histogram
-
- MACD Histogram = MACD Line – Signal Line
- The Histogram shows the distance between the MACD Line and its own Signal Line.
- Histogram > 0 (Often green bars): MACD Line is above Signal Line; upward momentum might be increasing. Taller bars = wider gap.
- Histogram < 0 (Often red bars): MACD Line is below Signal Line; downward momentum might be increasing. Lower bars (more negative) = wider gap.
- Histogram moving towards Zero: MACD Line and Signal Line are converging; momentum might be weakening.
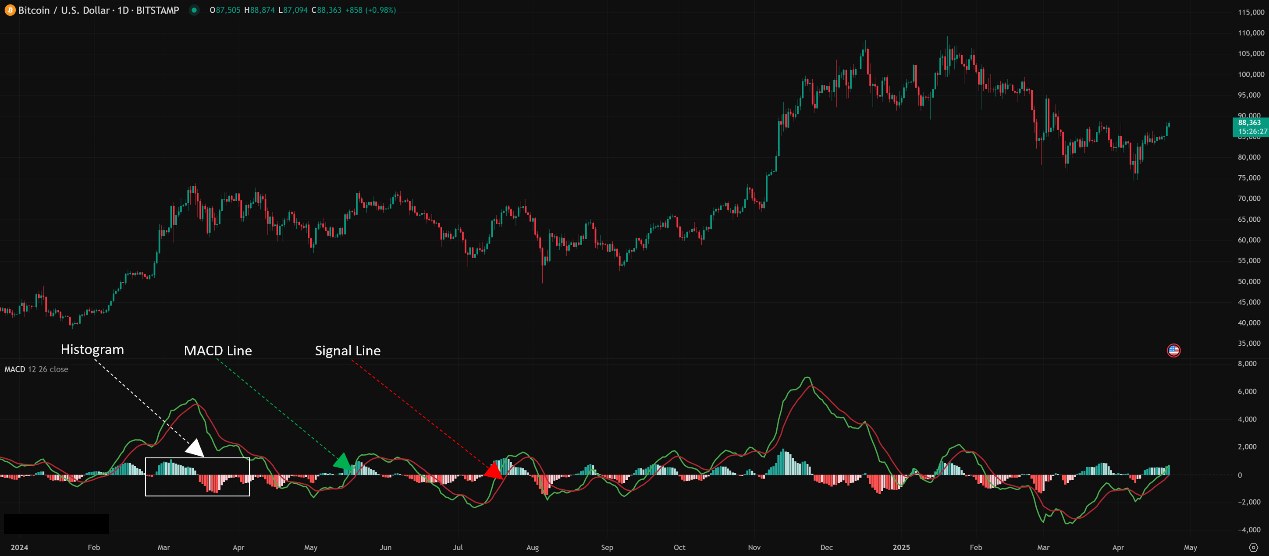
The Final Result: Below your chart, you’ll see:
- One MACD Line (difference between fast/slow EMAs)
- One Signal Line (smoothed MACD Line)
- A series of Histogram bars around a zero line (distance between MACD & Signal)
Think of Two Race Cars:
- 12 EMA is the fast car, 26 EMA is the slow car.
- MACD Line: How far ahead (positive) or behind (negative) the fast car is.
- Signal Line: The “average” lead/lag distance of the fast car (smoother).
- Histogram: The difference between the fast car’s current lead/lag and its average lead/lag. A widening gap means acceleration; a shrinking gap means deceleration.

「The Three Elements of MACD Explained」
_________________________________________________________________________________
Basic & Advanced Ways to Use MACD (From Basic Crosses to Divergence Power)
MACD offers diverse applications, from simple crossovers to powerful divergence signals.
Level 1: Basic Usage – Crossovers & Zero Line
- MACD Line / Signal Line Crossover: The Most Common Signal!
-
- Golden Cross (Bullish): When the MACD Line (fast) crosses ABOVE the Signal Line (slow), it’s a potential buy signal. Suggests short-term upward momentum is overtaking medium-term momentum; trend may strengthen or reverse up.
- Death Cross (Bearish): When the MACD Line crosses BELOW the Signal Line, it’s a potential sell signal. Suggests short-term downward momentum is overtaking medium-term momentum; trend may weaken or reverse down.
- Signal Strength: Crossovers occurring further away from the Zero Line are often considered stronger. The Histogram flipping from negative to positive (Golden Cross) or positive to negative (Death Cross) visually confirms the cross.
- Caution: Crossovers can generate many false signals in choppy, sideways markets! Best used with trend confirmation.

Unlock Next-Level MACD Plays: Catch Real Market Power!
Stop settling for basic MACD crosses! Wanna trade like a Pro? Learn these two hidden MACD power moves to snag stronger opportunities in Crypto and all financial markets!
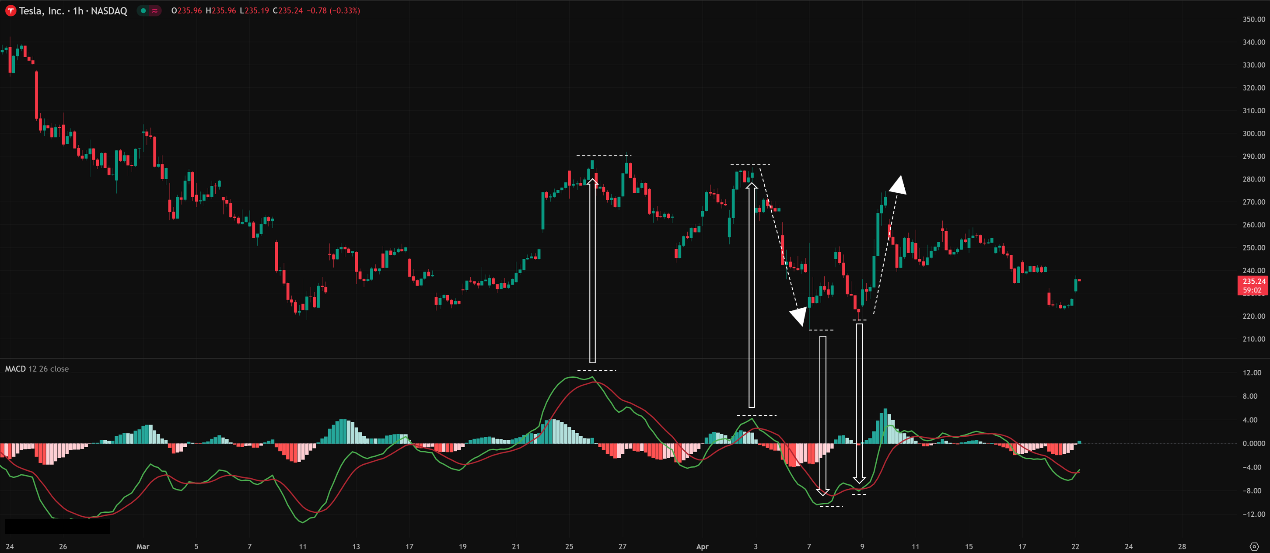
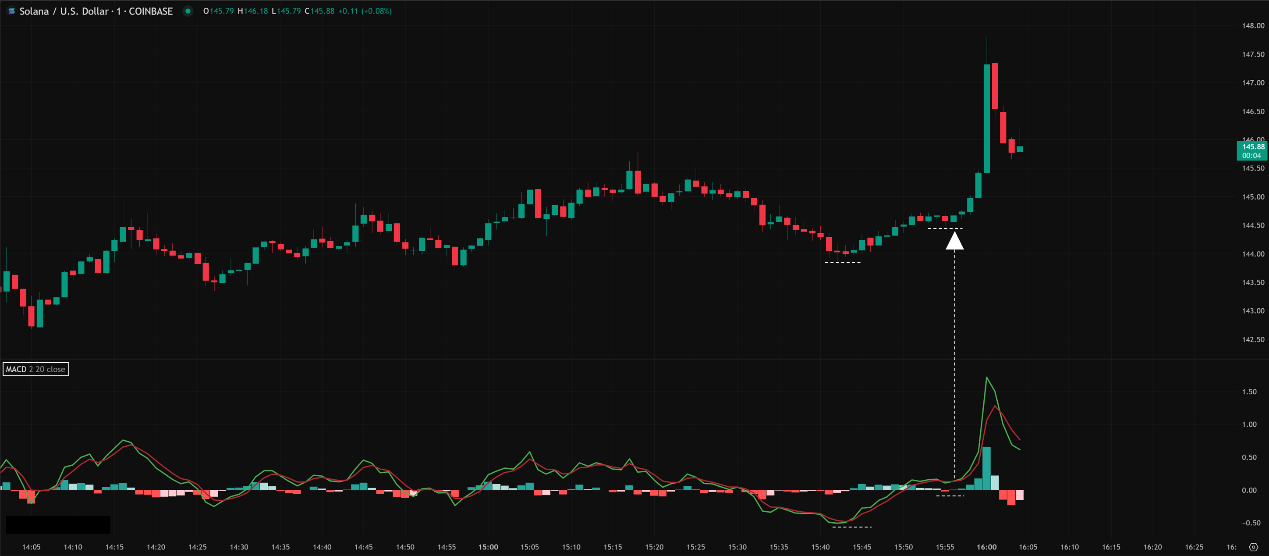
「MACD “Tailwind Thrust” Golden Cross & “Sinking Ship” Death Cross Examples」
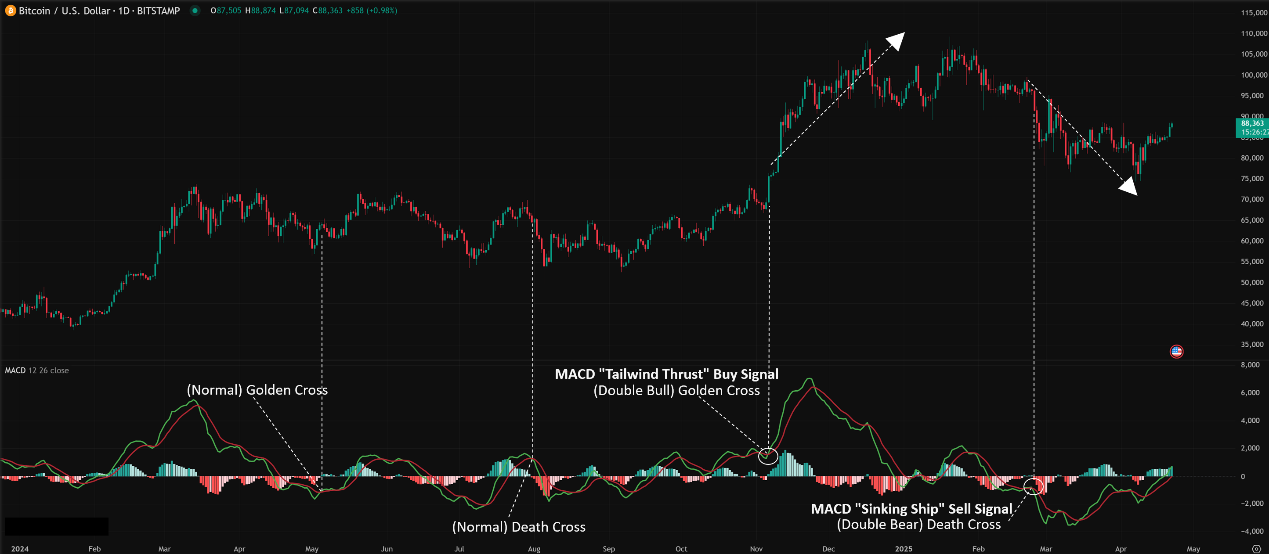
MACD “Tailwind Thrust” Buy Signal
- The Playbook:
- Step 1 – Check the Vibe: First off, is the MACD line already chilling above the zero line? That means the market’s overall trend is bullish – you’ve basically got the wind at your back. The trend is your friend here!
- Step 2 – Hit the Gas: Now, here’s the kicker! When that MACD line, while already above zero, makes a powerful move UP and breaks THROUGH the Signal line… BOOM! Think of it like you’re already cruising on the highway in a fast car, and you just slammed the turbo boost!
- What’s It Really Mean?
- This ain’t your average, maybe-maybe-not Golden Cross. This is the market screaming: “Yo! The upward momentum might be about to LEVEL UP!” You’re not fighting the current; you’re riding the wave of momentum. This could signal the start of a stronger surge or an acceleration point in the main uptrend. If you’re looking for a strong buy confirmation, this is a big one!
⚓MACD “Sinking Ship” Sell Signal
- The Playbook:
- Step 1 – Spot the Danger: First things first, has the MACD line already sunk below the zero line? If yes, the overall trend is bearish. The ship is taking on water, folks!
- Step 2 – BAIL OUT! Then, here comes the major alert! If that MACD line, while already below zero, breaks DOWN decisively BELOW the Signal line… Uh oh. It’s like the ship was already leaking, and now the engine just died, or maybe someone’s drilling holes below deck – brace for an accelerated dive!
- What’s It Really Mean?
- This isn’t just some minor pullback Death Cross. This is a serious “re-confirmation” of bearish power. It’s a massive Red Flag telling you the market might keep plunging, maybe even further than you think. Seeing this signal means pay close attention. It could be a strong hint to get out NOW (Exit Strategy!) or even look for a prime shorting opportunity. Protect that capital!
Remember:
- These are advanced MACD techniques. They filter signals by combining them with the overall trend direction, making them generally more reliable than looking at simple crossovers alone.
MACD Line vs. Zero Line: Gauging the Overall Trend
- MACD Line > 0: Indicates Fast EMA > Slow EMA; market generally in an uptrend or bullish bias prevails.
- MACD Line < 0: Indicates Fast EMA < Slow EMA; market generally in a downtrend or bearish bias prevails.
- MACD Line Crossing Zero:
- Crossing Above Zero: A stronger bullish confirmation, showing significant short-term strength relative to the long term.
-
- Crossing Below Zero: A stronger bearish confirmation.
- How to Use: Filter crossover signals based on the MACD Line’s position relative to zero. E.g., only take Golden Crosses when MACD is already > 0 (trading with the broader trend).
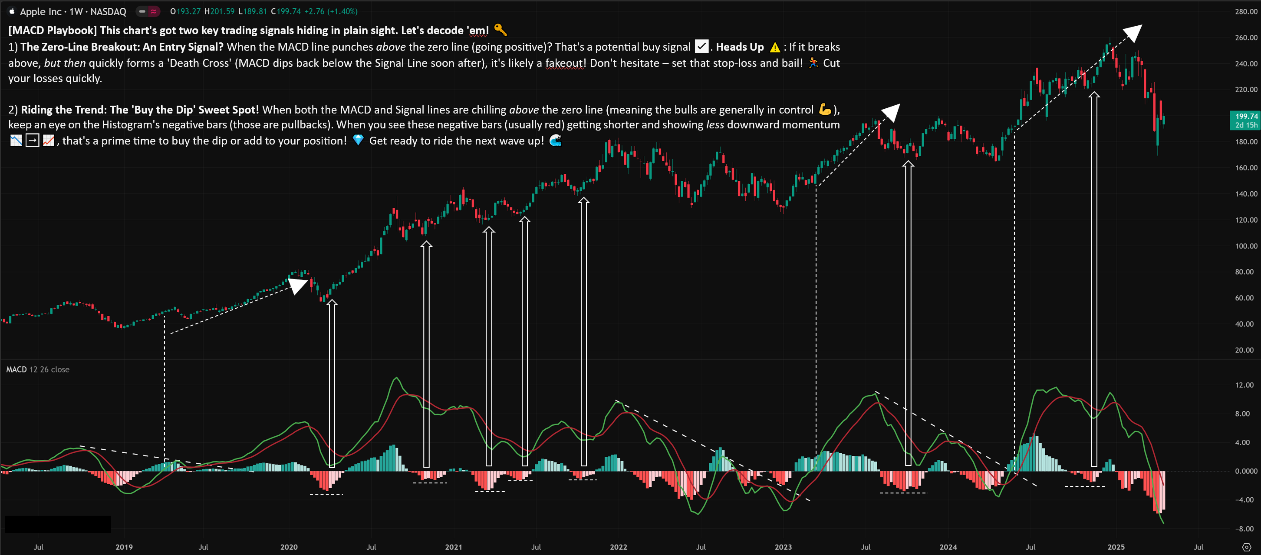
Level 2: Advanced Plays – Histogram & Divergence Mastery
- MACD Histogram: Early Clues to Momentum Shifts!
-
- Principle: The Histogram directly shows the gap between the MACD and Signal lines. Its changes often precede the actual line crossover!
- How to Use:
- Histogram Crossing Zero (Positive): Confirms Golden Cross.
- Histogram Crossing Zero (Negative): Confirms Death Cross.
- Histogram Peaks/Troughs Turning: This is key!
- When the Histogram (above zero) forms a Lower Peak than the previous peak, even if MACD is still above Signal, it warns that upward momentum is weakening. Potential pullback/reversal alert, earlier than a Death Cross!
- When the Histogram (below zero) forms a Higher Trough than the previous trough, even if MACD is still below Signal, it warns that downward momentum is weakening. Potential bounce/reversal alert, earlier than a Golden Cross!
- Histogram Slope: The rate of change in Histogram bar height also reflects accelerating or decelerating momentum.
「MACD Histogram Peak/Bottom Turning (Early Warning)」
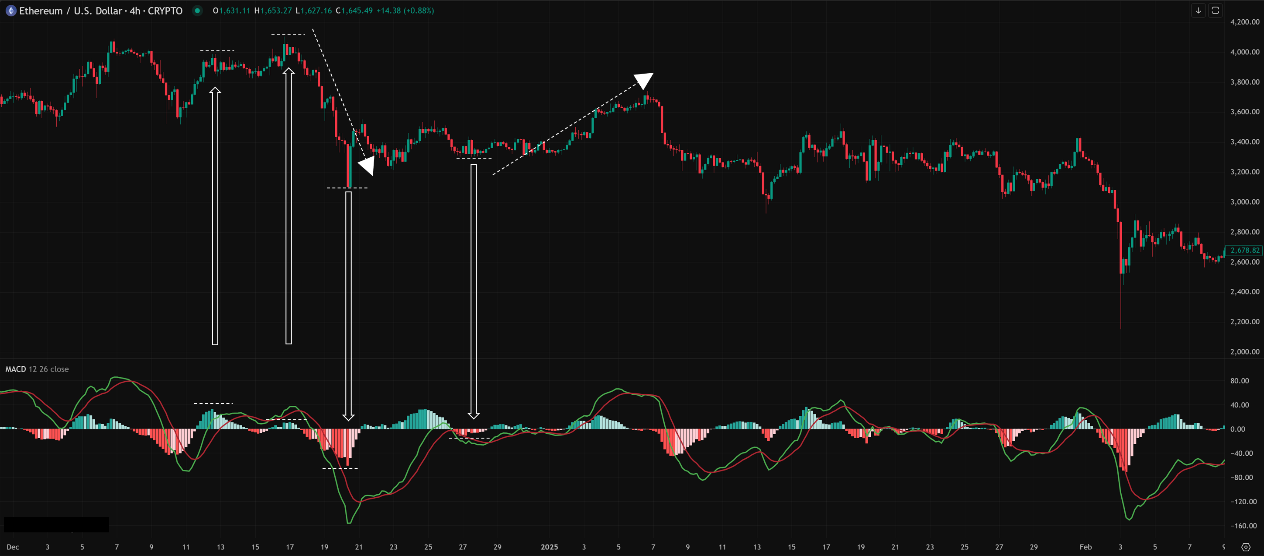
2. MACD Divergence: Powerful Reversal Signal!
- Principle: When price action and the MACD indicator (usually the MACD Line, sometimes the Histogram) move in opposite directions, it’s a classic and powerful potential reversal signal!
- Two Main Types:
-
- Bullish Divergence: Price makes a Lower Low (LL), but the MACD Line fails to make a new low, forming a Higher Low (HL) instead. Meaning: Although price fell lower, the underlying downward momentum is actually weakening.
- Bearish Divergence: Price makes a Higher High (HH), but the MACD Line fails to make a new high, forming a Lower High (LH) instead. Meaning: Although price pushed higher, the underlying upward momentum is actually weakening.
- How to Use:
-
- Divergence is a strong warning that the current trend might be exhausted.
- MUST Wait for Confirmation! Look for a MACD/Signal line crossover, a break of a key S/R level or trendline on the price chart, or a reversal candlestick pattern.
- Histogram Divergence: Sometimes the Histogram shows divergence even before the MACD line does, offering an earlier warning.
- Reliability: MACD divergence is considered one of the more reliable technical signals by many traders, especially when it appears on higher timeframes.
「MACD Bearish Divergence Example (Price vs. MACD Line) 」
Parameter Settings & Time Intervals (Parameters & Timeframes for MACD)
- Core Parameters: EMA Periods
- Standard / Default: (12, 26, 9)
- 12 = Fast EMA Period
- 26 = Slow EMA Period
- 9 = Signal Line (EMA of MACD Line) Period
- Why these numbers? Reportedly chosen by Gerald Appel based on his observations and testing in the markets of his time (possibly weekly charts?), aiming for a balance between responsiveness and smoothness. They have become the global standard.
- How Global Traders Play It?
- Vast Majority Use Default (12, 26, 9)! Because these settings have been widely used and tested for decades, and since so many people watch them, they can create a self-fulfilling effect to some extent.
- Fine-Tuning Experimenters:
- Faster Settings (e.g., (2, 20, 3) / (4, 8, 8) etc.): Some short-term traders might shorten the EMA periods and the Signal line period, hoping for earlier crossover signals.
- Effect: More signals, earlier signals, but dramatically increased false signals! Especially prone to whipsaws in ranging markets.
-
-
- Slower Settings (e.g., (21, 55, 9) / (19, 39, 9) etc.): Some longer-term traders might use longer EMA periods to filter more noise and catch only larger trend shifts.
- Effect: Fewer signals, more lag, but potentially more reliable.
- Adjustments for Crypto? Some argue crypto’s volatility needs faster settings. Others argue because it’s volatile, standard or slower settings are needed to filter noise. No consensus!
- Conclusion: For most people, especially beginners, sticking to the standard (12, 26, 9) is usually the best choice. If you really want to change it, do extensive backtesting and validation, knowing exactly why you’re changing it and the consequences.
- Timeframe:
- MACD is applicable on all timeframes.
- Short Timeframes (M1-M15): Crossovers are very frequent, many false signals. Mainly useful for watching Histogram changes or very short-term divergences, but reliability is low.
- Medium Timeframes (H1-H4): Commonly used trading timeframes. Crossover signals and divergences become more meaningful. Suitable for Day Trading / Swing Trading.
- Long Timeframes (D1, W1): Signals are most reliable! Daily or Weekly MACD crossovers and divergences often indicate significant trend changes and are closely watched by Swing and Position Traders.
Which Combos Are “Hot” & Effective? (Hottest & Effective Setups)
- No magic parameter “combo,” but the standard (12, 26, 9) is the most used and tested.
- The “Hottest” are Usage Combos:
- Setup 1 (Classic): MACD Divergence + Price Confirmation
- Execution: Spot clear MACD divergence on H4/D1 -> Wait for price to break a key S/R level or trendline, OR form a reversal candle pattern -> Enter.
- Effectiveness: High-quality signal for catching potential major turning points.
- Setup 2 (Trend Trading): Primary Trend + MACD Crossover + Zero Line Filter
- Execution: Identify primary trend with MAs or trendlines -> Only consider MACD crossovers in the direction of that trend -> Preferably enter when the MACD line is already on the “correct” side of the zero line for the crossover (e.g., MACD > 0 for a Golden Cross in an uptrend).
- Effectiveness: Filters counter-trend signals, increases probability of trend-following trades.
- Setup 3 (Early Warning): Histogram Peak/Trough Turn + Candle Signal
- Execution: Notice the Histogram forming a Lower Peak (uptrend) or Higher Trough (downtrend), even before a line cross -> Heighten alertness. If a reversal candle forms concurrently, consider acting earlier (but higher risk).
- Effectiveness: Can potentially capture momentum exhaustion earlier than line crossovers.
Best Parameter Combos? (Optimal Settings Verdict)
- Standard Parameters (12, 26, 9) are your baseline and best starting point!
- Timeframes: H1, H4, D1, W1 are where MACD typically performs most reliably.
- “Optimal” comes not from tweaking parameters, but from:
- Understanding the three MACD elements (Line, Signal, Histogram).
- Mastering the core uses (Crossovers, Zero Line, Divergence, Histogram).
- Combining MACD with Price Action, S/R, and Trend Analysis.
- Applying it on appropriate timeframes.
The Bottom Line: MACD – Your Trend & Momentum Navigator
MACD (Moving Average Convergence Divergence) is truly a versatile and highly valuable indicator in the technical analysis world. It successfully blends trend following with momentum analysis.
It helps you:
- Gauge the direction of short-term vs. long-term trends (MACD vs. Zero Line).
- Provide relatively timely trend shift/continuation signals (MACD/Signal Crossovers).
- Measure the acceleration or deceleration of momentum (Histogram).
- Spot potential major reversal points (Divergence).

For young traders looking for an indicator that covers both direction and strength, MACD is a fundamental tool you absolutely need to master! Its versatility allows it to be incorporated into many different trading strategies.
Remember:
- (12, 26, 9) are the standard parameters; usually no need to change.
- Crossovers, Zero Line, Histogram, Divergence are the four core uses.
- Divergence is powerful but MUST be confirmed!
- Histogram offers early momentum warnings.
- Higher timeframe signals are more reliable.
- Always combine with Price Action and other analysis!
Alright! Hope this super-detailed breakdown of MACD helps you unleash its full potential! Start using it to navigate your trades! See ya next time! Keep tracking the momentum!