Physical Address
304 North Cardinal St.
Dorchester Center, MA 02124
Physical Address
304 North Cardinal St.
Dorchester Center, MA 02124
Alright Crew! Let’s keep the heat on! After tackling the ATR “risk ruler,” today we’re diving into another beast in the technical analysis arena, one that’s like the “enhanced version” or “brother” of RSI – say hello to the MFI (Money Flow Index)!
Ever feel like RSI is useful, but maybe missing something? Wanna know, beyond just price up or down, how strong the actual buying or selling pressure (aka money flow) is? MFI aims to do just that by combining Price and Volume to give you a more comprehensive “market thermometer” and “money pressure gauge”!
It’s kinda like OBV in that it looks at volume, but the calculation and application are different. Ready to find out how MFI helps spot overbought/oversold conditions and potential reversals through divergence? Wanna know how to max out this indicator? Alright! Let’s jump straight into the world of MFI and break it down inside and out! Let’s roll!
MFI didn’t just appear out of thin air; its design concept has deep ties to an indicator everyone knows well.
Designers/Promoters: Gene Quong and Avrum Soudack – While maybe not as household a name as J. Welles Wilder Jr. (RSI’s inventor), they were clearly inspired by RSI when designing MFI.
Core Idea: Volume-Weighted RSI – This is probably the quickest way to understand MFI. RSI primarily looks at the relative strength of upward vs. downward price movements over time. But MFI’s creators felt that just looking at price magnitude wasn’t the whole picture; volume is key to reflecting buying and selling pressure.
If price rises but volume is weak, the rally might lack conviction.
If price falls but volume is huge, the selling pressure is real.
Purpose: Adding Volume to Measure “Money Flow” – MFI aims to measure how much “money” (volume) is behind each price move. Instead of just accumulating volume (like OBV), it determines if the “money flow” for each period is positive or negative and then uses an RSI-like calculation to create an oscillator ranging from 0 to 100.
So, MFI was born to create a momentum indicator that combines price and volume, potentially offering more reliable overbought/oversold and divergence signals than price-only indicators like RSI.
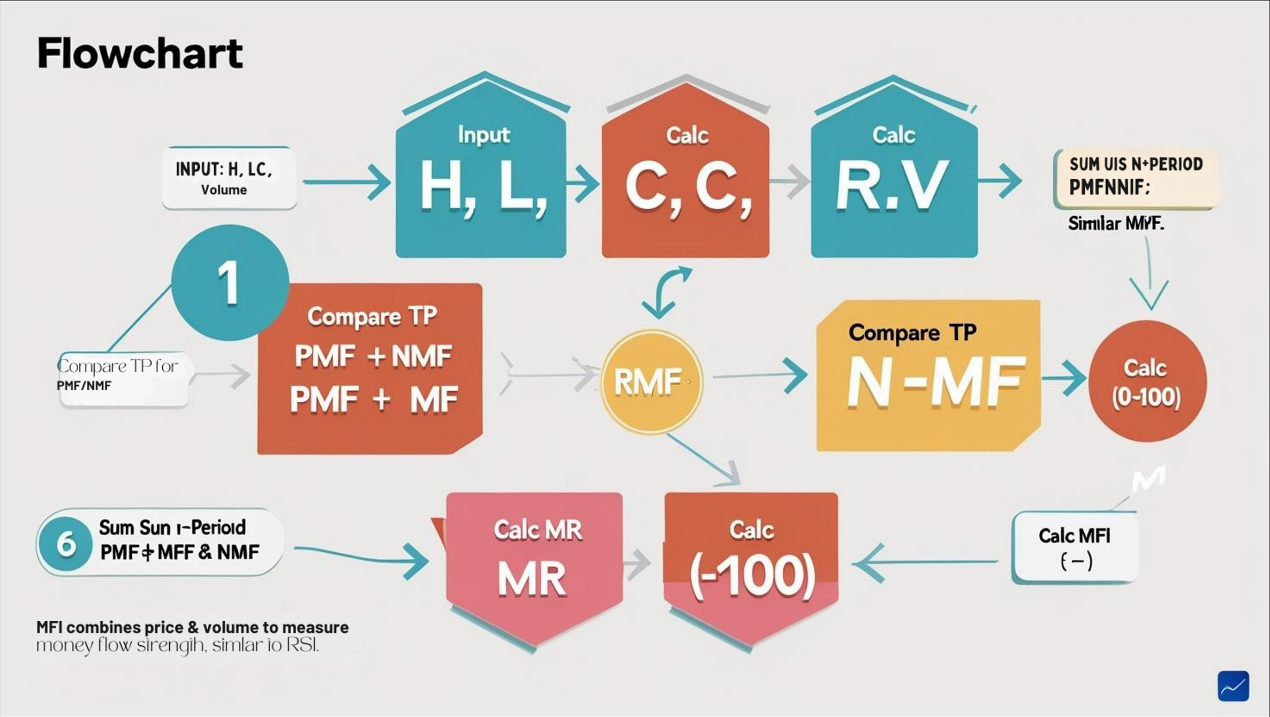
MFI’s calculation is a bit more involved than OBV’s, but follow these steps, and it’s not too bad:
Step 1: Calculate Typical Price (TP)
TP for each period = (High + Low + Close) / 3
This tries to find a single price that better represents the period’s overall trading level than just the close price.
Step 2: Calculate Raw Money Flow (RMF)
RMF for each period = Typical Price (TP) * Volume for that period
This step essentially multiplies price by volume, giving a concept of the “total value traded” for the period.
Step 3: Determine Positive Money Flow (PMF) and Negative Money Flow (NMF)
Compare today’s TP with yesterday’s TP:
If Today’s TP > Yesterday’s TP: Today’s RMF is considered Positive Money Flow (PMF). Today’s NMF = 0. (Price center moved up, value traded is seen as inflow).
If Today’s TP < Yesterday’s TP: Today’s RMF is considered Negative Money Flow (NMF). Today’s PMF = 0. (Price center moved down, value traded is seen as outflow).
If Today’s TP = Yesterday’s TP: PMF = 0, NMF = 0.
Step 4: Calculate Total Money Flow over a Period (N)
Set a parameter period N (default is 14 periods).
Sum up all the PMF over the last N periods to get Total N-Period PMF.
Sum up all the NMF over the last N periods to get Total N-Period NMF.
Step 5: Calculate Money Ratio (MR)
MR = (Total N-Period PMF) / (Total N-Period NMF)
Step 6: Calculate MFI!
MFI = 100 – [100 / (1 + MR)]
(Does that formula look familiar? Yep! It’s the same structure as the latter part of the RSI formula! The difference is RSI uses average price gains/losses, while MFI uses the ratio of positive/negative money flow.)
The Final Result: MFI is an oscillator that swings between 0 and 100. Higher values indicate stronger relative positive money flow (buying pressure) recently (over N periods); lower values indicate stronger relative negative money flow (selling pressure).
Think of the “Faucet” Analogy:
Volume is the water pressure; price change direction turns the taps.
Price center goes up, turn on the “inflow” tap (PMF); price center goes down, turn on the “outflow” tap (NMF).
MFI looks at the ratio of total inflow vs. total outflow over a period, reflecting the pressure in the tank (market).

「MFI Calculation Simplified Flowchart」
Level 1: Basic Uses – Overbought/Oversold & Divergence
MFI’s most basic uses are very similar to RSI’s:
Traditional Definitions:
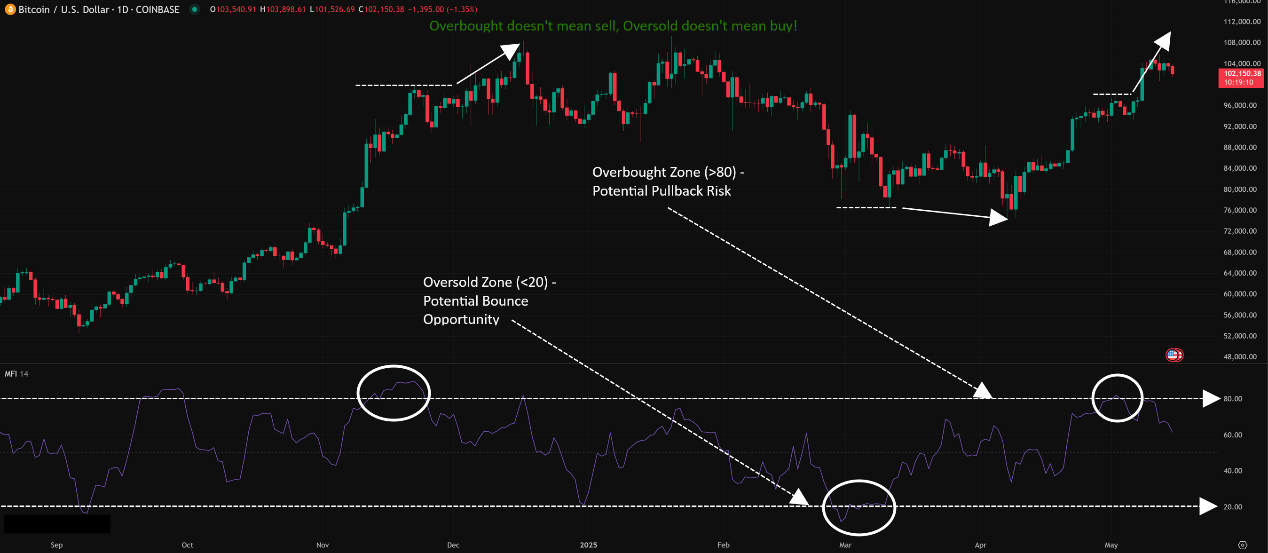
MFI > 80: Considered Overbought. Indicates recent buying pressure has been relatively very strong; price might be rising too fast, potentially due for a pullback or consolidation. ⚠️ Not an immediate sell signal! Strong trends can stay overbought for a long time.
MFI < 20: Considered Oversold. Indicates recent selling pressure has been relatively very strong; price might be falling too fast, potentially due for a bounce or consolidation. ⚠️ Not an immediate buy signal! Weak trends can stay oversold for a long time.
Advanced Take: Some traders prefer using 90/10 as more extreme OB/OS levels, resulting in fewer signals but potentially higher reliability.
Key Point: Overbought/Oversold are just “alerts” that the market might be overheated/overcooled. They are NOT direct buy/sell signals and require confirmation.
「MFI Overbought/Oversold Zones Example」
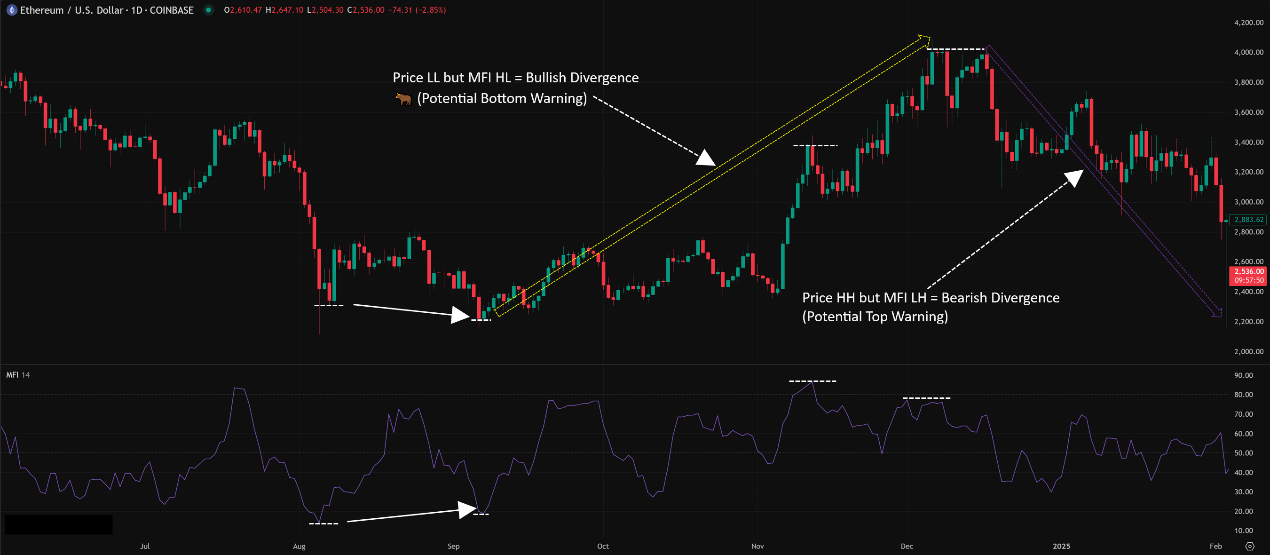
2. Divergence: MFI’s Other Strong Suit!
Principle: Just like with OBV and RSI, when price movement and MFI movement disagree, it’s a potential reversal signal. Because MFI includes volume, some argue MFI divergences are more reliable than RSI divergences (as they account for money flow strength).
Two Main Types:
Bullish Divergence: Price makes a Lower Low (LL), but MFI fails to make a new low, forming a Higher Low (HL) instead. Suggests selling money flow is weakening.
Bearish Divergence: Price makes a Higher High (HH), but MFI fails to make a new high, forming a Lower High (LH) instead. Suggests buying money flow is weakening.
How to Use: Again, these are warning signals. Wait for confirmation from price action or other indicators before trading.
「MFI Bullish & Bearish Divergence Example」
MFI offers more than just 80/20 levels and basic divergence!
A. The Significance of the Mid-Level 50
50 Line as a Dividing Line:
MFI consistently staying above 50 often indicates the market is generally in an uptrend, with buying pressure dominating.
MFI consistently staying below 50 often indicates the market is generally in a downtrend, with selling pressure dominating.
How to Use:
Trend Confirmation: Use in conjunction with trendlines or MAs. If price is trending up and MFI holds above 50, it’s good confirmation.
Potential Support/Resistance: The 50 level can sometimes act as S/R for the MFI line itself. For instance, during an uptrend pullback, if MFI dips near 50, finds support, and turns up, it could be a signal to add or re-enter.
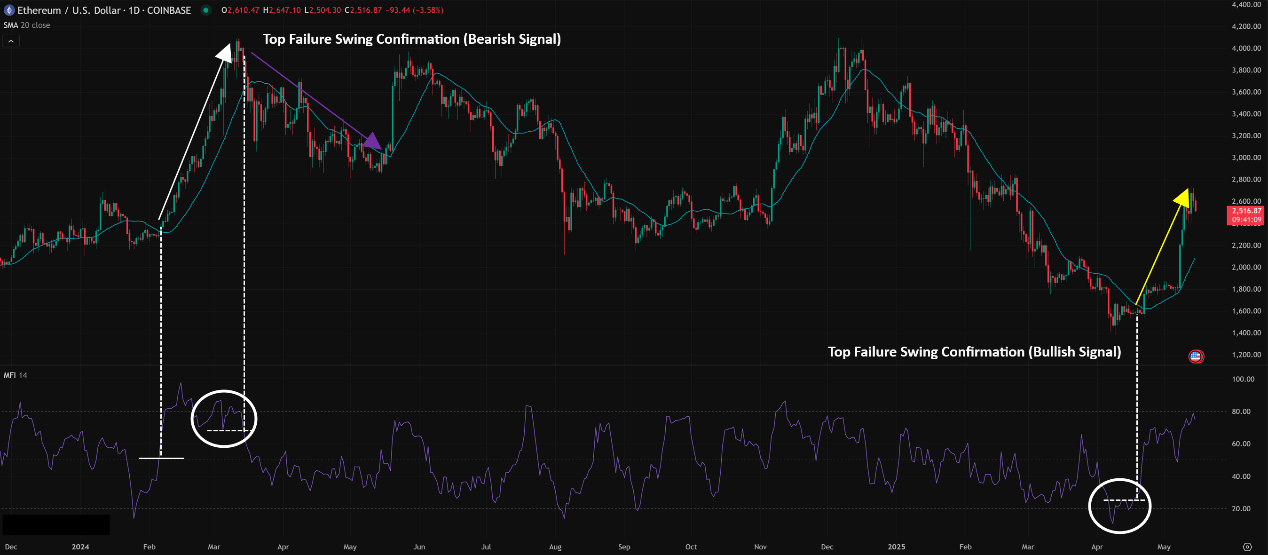
B. Failure Swings: Stronger Than Divergence?
This concept is identical to RSI Failure Swings but applied to MFI. Some consider this pattern more reliable than simple divergence.
Two Patterns:
Top Failure Swing (Bearish):
MFI goes above 80 (overbought).
Pulls back below 80.
Rallies again but fails to exceed the previous MFI peak.
Then breaks below the previous pullback low. This break is the confirmation signal.
Bottom Failure Swing (Bullish):
MFI goes below 20 (oversold).
Bounces back above 20.
Dips again but fails to fall below the previous MFI low.
Then breaks above the previous bounce high. This break is the confirmation signal.
Advantage: Failure Swings provide a more specific confirmation point (the break of the prior low/high), reducing subjectivity and the risk of entering too early based on divergence alone.
「MFI Top Failure Swing Example」
C. Parameter Settings & Timeframes Deep Dive
Default Parameter: 14 Periods
Like RSI, 14 is the widely accepted standard, offering a roughly two-week lookback (on daily charts) for money flow, balancing sensitivity and smoothness.
How Global Traders Play It (Global Variations & Styles):
Short-Term/Day Traders (Scalpers/Day Traders – Crypto, FX fast markets):
Parameters: Might experiment with shorter periods, like 5, 7, 9.
Reason: Want MFI to be more sensitive to short-term money flow shifts, reach OB/OS faster, or show divergences sooner. The downside is more noise and false signals.
Example: A crypto scalper might use MFI(7) on an M15 chart to find very short-term oversold bounce opportunities.
Swing/Trend Traders (Across markets):
Parameters: Most stick with 14, or try slightly longer periods like 20, 21, or even 30.
Reason: Seek a smoother indicator line, filtering out noise, making divergence signals potentially more reliable, or using the 50 line for more stable trend assessment. The downside is more lag.
Example: A stock swing trader might use MFI(21) on a daily chart to look for more pronounced divergences, confirming with price patterns before entry.
Timeframe Impact:
Short Timeframes (M1-M15): MFI will be very choppy, frequently crossing 80/20 and 50. Divergences might appear often but be unreliable.
Medium Timeframes (H1-H4): MFI becomes more useful. OB/OS, divergences, and failure swings are more clearly identifiable. Good for intraday and short-term swing trading.
Long Timeframes (D1, W1): MFI is smoothest, signals are fewer but generally more reliable. Long-term divergences are particularly noteworthy. Suitable for swing and long-term trend analysis.
D. Which Combos Are “Hot” & Effective? (Effective Combos & Best Practices)
Like RSI, MFI works best when combined with other analysis tools.
The Golden Combo: MFI Divergence/Failure Swing + Price Pattern/Key Level
How to Use:
Identify divergence or a failure swing on MFI (potential reversal signal).
DON’T jump in yet! Wait for confirmation on the price chart:
Candlestick Patterns: Reversal candles like Pin Bars, Engulfing Patterns, Hammers, Shooting Stars.
Chart Patterns: Double Tops/Bottoms, Head & Shoulders (Inverse), Wedge breakouts.
Key Levels: Clear breaks of significant support/resistance, trendlines, or channels.
Effectiveness: Use MFI as a filter, Price Action as the trigger. Significantly increases signal reliability. This is the most common and robust approach.
The Trend Confirmation Combo: Trend Indicator (e.g., MA, MACD) + MFI > 50 (Uptrend) / < 50 (Downtrend)
How to Use:
Use MAs (e.g., EMA 20/50) or MACD to determine the primary trend direction.
If bullish, consider buying only when MFI is also confirming above 50.
If bearish, consider shorting only when MFI is confirming below 50.
Effectiveness: Helps avoid counter-trend trading, aligning trades with the dominant flow confirmed by MFI.
The Breakout Confirmation Combo: Price Breakout + MFI Confirmation
How to Use: When price breaks out of a key range or pattern, check MFI:
Upside Breakout + MFI Rising Strongly / Holding > 50: Breakout may be more reliable.
Upside Breakout + MFI Weak / Falling / Below 50: Caution, could be a false breakout.
Downside Breakout + MFI Falling Sharply / Holding < 50: Breakout may be more reliable.
Downside Breakout + MFI Strong / Rising / Above 50: Caution, could be a false breakout (bear trap).
Effectiveness: Uses money flow to gauge the “conviction” behind the breakout.
E. Optimal Parameter Combos? (The Parameter Sweet Spot)
Like most indicators, MFI has no universally “best” parameter. However, based on widespread use and balance:
Most Common/Standard: 14 periods. For most markets and timeframes, 14 is a time-tested starting point.
If You’re a Short-Term Scalper: You might test 7-10 periods, but accept more false signals.
If You’re Longer-Term/Swing Trader Seeking Smoother Signals: You might test 20-30 periods, but accept slower reaction times.
How to Choose?
Start with 14.
Do Visual Backtesting: On your preferred assets and timeframes, compare different MFI settings. See which parameter’s OB/OS zones and divergence signals seemed most aligned with past price moves.
Consider Your Trading Style: Do you need speed or reliability?
Test and Be Consistent: Find a setting that feels comfortable and effective for you, then stick with it.
MFI, as a “volume-weighted RSI,” offers a unique perspective on market momentum by incorporating the crucial element of volume (money flow).
It helps you:
Identify Overbought/Oversold Conditions: Alerting via 80/20 levels.
Spot Price/Volume Divergences: Revealing potential trend weakness or reversals.
Gauge Trend Strength: Using the 50 level as a bull/bear divider.
Find More Reliable Signals: Utilizing Failure Swings.
Combine Price & Volume Analysis: Offering richer insights than price-only oscillators.
For young traders looking to incorporate volume analysis beyond the simplicity of OBV, MFI is a powerful tool worth mastering!
Remember:
MFI is an oscillator (0-100), measuring relative strength.
OB/OS and Divergence are warnings, not commands.
Failure Swings offer clearer confirmation points.
14 is standard, but adjust based on style.
ALWAYS combine with Price Action and other confirmation tools!
Hope this comprehensive MFI breakdown helps you out! Load it onto your charts and start seeing how it can help you decipher the market’s money flow! See ya next time! Keep exploring!