Physical Address
304 North Cardinal St.
Dorchester Center, MA 02124
Physical Address
304 North Cardinal St.
Dorchester Center, MA 02124
What’s cracking, fam! Time again to level up our technical analysis skill tree! Last time we talked PVI (Positive Volume Index), the indicator tracking the “crowd” or “active days.” Today, we’re introducing its sibling, one with an even more “unique,” almost counter-intuitive approach, specifically designed to try and capture the moves of the legendary “Smart Money / Informed Money” – say hello to the NVI (Negative Volume Index)!
Mind blown? Watching days with falling volume? Yep! The logic behind NVI is exactly that unconventional: it assumes the real pros, the well-informed big players, don’t like to make waves when the market is noisy and volume is high. Instead, they prefer to operate stealthily on quiet days when volume shrinks. NVI specifically captures price changes only on these decreasing volume days, aiming to see what clues the “smart money” might be leaving behind in the silence.
Wanna know how NVI pairs up with PVI? How to use its MA line to find potential trend signals possibly led by “smart money”? Why some research suggests NVI’s bull market signal is scarily accurate? Okay! Focus up, ’cause we’re about to do a deep dive into NVI and see how to find gold in the quiet moments! Let’s decode the quiet moves!
NVI and PVI are twin brothers, sharing the same theoretical foundation but looking from opposite angles.
Conceptual Originators & Promoter: Paul Dysart & Norman Fosback – Like PVI, the concept might stem from Paul Dysart, but it was Norman Fosback who popularized and systematically studied it in his 1976 book, Stock Market Logic. The two indicators are usually discussed together.
Core Philosophy: Smart Money vs. The Crowd – Let’s revisit Fosback’s theory:
Smart Money: Tends to operate discreetly, preferring low-volume, quiet days to avoid attracting attention. Their activity is theoretically captured by NVI.
The Crowd: Tends to follow the herd, trading on high-volume, active days. Their activity is theoretically captured by PVI.
NVI’s Purpose: Quantifying Price Trends on “Quiet Days” – NVI is designed to accumulate percentage price changes only on days when volume is lower than the previous day. The goal is to see if price tends to drift up or down when market participation is low (when theoretically, professional money is more active), thereby inferring whether “smart money” might be accumulating or distributing.
So, NVI was created to provide a tool to try and isolate and measure the potential market direction during periods of shrinking volume, theoretically reflecting the actions of more informed participants.
NVI’s calculation is similar to PVI’s, but the trigger condition is the exact opposite.
Step One: Volume Comparison
Compare today’s volume to yesterday’s volume.
Step Two: Conditional Accumulation of Percentage Price Change
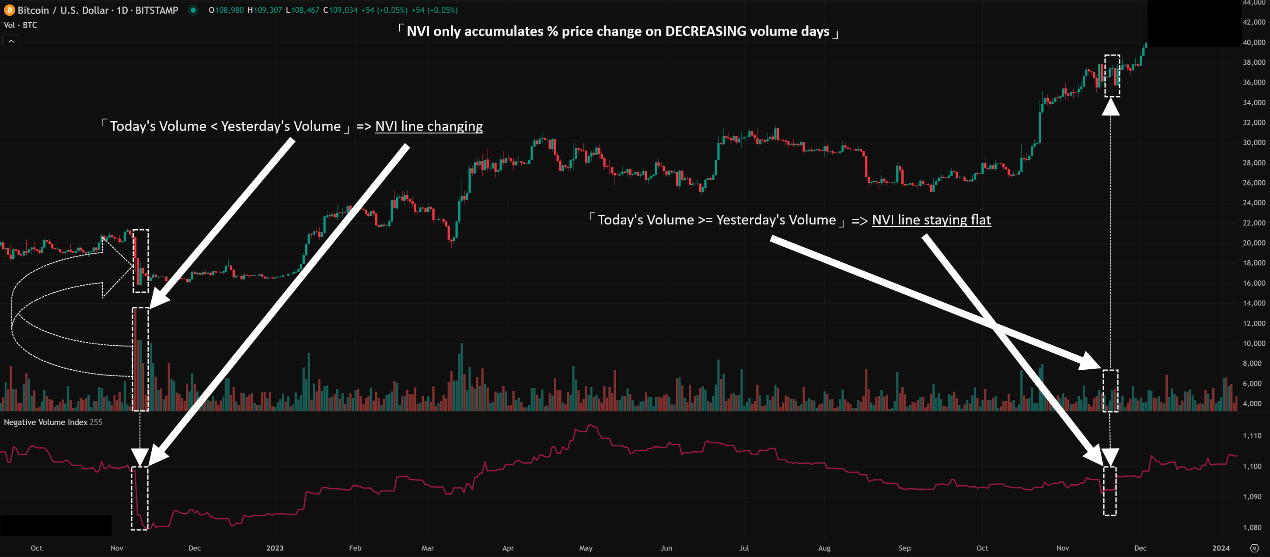
IF Today’s Volume < Yesterday’s Volume: (On days volume decreased)
Today’s NVI = Yesterday’s NVI * [ 1 + (Today’s Close – Yesterday’s Close) / Yesterday’s Close ]
(Meaning: On low-volume days, apply today’s percentage price change to the previous NVI value, compounding it.)
IF Today’s Volume >= Yesterday’s Volume: (On days volume was flat or increased)
Today’s NVI = Yesterday’s NVI (No change!)
(Meaning: On days volume didn’t decrease, NVI ignores the price change completely and stays flat.)
Starting Point: Typically, the first day’s NVI is initialized at 100 or 1000 (same as PVI).
Core Points:
NVI only changes on days when volume decreases. On days with increasing or flat volume, the NVI line is horizontal.
Like PVI, it accumulates percentage price changes.
The absolute value of NVI isn’t very meaningful. What matters is its trend direction and, most importantly, its relationship with its own Moving Average (MA).
Think of a “Secret Agent”:
Decreasing volume is like the streets being quiet, perfect for covert operations.
NVI is like a detective who only works on these quiet days, recording the target’s (price) movements (up/down) and accumulating the intel (percentage price change) to deduce the “mastermind’s” (smart money) intentions. On noisy days, the detective takes the day off.

「NVI Calculation Logic Explained」
Like PVI, NVI’s most practical applications involve its MA line.
Level 1: Basic Usage – Theoretical Interpretation & Trend Observation
Theoretical Market State Interpretation:
NVI Rising: Theoretically indicates that on quiet days, prices tend to rise. Could reflect “smart money” accumulation; market foundation might be bullish.
NVI Falling: Theoretically indicates that on quiet days, prices tend to fall. Could reflect “smart money” distribution or disinterest; market might be weak.
NVI Flat: Could mean price changes on quiet days are offsetting, or there haven’t been many low-volume days recently.
Again, Emphasis: Looking solely at the NVI line’s direction provides weak, lagging signals. It’s mostly for understanding the concept.
Observing with PVI (The PVI/NVI Combo):
(Refer back to PVI explanation) Comparing the trends of both theoretically suggests whether “smart money” or “the crowd” is driving the market. E.g., NVI up + PVI down might imply smart money buying while the crowd sells.
Level 2: Advanced Plays – MA Crossover & Probability Edge (The Famous Signal!)
This is NVI’s most compelling and widely discussed application!
A. NVI Crossovers with its Moving Average (MA) (The Famous Bull Market Signal):
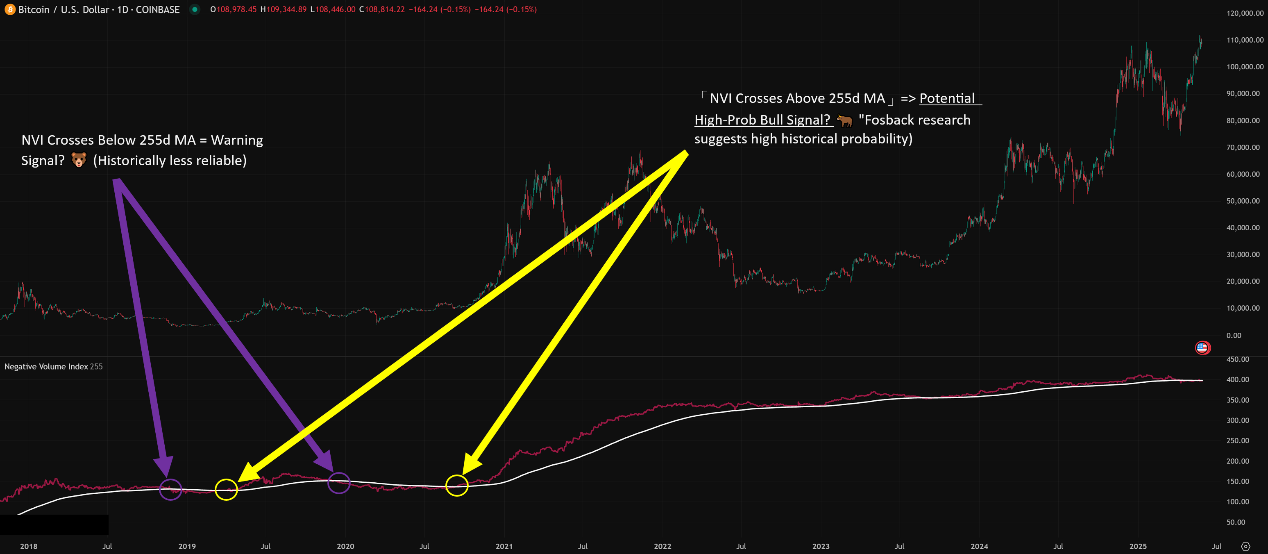
The Core Play: Add a long-term Moving Average onto the NVI line, with the standard being a 255-day SMA (Simple Moving Average) (representing one year).
Generating Signals (This is the big one!):
NVI Crosses ABOVE its 255-day MA: Potentially High-Probability Bull Market Signal!
Fosback’s Striking Finding: His research indicated that, historically (primarily on US stocks), when NVI was above its one-year MA, the market was in a bull market an extremely high percentage of the time (he claimed figures like 95% or even 98%!).
Why? Theoretically, this means that even on quiet, low-participation days, price is still managing to accumulate positive gains over the long term. This suggests underlying strength, possibly driven by “smart money” or committed buyers quietly supporting and pushing the market higher. This “quiet strength” is seen as a key characteristic of a healthy bull market.
NVI Crosses BELOW its 255-day MA: ⚠️ Warning Signal, but Considered Less Reliable than the Bullish Cross.
While NVI falling below its MA might suggest the trend on quiet days has weakened, potentially signaling a bear market, Fosback found this signal far less reliable than the bullish crossover.
In other words, NVI below its MA doesn’t necessarily mean a bear market is confirmed (it could be consolidation or just lack of clear smart money activity), but NVI above its MA has historically shown a strong correlation with bull markets.
Why the 255-day MA is Crucial:
It captures long-term trends and filters out short-term noise.
It’s tied to Fosback’s historical backtesting results.
「NVI and 255-day MA Crossover Example (Highlighting Bull Signal)」
B. NVI vs. MA Position as Primary Trend Assessment:
How to Use: Many followers use the NVI’s position relative to its 255-day MA as a primary gauge of the long-term market trend.
NVI > 255-day MA: Assume the market is in a primary uptrend (bull market). Strategy should favor going long or at least avoid aggressive shorting.
NVI < 255-day MA: Market is likely not in a strong bull phase; could be bear or sideways. A more cautious stance is warranted. Might reduce long exposure or look for short opportunities (but confirm with other analysis, as the NVI downside signal is weaker).
Effectiveness: Provides a very long-term directional bias based on the “smart money” theory.
C. Observing Divergence: Very Rarely Used
Theoretically possible to look for NVI/price divergence.
But Almost Never Used in Practice:
NVI’s line includes many flat periods, making reliable divergence patterns difficult to form.
The market consensus focuses on NVI’s relationship with its long-term MA.
Therefore, looking for NVI divergence is generally not recommended.
D. Parameter Settings & Time Intervals (NVI Parameter Focus)
Core NVI Calculation: NO Parameters!
The Key Parameter: The MA Period!
Standard / Most Common / Highly Recommended: 255-period SMA (applied to Daily charts). Rationale same as PVI – based on Fosback’s work and capturing the annual trend concept.
How Global Traders Play It?
Almost everyone uses the 255-day MA (or close approximation). NVI’s uniqueness and value are primarily tied to this long-term setting.
Using Short MAs? Same as PVI – generates excessive meaningless noise, strongly discouraged.
Timeframe:
Primary Application: Daily Chart. To align with the 255-day MA concept.
Secondary Application: Weekly Chart. Potentially using a 52-week MA for an even broader view.
Short-Term Timeframes (Intraday): Absolutely Not Applicable! NVI’s core logic breaks down completely on intraday charts.
E. Which Combos Are “Hot” & Effective? (Effective NVI Strategies)
Effective NVI strategies are highly focused.
Core System: NVI + 255-Day SMA Crossover + Trend Following
Execution:
Use NVI + 255-day SMA on a Daily chart.
When NVI crosses above MA, consider the market in a confirmed long-term bull zone. During this phase, use your preferred pro-trend buying strategies (e.g., breakouts, pullback buys) to find entries.
When NVI crosses below MA, consider the bull phase potentially over / entering a risk zone. During this phase, be very cautious with longs, consider reducing exposure or exiting, or start looking for potential short setups (confirmed by other signals).
Key: The NVI crossover itself isn’t a precise entry point but rather a “state switch” that changes your overall market bias and strategic approach.
NVI as a Market Health Indicator:
Even if not used for direct trading signals, monitoring NVI relative to its MA provides a reference point for the long-term health of the broader market (especially stock indices). NVI persistently above its MA historically corresponds to more stable bull markets.
F. Best Parameter Combos? (The Optimal Setting Verdict – Simple!)
NVI Indicator Itself: No parameters.
Moving Average on NVI:
Best Practice / Only Widely Accepted: 255-period SMA (applied to Daily chart).
(Or a 52-week SMA on Weekly charts).
Conclusion: Playing NVI essentially means watching its relationship with a one-year MA, primarily on Daily or Weekly charts. Forget fancy tweaks.
The Negative Volume Index (NVI) is a very unique, even somewhat “niche” technical indicator. It operates on the significant assumption that “smart money” prefers to act during periods of low volume, attempting to gauge the long-term market trend by tracking price changes only on those quiet days.
Its main highlights are:
Offering a unique “smart money” perspective (theoretically).
NVI > 1-Year MA historically correlating very highly with bull markets (per Fosback’s research).
Serving as a very long-term trend/market state assessment tool.
However, young traders using NVI must be crystal clear about its limitations:
It is an extremely lagging indicator; it won’t provide timely entry signals.
The underlying theory is a simplification and cannot capture all “smart money” actions perfectly.
The bearish crossover signal is considered less reliable.
Absolutely unsuitable for short-term or intraday trading.
Must be combined with price action and other macro analysis.
For traders interested in exploring different market philosophies or seeking a very long-term market health gauge, NVI is worth understanding historically and conceptually.
Hope this deep dive into NVI clarifies this rather “unconventional” indicator! See ya! Think differently, trade wisely! ✨