Okay, all you kick-ass traders, Crypto Warriors, and future stars of the financial markets! Today, we’re unlocking an indicator that looks like it’s got its own tracking system – the Parabolic SAR (Stop and Reverse)! The name sounds pro, but the gameplay is super intuitive, almost like having a personal bodyguard watching the trend’s back and telling you when it might be time to “flip”!
What the heck is Parabolic SAR (SAR)? Why should you care?
SAR stands for “Parabolic Stop and Reverse.” It was created by a true legend in the technical analysis world – J. Welles Wilder Jr. (Yeah, the same mastermind who gave us RSI and ATR!).
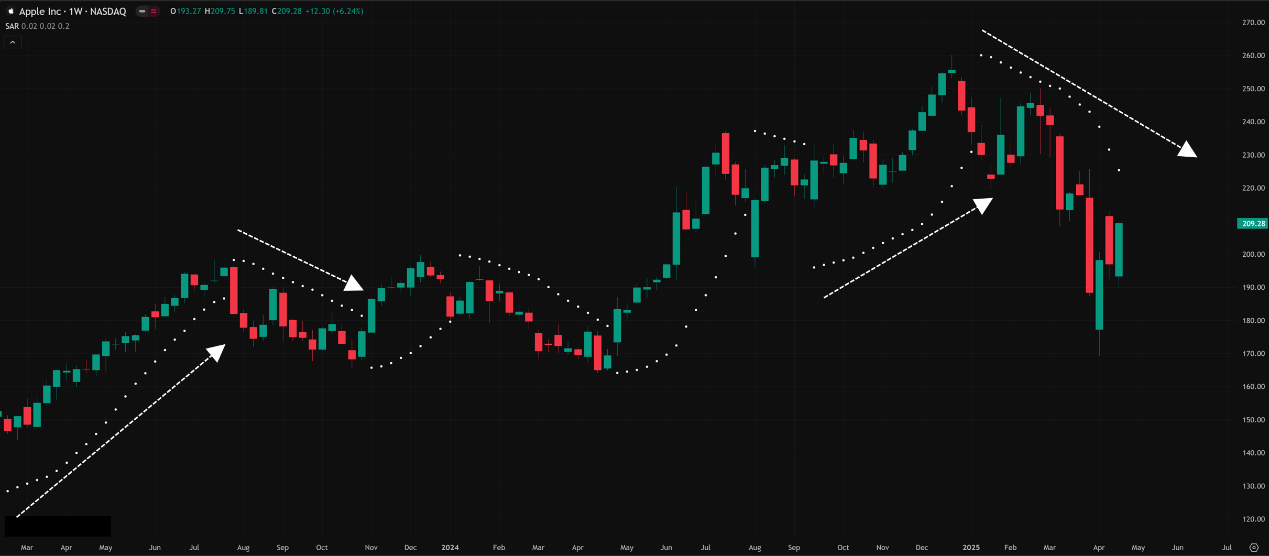
On your charts, SAR shows up as a series of dots, sometimes below the price candles, sometimes above.
- Dots below price: Usually indicates an uptrend.
- Dots above price: Usually indicates a downtrend.
- The Dot Flip: When the price touches or crosses the dots, they “jump” from below to above, or vice-versa. This is your potential trend reversal signal.
「Parabolic SAR: Dots Tracking Trend & Reversals」
Its core value propositions are:
- Identifying Trend Direction: The dots’ location tells you if the bias is bullish or bearish.
- Providing Exit/Reversal Signals: The dot flip is an alert that the trend might be changing.
- Built-in Dynamic Stop Loss: Each dot itself represents a suggested stop-loss level for that specific point in time.
- It Accelerates! (The Secret Sauce): The most unique thing about SAR is that as the trend progresses, the dots speed up their movement towards the price. This is designed to give the trend more room initially but tighten the stop loss as the trend matures, aiming to lock in profits faster or exit sooner if the trend weakens.
SAR’s Origin Story & Design: Why Do the Dots Move Like That?
Wilder designed SAR to create a stop-and-reverse system that considered both time and price. Unlike moving averages that just smooth price, he wanted a tool that could capture the trend and signal an exit as soon as the trend seemed to be ending.
How are the dots calculated? (Just get the concept flow, no manual math needed):
SAR calculation involves a few elements:
- Extreme Point (EP): The highest high in an uptrend, or the lowest low in a downtrend.
- Acceleration Factor (AF): Controls how fast the dots accelerate towards the price. It starts at an initial value and increases by a “Step” amount each time a new EP is made (new high in an uptrend, new low in a downtrend), up to a maximum value.
- Calculation Formula (Conceptual):
- SAR(today) = SAR(yesterday) + [AF(yesterday) * (EP(yesterday) – SAR(yesterday))]
- Each time a new high/low is made, the AF increases (e.g., 0.02, 0.04, 0.06…), making the SAR accelerate towards the price.
- When the price touches or crosses the SAR dot, the system reverses, using the current EP as the starting SAR for the new trend direction.
The “Parabolic” name describes the curved path the dots trace as they accelerate towards the price.
「Acceleration Factor Drives the Parabola」
SAR Basic Plays (Beginner’s Guide):
- Read the Dots for Direction (Trend Direction via Dots):
- Dots below the candles → Bullish Bias.
- Dots above the candles → Bearish Bias.
- The Flip as a Signal (Signal Interpretation):
- Dots jump from below to above → Potential Sell / Exit Long Signal.
- Dots jump from above to below → Potential Buy / Exit Short Signal.
- CRUCIAL WARNING: Using the SAR dot flip alone as an entry signal, especially in choppy markets, is extremely risky! It’s much better suited as an exit signal or an alert that the trend might be changing.
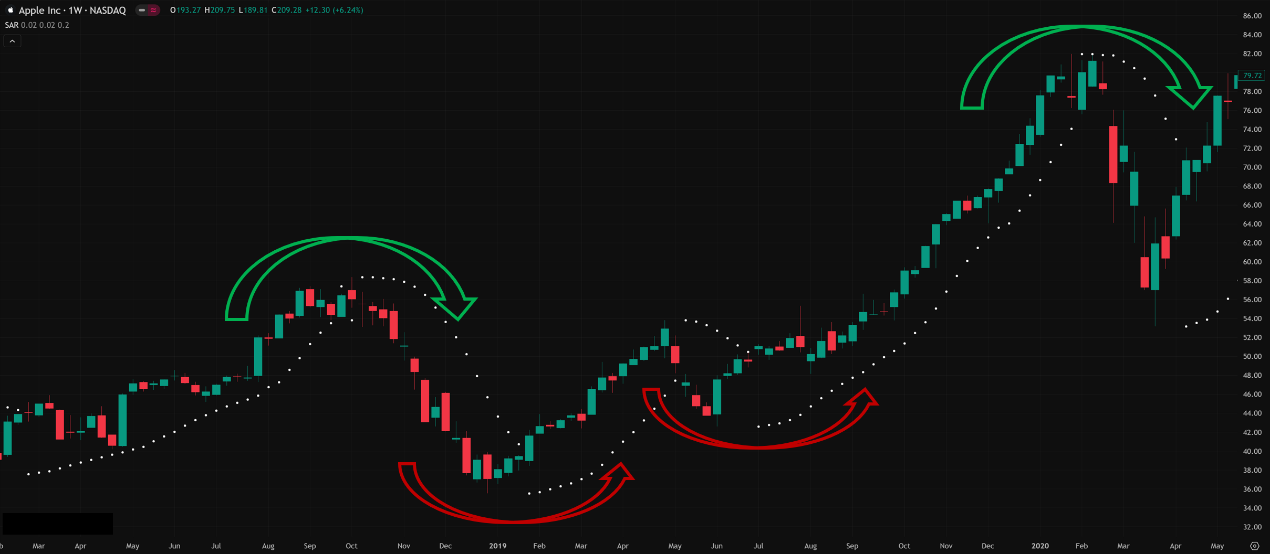
- Using Dots as a Dynamic Trailing Stop Loss:
- When Long, each new dot below the price becomes your trailing stop-loss level. If the price hits that dot, the stop/reversal condition is triggered.
- When Short, each new dot above the price becomes your trailing stop-loss level. If the price hits that dot, the stop/reversal condition is triggered.
- Pros: Automatically trails your stop with the trend, less manual work.
- Cons: Can sometimes stop you out too early on normal pullbacks within a trend.
「Parabolic SAR as an Automatic Trailing Stop Loss」
SAR Advanced Plays & Parameter/Timeframe Breakdown (Pro Level Arena):
SAR’s power and pitfalls heavily depend on parameter settings and market conditions!
Core Parameters:
- Initial AF / Initial Step: The starting value for the AF. Default is usually 0.02.
- Increment AF / Acceleration Step: How much the AF increases each time a new EP is hit. Default is usually 0.02.
- Max AF / Maximum Step: The maximum value the AF can reach. Default is usually 0.2.
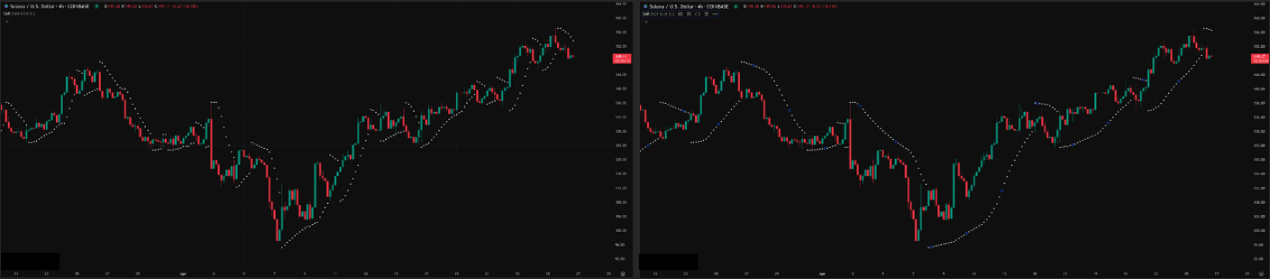
How Parameters Impact Performance:
- Increasing Start AF / Increment AF (e.g., 0.03, 0.03, 0.2):
- Effect: Dots accelerate faster towards price, staying tighter.
- Pros: More sensitive to price changes, reversal signals might appear earlier, tighter stops.
- Cons: Prone to many false signals (whipsaws), especially in consolidation or minor pullbacks. You’ll get stopped out constantly.
- Decreasing Start AF / Increment AF (e.g., 0.01, 0.01, 0.2):
- Effect: Dots accelerate slower, staying relatively further from price.
- Pros: Less sensitive to short-term noise, filters more chop, can ride out deeper pullbacks within a trend without getting stopped out easily.
- Cons: Slower reaction (lagging), reversal signals appear much later, stop-loss levels are wider, potentially giving back more profit when the trend reverses.
- Adjusting Max AF:
- Increasing Max AF (e.g., 0.02, 0.02, 0.3): Allows dots to get even closer to price late in strong trends, providing tighter stops. But might also get you stopped out faster near the trend’s end.
- Decreasing Max AF (e.g., 0.02, 0.02, 0.15): Limits how much the dots can accelerate, keeping stops relatively wider. Might let you ride trends longer, but the stop distance on reversal is larger.
「SAR Parameter Impact: Sensitive (Left) vs. Smoother/Slower (Right)」
Market / Trader Style / Timeframe Analysis:
Choosing SAR parameters isn’t easily divided by country/region; it’s more about:
- Market Volatility: Higher volatility (Crypto!) usually demands less sensitive parameters (lower AF) to avoid getting constantly stopped out by noise.
- Trading Style:
- Scalper/Day Trader: Might experiment with slightly higher AF than default (e.g., 0.025 or 0.03) for faster reactions, but NEEDS extremely strict risk management and other confirmation tools due to excessive false signals!
- Swing Trader: Default (0.02, 0.02, 0.2) is a common starting point. Some might tweak slightly (e.g., 0.015, 0.015, 0.2 for more stability, or 0.02, 0.02, 0.25 to trail tighter late in trends).
- Position Trader: Might use even lower AF (e.g., 0.01, 0.01, 0.2) to capture major trends and ignore short-term fluctuations.
- Time Frame:
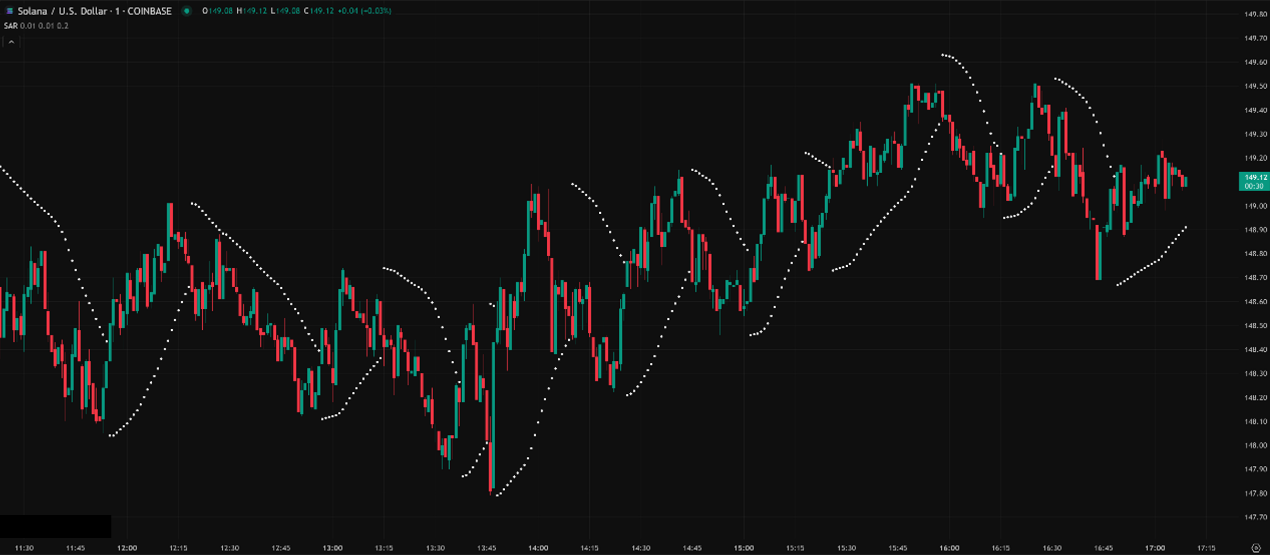
- Ultra Short-Term (M1, M5): SAR typically performs very poorly here! Markets are often ranging or making tiny moves, causing SAR to flip constantly, generating endless false signals. Default settings are bad enough; higher sensitivity is even worse. Strongly advise against relying on SAR for any decisions on these timeframes!
「SAR on 1-Minute Chart: Highly Unreliable」
-
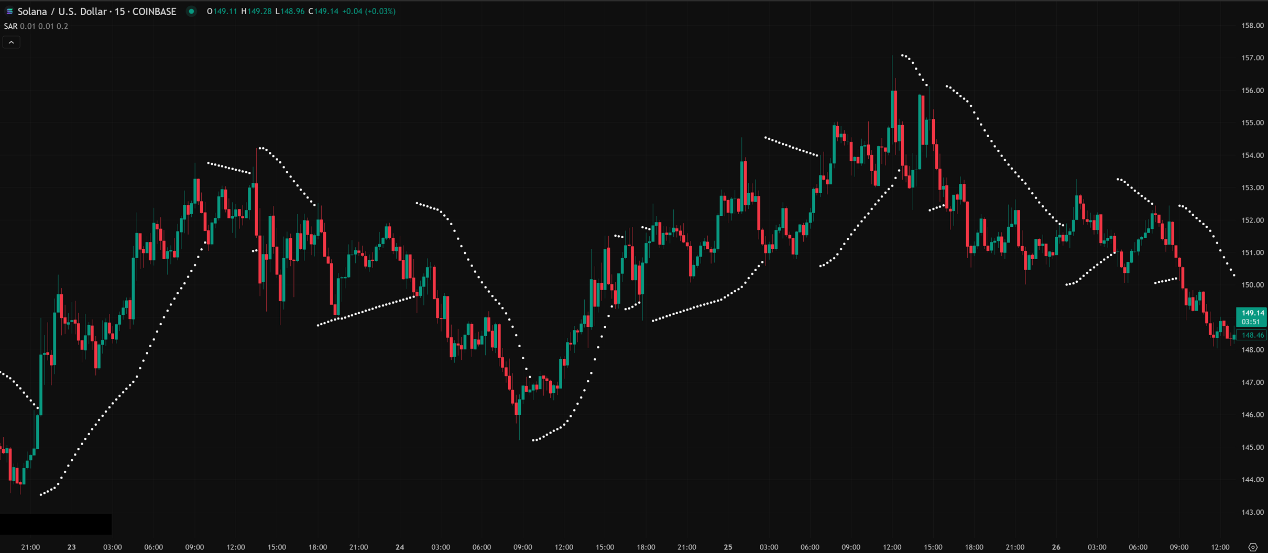
- Common Intraday (M15, H1): Default (0.02, 0.02, 0.2) starts having some reference value, PROVIDED the market is clearly trending! On these timeframes, SAR can be used to:
- Help gauge short-term trend direction.
- Provide a dynamic stop-loss reference.
- BUT REMEMBER: Choppy markets are still its kryptonite. And crypto volatility on these timeframes might still require less sensitive settings (e.g., 0.015, 0.015, 0.2).
「SAR on 15-Minute Chart: Use ONLY in Clear Trends」
-
- Swing/Long-Term (H4, Daily, Weekly): These are the timeframes where SAR performs relatively best! Longer-term charts are more likely to exhibit sustained trends, where SAR’s trend-following and stop-loss features truly shine. Default (0.02, 0.02, 0.2) is the common standard. Adjusting AF can tailor it to market rhythm or personal risk preference.
Which “Unique” Parameter Combo + Timeframe is Hottest & Most Effective? How to Use It?
Here we go again! For SAR, the answer is even clearer: There’s NO single “hottest” parameter set, and it heavily relies on “correct usage” and “market conditions”!
Instead of searching for a magic parameter, understanding SAR’s best use cases and strategies is far more important:
- Best Timeframes: H4 / Daily / Weekly. Trends are clearer, SAR false signals are relatively fewer.
- Core Strategy: Not primarily for Entries, but for Managing Exits!
- Golden Rule #1: Purely as a Trailing Stop Loss Tool: Enter using other methods (breakouts, MA crosses, pattern confirmations, etc.), then use SAR (e.g., default 0.02, 0.02, 0.2) to trail your stop. Exit when the price hits the dot. This is the most common and relatively robust way to use it.
- Golden Rule #2: As a Trend Filter:
- Dots below? Market bias is bullish; only consider long entry signals (e.g., confirmed by RSI climbing from oversold, MACD bullish cross).
- Dots above? Market bias is bearish; only consider short entry signals (e.g., confirmed by RSI falling from overbought, MACD bearish cross).
- Dots flipping wildly? Market is likely choppy. SAR is telling you: STAY OUT! Don’t trade! (Filters out choppy conditions).
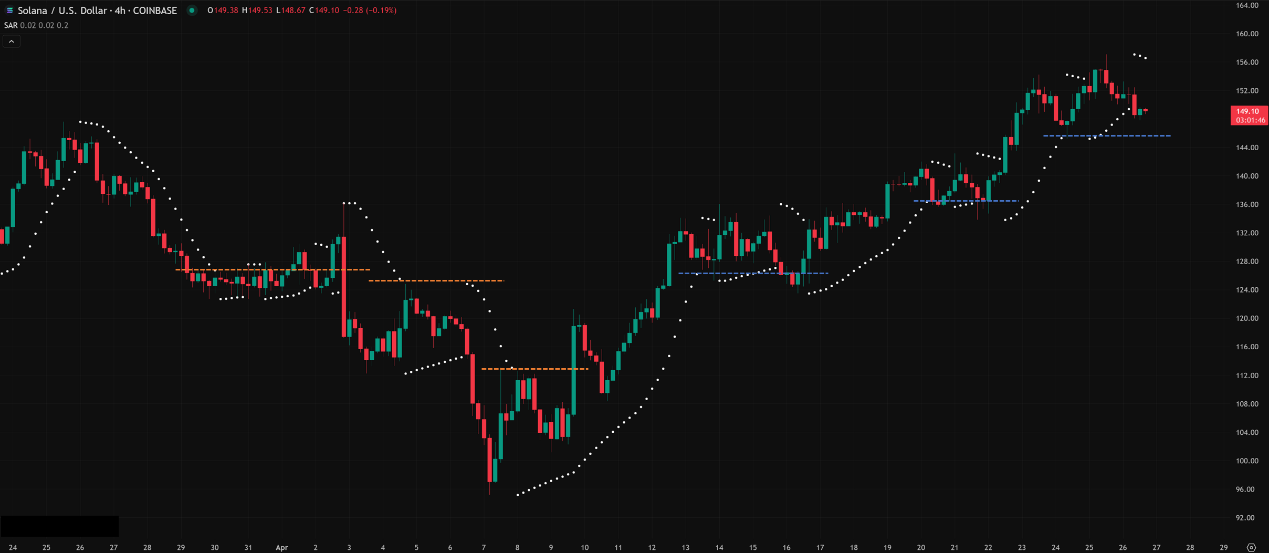
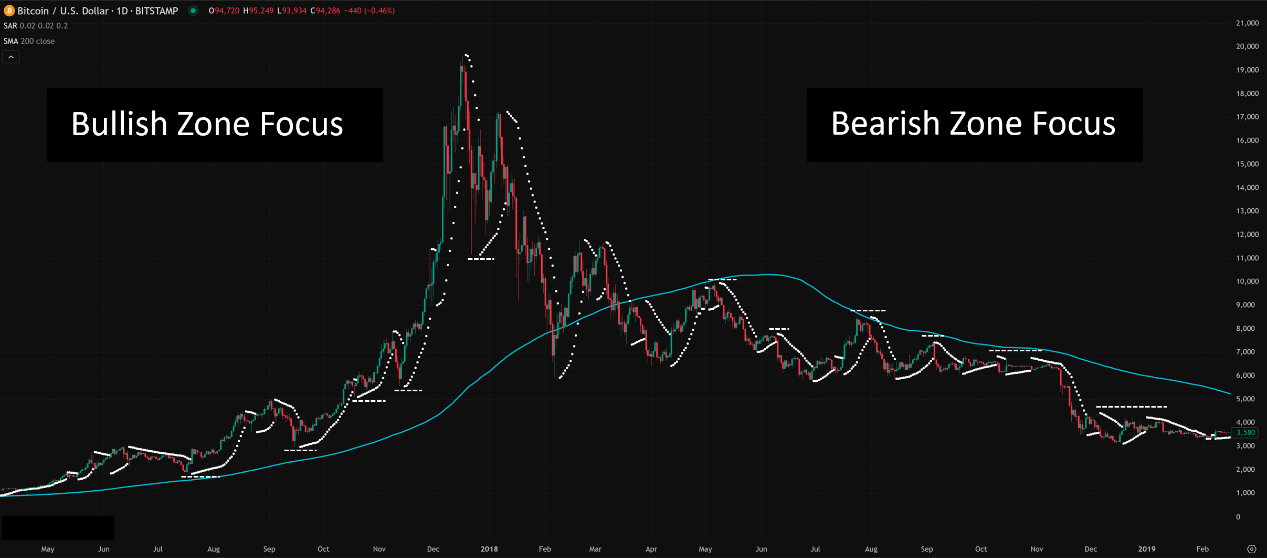
- “Unique” Approach (Not parameters, but usage): Combine with Long-Term MAs!
- Example: On a Daily chart, only consider the SAR dots-below (uptrend) state if the price is above the 200 SMA. Only consider the dots-above (downtrend) state if the price is below the 200 SMA.
- Further refinement: Only when price is > 200 SMA AND SAR flips from above to below, treat it as a potential signal that a pullback with the major trend might be ending – requires other confirmation! – not an immediate entry.
- Effect: Use the long-term MA to filter the main direction, then use SAR for shorter-term momentum confirmation and stop management. Significantly improves odds.
「SAR + Long-Term MA = Powerful Trend Filter」
Do the Default Parameters (0.02, 0.02, 0.2) Still Work?
Absolutely! For H4+ timeframes, and when used primarily as an exit/stop-loss tool or a trend filter, the default settings are a time-tested, balanced choice. Many pro traders stick with the defaults. The key isn’t magic parameters, but how you use the indicator.
What are the “Best” Parameter Combos Across All Timeframes?
Again: No single right answer! It all depends on your market, timeframe, strategy, risk tolerance, and requires extensive backtesting!
Reference starting points (Remember to test!):
- High Frequency/Scalping (M1-M15): Strongly advise against using SAR as a primary tool. If forced to use it for ultra-fast stop reference, maybe try (0.03, 0.03, 0.2) or higher, but be prepared for constant whipsaws.
- Intraday/Short Swing (H1): (0.02, 0.02, 0.2) as baseline. Volatile markets (Crypto) might test (0.015, 0.015, 0.2).
- Swing/Mid-Long Term (H4, Daily): (0.02, 0.02, 0.2) is the gold standard. To ride out more chop, test (0.015, 0.015, 0.2) or (0.01, 0.01, 0.2).
- Long/Position Term (Weekly): (0.01, 0.01, 0.2) or even lower AF for maximum smoothness.
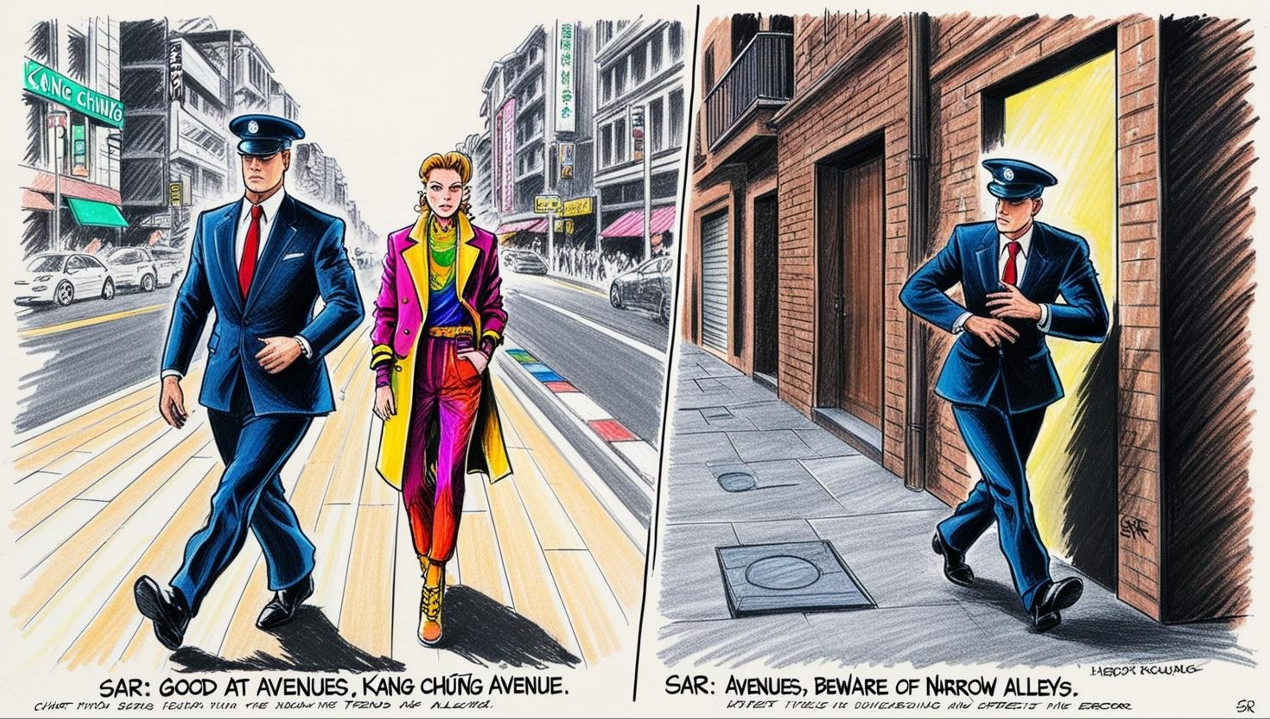
Bottom Line: SAR is Your Close Bodyguard, But Hates Close Combat (Ranging Markets)!
Parabolic SAR, with its unique acceleration mechanism and stop-and-reverse design, is a very useful tool, especially good at:
- Clearly marking trend direction.
- Providing automated trailing stops.
- Closing the gap on price as a trend continues.
But its fatal flaw is:
- Absolutely HATES Ranging Markets: Sideways chop is SAR’s slaughterhouse, generating tons of false signals. Learning to identify ranges and benching SAR is a survival skill!
- Lagging Nature: It follows trends, won’t catch exact tops/bottoms.
- Using Alone for Entry = Suicide Mission: Never, ever enter based solely on a dot flip! Must combine with other analysis.
- Usage & Context > Parameters: How and when you use it might be more critical than the exact settings.
「SAR: Excels on the Open Road, Avoid the Narrow Alleys」
Hope this deep dive into SAR helps you master the quirks of this accelerating bodyguard! Add it to your toolkit, but remember to deploy it under the right conditions!
Next Steps:
- Add SAR (using defaults) to your H4 and Daily charts.
- Find a clear trend and observe how SAR tracks it and when it flips.
- Find a clear ranging period and see how SAR flips erratically.
- Practice using SAR purely as a trailing stop, or combine its direction with your preferred entry indicator as a filter.
- Backtest! Backtest! Backtest! Test different parameters on your market.
May you follow trends smoothly and watch your profits accelerate!💨💸