Physical Address
304 North Cardinal St.
Dorchester Center, MA 02124
Physical Address
304 North Cardinal St.
Dorchester Center, MA 02124
Yo! What’s good, Chart Ninjas and Crypto Gladiators! Ready to add another weapon to your TA arsenal, one filled with geometric aesthetics and predictive potential? After breaking down Auto Pitchfork, today we’re going back to basics and diving deep into its “manual original,” a classic tool that requires your eye and skill to wield – the (Andrews’) Pitchfork!
That’s right, the one where you manually pick three points to draw those angled channel lines that look like a farmer’s pitchfork! While Auto Pitchfork offers convenience, the algo doesn’t always pick the best points. The manually drawn Pitchfork gives you maximum control to capture the trend structure you see as most important!
Wanna know how to precisely select the P0, P1, and P2 points? How to use the “law of gravity” of the Median Line (ML)? How to use the upper and lower lines (UML/LML) to find entries and targets? How to judge trend health by the Pitchfork’s angle and price action within it? Okay! Starting with Dr. Alan Andrews’ theory, let’s master this pro-level channel analysis tool step-by-step! Let’s draw the lines to success!
The story of the Pitchfork revolves around a unique thinker and his core theory.
The Inventor: Dr. Alan Andrews – As mentioned with Auto Pitchfork, this technical analyst with a background in physics and engineering originated the Pitchfork. He didn’t just invent the tool; he developed a whole Median Line Theory.
Core Philosophy: Price Orbits the Median Line & The 80% Rule – Andrews’ core observation was that price movement often exhibits cyclicality and symmetry. He believed that once you identify three key consecutive turning points (P0, P1, P2) of a trend, you can draw a Median Line (ML) starting from P0 through the midpoint of P1-P2. Price then acts as if drawn by gravity, having a very high probability (he claimed around 80%) of returning to this Median Line.
More Than a Channel, It’s a Probability Map: So, the Pitchfork isn’t just about drawing a channel. Its deeper meaning lies in providing a high-probability framework for price action. The Median Line is the “center of gravity,” and the outer lines are potential zones of extremes or turning points.
Purpose: Identifying High-Probability Paths & Turning Points – Andrews designed the Pitchfork to offer an objective framework to help traders identify the likely path and velocity of a trend, as well as the areas where support, resistance, or even reversals are most likely to occur.
Therefore, the essence of the (manual) Pitchfork lies in understanding Dr. Andrews’ Median Line Theory and using precise point selection to draw an analytical framework that reflects the market’s internal rhythm and potential trajectory.
Drawing a Pitchfork isn’t hard, but drawing one well – one that’s accurate and meaningful – requires skill and understanding.
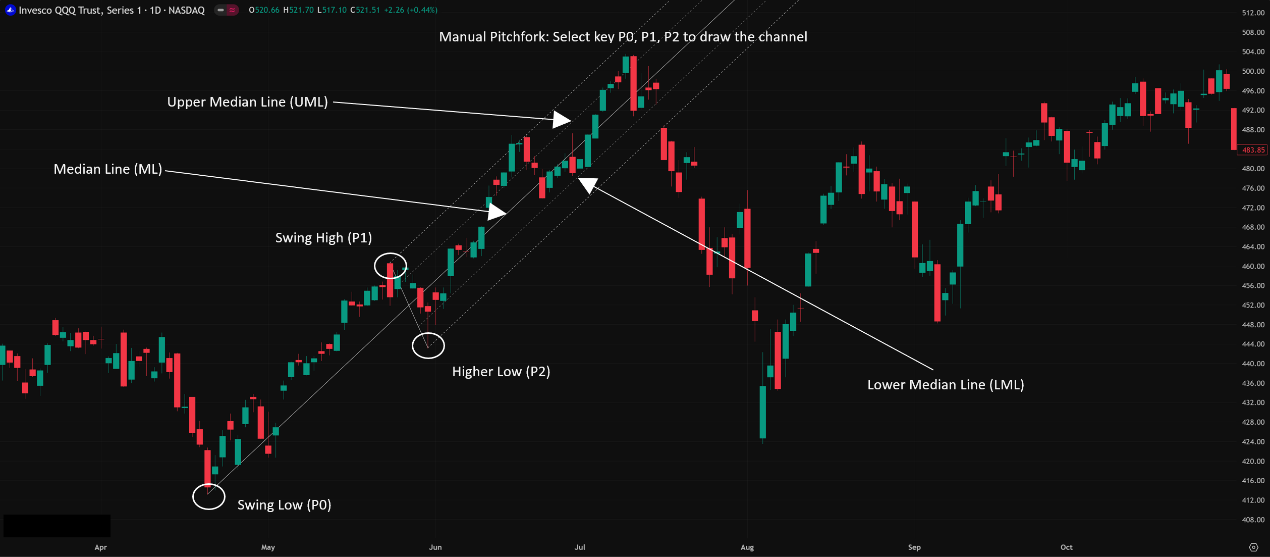
Step One: Pick the Right Three Anchor Points P0, P1, P2! (Crucial Step!)
This is the single most important step and also the most subjective, directly determining your Pitchfork’s validity!
How to Choose? No absolute rule, but basic principles apply:
P0(Starting Pivot): Usually the start of a major trend move. A very obvious, significant Swing Low (for an uptrend) or Swing High (for a downtrend).
P1(First Wave End Pivot): The first major counter-swing peak/trough after P0. An obvious Swing High (uptrend) or Swing Low (downtrend).
P2(First Retracement End Pivot): The first major pullback/bounce end point after P1, and this point must not exceed P0 (i.e., in an uptrend, P2’s Low must be higher than P0’s Low; in a downtrend, P2’s High must be lower than P0’s High).
Selection Tips:
Choose “Significant” Pivots: Don’t pick tiny wiggles; select points that clearly changed the short-term direction.
Use Zig Zag as a Guide? You can use the Zig Zag indicator (with parameters you find reasonable) to help identify major swing points, then select your P0, P1, P2 from those.
Timeframe Consistency: Analyze the trend level you care about on the corresponding timeframe to find P0, P1, P2. E.g., use the daily chart to find major swing points for a daily trend analysis.
Subjectivity: Different traders might identify slightly different “major” pivots, leading to different Pitchforks. This requires practice and experience.
Step Two: Use the Pitchfork Drawing Tool
Most charting platforms have an Andrews’ Pitchfork drawing tool.
How to Draw: Typically, you click sequentially on the P0 -> P1 -> P2 points you’ve identified. The tool then automatically draws the three lines.
Step Three: Understand the Three Core Lines
Median Line (ML): Drawn from P0, passing through the midpoint of the line segment connecting P1 and P2. This is the “soul” of the Pitchfork, representing the trend’s central path and “gravitational” pull.
Upper Median Line (UML): Drawn from P1, parallel to the Median Line. Represents potential resistance or the overbought boundary of an ascending channel.
Lower Median Line (LML): Drawn from P2, parallel to the Median Line. Represents potential support or the oversold boundary of an ascending channel. (Roles reverse for a descending channel).
Core Concept: The Pitchfork provides a predictive channel based on three past turning points. The idea is that future price action is likely to continue within this framework and react to these three lines.
Think of a Racetrack:
P0, P1, P2 are like three key turns you’ve defined on the track.
ML is the center line of the track.
UML and LML are the outer guardrails.
The race car (price) is highly likely to stay within this track, potentially bouncing off the guardrails, and frequently returning towards the center line.

「Steps to Manually Draw a Pitchfork (Uptrend)」
Once you’ve drawn your Pitchfork, how do you use it to find trading opportunities?
Level 1: Basic Usage – Channel Trading & S/R
This is the most straightforward application:
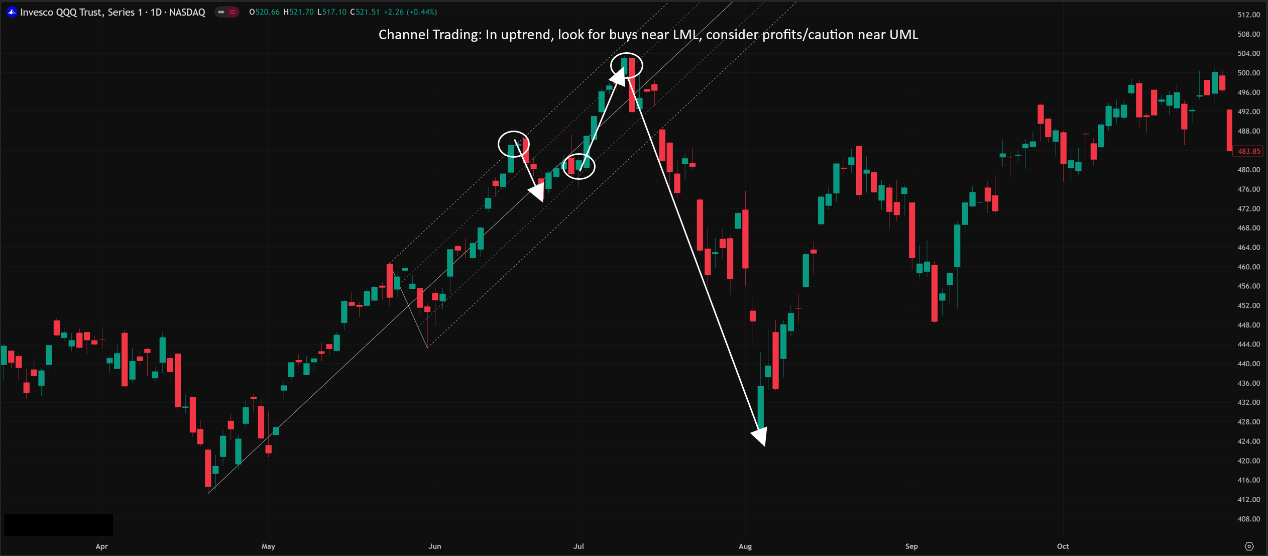
Trading within the Channel:
Ascending Pitchfork (Uptrend):
Price pulls back to the LML area -> Look for buy signals (e.g., bullish candles).
Price rallies to the UML area -> Consider taking partial profits on longs or watch for potential pullbacks.
Price pulls back to the ML area -> Might find support, or acts as an observation point.
Descending Pitchfork (Downtrend):
Price rallies to the UML area -> Look for short signals.
Price drops to the LML area -> Consider taking partial profits on shorts or watch for potential bounces.
Price rallies to the ML area -> Might face resistance.
Lines as Dynamic S/R:
ML, UML, LML act as dynamic support and resistance lines whose slope depends on your P0, P1, P2 choices.
Observe price reactions at these lines. Strong bounces or rejections confirm the line’s validity.
「Trading Inside an Ascending Pitchfork Channel」
Level 2: Advanced Plays – Breakouts, Confirmation, Variations & Confluence
Channel Breakout:
A strong close outside the Pitchfork’s outer lines (above UML in uptrend, below LML in downtrend) can signify:
Trend Acceleration: Price might enter a faster phase of the trend.
Channel Failure: The previous trend structure might be changing.
Break Above UML (Uptrend): Can signal trend acceleration, but also be cautious of potential exhaustion climaxes.
Break Below LML (Uptrend): Strong warning signal! The uptrend might be over, potential reversal lower.
Reverse logic for breaks in a downtrend.
Confirmation: Breakouts are stronger with volume confirmation and ideally a retest.
The 80% Rule & Median Line Trading:
Reiterating Andrews’ core idea: Price returns to the ML ~80% of the time.
Strategy Implications:
If price falls from UML, the ML is often the first target.
If price bounces from LML, the ML is often the first target.
If price fails to reach the ML before reversing (e.g., bounces from LML but turns down before hitting ML), it’s a sign of weakness. The trend lacks the strength even to return to center, hinting at a potential reversal.
If price slices through the ML decisively towards the other rail, it indicates strong trend momentum.
Warning Lines & Other Parallel Lines:
Often, parallel lines are drawn outside the UML and LML at 1x or 2x the UML-LML distance.
Usage:
Reference points for extreme overbought/oversold conditions.
Potential targets during strong trend acceleration.
Price reaching these outer lines often signifies a very strong trend but also increases the risk of short-term exhaustion.
Applying Pitchfork Variations:
Schiff / Modified Schiff:
Some traders find that in certain trends (especially flatter or slower starting ones), Schiff or Modified Schiff channels visually fit the price action better than standard Andrews’.
Experiment: If your standard Andrews’ Pitchfork doesn’t seem well-respected by price, try drawing Schiff or Modified Schiff using the same P0, P1, P2 points to see if they provide a better fit.
Usage is similar – watch ML, UML, LML for S/R.
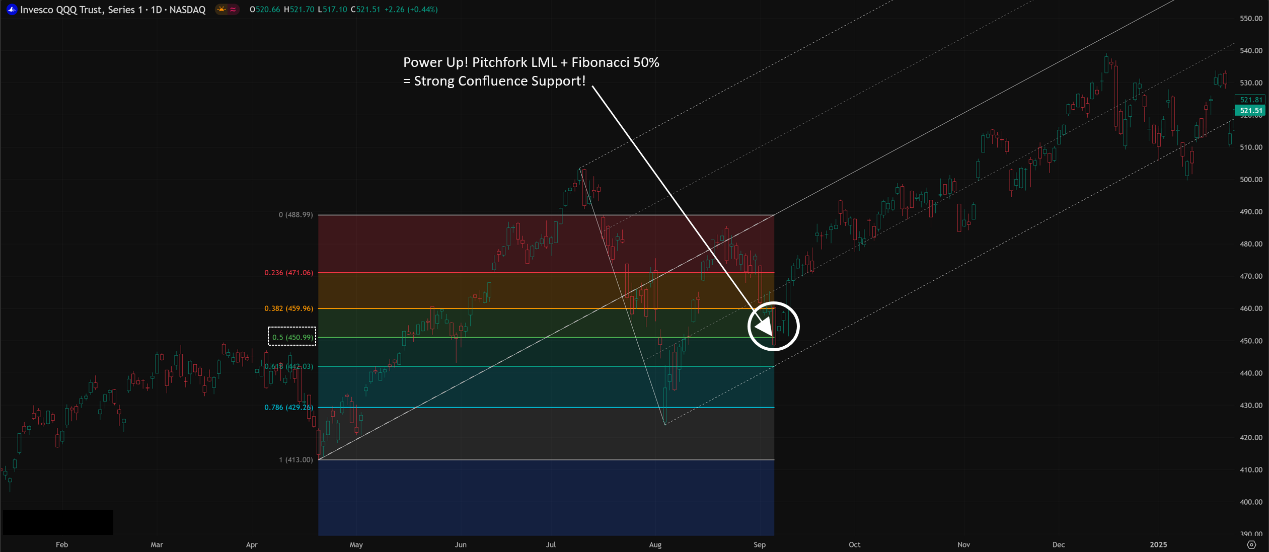
Confluence! Confluence! Confluence!
Like Fibo and Pivot Points, Pitchfork lines become exponentially more powerful when they overlap (confluence) with other S/R levels!
The Strongest Setups:
Pitchfork LML + Fibo Support + Horizontal Support + Bullish Candle = (High-prob buy)
Pitchfork UML + Fibo Resistance + Volume Profile POC + Bearish Candle = (High-prob short)
Median Line ML tracking closely with a key MA (e.g., 50/200 EMA/SMA) = Strong trend confirmation.
「Pitchfork Line Confluence with Fibonacci Retracement」
The Pitchfork Itself Has No Internal Parameters! Its shape is entirely determined by the P0, P1, P2 you choose.
The Key “Parameter” = Your Point Selection Skill!
How to Improve Selection?
Experience: Chart time, drawing practice.
Objectivity Aids: Use Zig Zag or Fractals (with reasonable settings) to help identify potential significant pivots, then use your judgment to select the best P0, P1, P2.
Consistency: Try to apply a consistent logic for selecting points (e.g., always use the most recent qualifying Zig Zag pivots).
Multi-Timeframe Validation: Pitchforks drawn on higher timeframe pivots are generally more reliable.
Timeframe:
Applicable on all timeframes.
Higher Timeframes (D1, W1): Pitchforks are more reliable, define major trend structures.
Lower Timeframes (H1, H4): Pitchforks track shorter-term moves, useful for swing and intraday trading, but require quicker reactions and careful confirmation.
Very Short Timeframes (M15, M5): Pitchforks can change rapidly and fail often; require advanced skill and risk management.
Which Combos Are “Hot” & Effective? (Hottest & Effective Setups)
No absolute “hottest” because P0, P1, P2 selection is subjective.
Effective Framework 1: Major Trend Pitchfork + Pullback to LML/UML + Confluence + Candle Confirmation
Execution: Draw Pitchfork on the primary trend (e.g., Daily chart). Wait for price to pull back to LML (uptrend) or rally to UML (downtrend), ideally where it converges with Fibo/MA/Horizontal S/R. Enter on a clear reversal candlestick pattern.
Effectiveness: Combines trend, channel, confluence, and price action – a very robust strategy framework.
Effective Framework 2: Failure to Reach ML Reversal
Execution: Price bounces from LML (uptrend) but clearly fails to reach the ML before turning back down and breaking the recent low -> Potential trend weakening/reversal signal. Consider closing longs or exploring shorts. Reverse logic for downtrends.
Effectiveness: Catches early signs of fading momentum within the trend structure.
Effective Framework 3: Outer Line Breakout + Retest Confirmation
Execution: Price breaks UML (uptrend acceleration) or LML (uptrend reversal). Wait for price to retest the broken line as new S/R before entering in the direction of the break.
Effectiveness: Confirmed entry point for trend acceleration or reversal.
Best Parameter Combos? (Optimal Settings – The Drawing Skill!)
NO Parameters to Set on the Indicator Itself!
The “Optimum” isn’t a setting, it’s YOUR skill in selecting P0, P1, P2!
How to Improve Point Selection?
Practice! Practice! Practice!
Study market structure analysis.
Use tools like Zig Zag for reference, but apply judgment.
Focus on major turning points on higher timeframes.
Conclusion: Mastering the Pitchfork is about the art of point selection and interpreting price interaction with the lines, not finding secret parameters.
The (Andrews’) Pitchfork is a powerful charting tool based on Median Line Theory. It not only provides dynamic support and resistance channels but, more importantly, attempts to map out the high-probability path of a market trend.
Learning to use the Pitchfork helps you:
Visualize and confirm trend direction and channels.
Identify high-probability dynamic support and resistance levels (ML, UML, LML).
Spot potential entry opportunities on pullbacks/rallies within the trend.
Gauge trend strength and potential points of acceleration or exhaustion.
Increase trade probability through confluence analysis.
For young traders wanting to master the essence of trend trading and gain insight into the market’s potential “trajectory,” learning to accurately draw and interpret the Pitchfork can definitely elevate your analysis game!
Remember:
Core is Median Line Theory & the 80% Rule.
Choosing the right P0, P1, P2 points is PARAMOUNT!
ML, UML, LML provide dynamic S/R.
Confluence is key to higher probability.
Requires price action confirmation for signals.
Higher timeframe Pitchforks carry more weight.
Practice drawing and observing!
Alright! Hope this deep dive into the Pitchfork helps you out! Go open your charts, find some trends, and try drawing some “forks” yourself to feel their power! See ya next time! May your trades stay within the lines (most of the time)!