Physical Address
304 North Cardinal St.
Dorchester Center, MA 02124
Physical Address
304 North Cardinal St.
Dorchester Center, MA 02124
Yo! What’s up, Chart Masters and Crypto Commandos! Time for another gear upgrade in our TA journey! Today we’re diving deep into a tool whose name sounds fancy – Pivot Points High/Low – but its core concept is something you probably use every day: leveraging the key swing highs and lows on the chart as your analytical “pivot points”! ⚙️
Hold up! “Pivot Points High/Low”? That’s not exactly a standard official indicator name on platforms like TradingView or MT4/5! But no worries, I get what you’re asking. You’re likely referring to the method of using the naturally occurring short-term or intermediate-term peaks and troughs on the price chart as potential turning points or significant support/resistance levels. These highs and lows act like “turning points” or “pivots” in the price action, so calling them Pivot Points High/Low makes total sense!
Many technical indicators, like Fractals or the Zig Zag indicator, are actually designed to help you automatically identify these highs and lows. So today, let’s focus on dissecting how to use these crucial swing points (whether found manually or with indicators) to make trading decisions, covering everything from basic principles to advanced strategies! Let’s pivot to the point!
Using highs and lows for analysis is one of the most fundamental, oldest concepts in technical analysis, with no single inventor.
Dow Theory DNA: The core of Charles Dow’s theory revolves around observing the series of highs and lows price creates.
Uptrend: Characterized by successively Higher Highs (HH) and Higher Lows (HL).
Downtrend: Characterized by successively Lower Highs (LH) and Lower Lows (LL).
These HHs, HLs, LHs, and LLs are themselves the most important “Pivot Points High/Low,” defining the trend structure.
Basis of Chart Patterns: All classic chart patterns – Head & Shoulders, Double Tops/Bottoms, Triangles, Flags, etc. – are formed by connecting a series of these highs and lows. Analyzing patterns is essentially analyzing the arrangement of these Pivot Points.
Indicator Assistance: To identify these important swing points more easily and objectively, helper indicators were developed later:
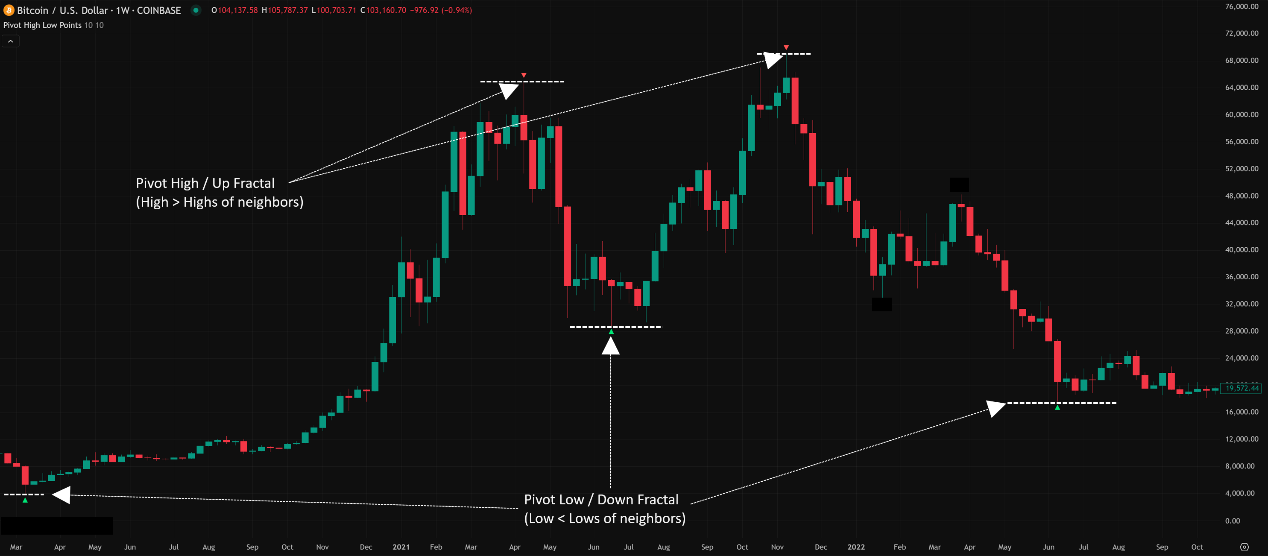
Fractals: Invented by Bill Williams, most commonly using a 5-bar pattern: A candle’s high is higher than the highs of the two bars to its left AND the two bars to its right, forming an Up Fractal (potential Pivot High). Conversely for a Low Fractal (potential Pivot Low).
Zig Zag Indicator: Attempts to filter out minor fluctuations and connect major swing highs and lows directly with lines, helping visualize the primary swings.
Various Swing High/Low Indicators: Many platforms have built-in or custom indicators that use different rules (e.g., requiring confirmation over several bars) to mark potential swing points.
So, the concept of Pivot Points High/Low is rooted in the most basic price action observation in technical analysis, with indicators serving as tools to help us find these key points more quickly and consistently.
Whether done manually or with an indicator, the basic logic for identifying these Pivot Highs/Lows is based on the concept of relative peaks and troughs.
Pivot High (Potential Top Turning Point / Swing High):
Usually defined as the High of a specific candle that is higher than the Highs of a specified number of candles to its left and right.
Example (Using Fractals, n=2): The High of a candle must be higher than the Highs of the 2 candles to its left AND higher than the Highs of the 2 candles to its right. This central highest point is a Pivot High (Up Fractal).
Pivot Low (Potential Bottom Turning Point / Swing Low):
Usually defined as the Low of a specific candle that is lower than the Lows of a specified number of candles to its left and right.
Example (Using Fractals, n=2): The Low of a candle must be lower than the Lows of the 2 candles to its left AND lower than the Lows of the 2 candles to its right. This central lowest point is a Pivot Low (Down Fractal).
Core Concept: These Pivot Points represent a local extremum or turning point in buying/selling pressure over the short term (determined by the parameters). The market temporarily changed direction at these points.
Think of Hiking:
A Pivot High is like reaching a small peak on your hike, where you paused or started heading down.
A Pivot Low is like reaching a valley bottom, where you paused or started heading up.
Indicators help automatically mark these peaks and valleys on your map.
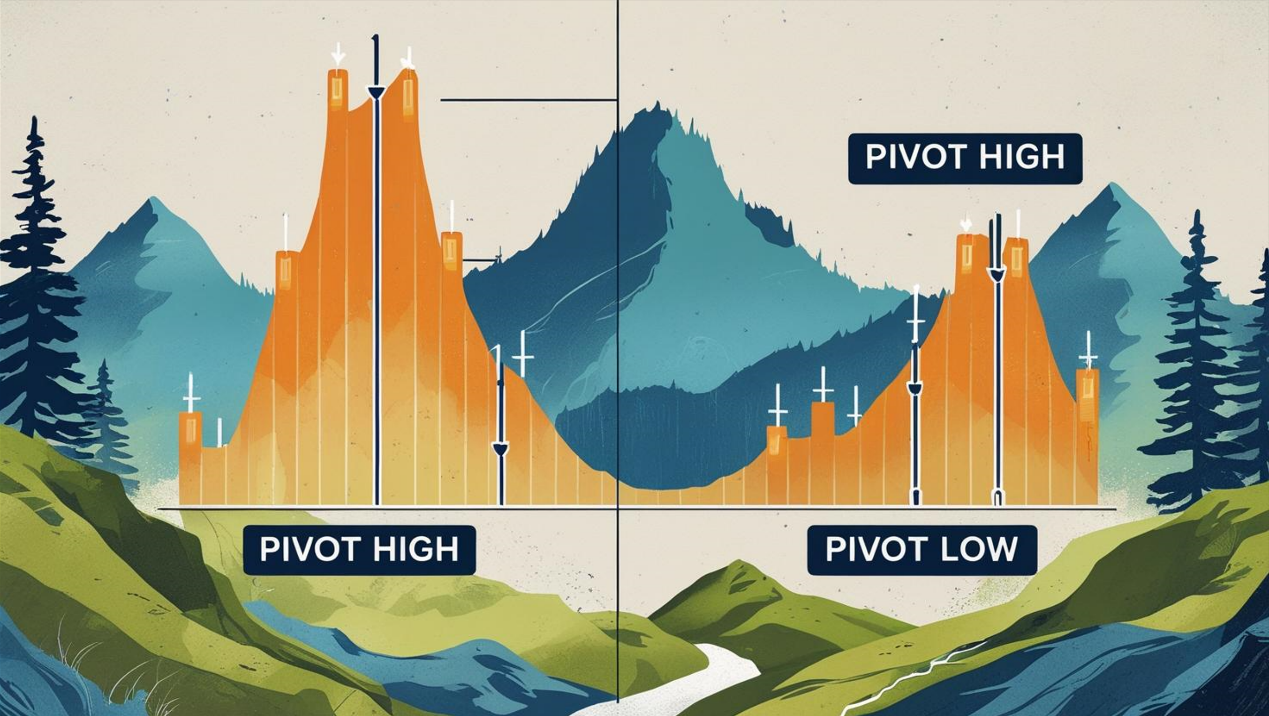
「Pivot High/Low (Fractal) Formation Explained」
Once you’ve identified these Pivot Highs/Lows, how do you use them to potentially make money?
Level 1: Basic Usage – Basic S/R and Trend Structure
As Immediate Support/Resistance:
Every Pivot High naturally acts as short-term resistance.
Every Pivot Low naturally acts as short-term support.
Price often reacts when it retests these levels. You can draw horizontal lines directly from these points.
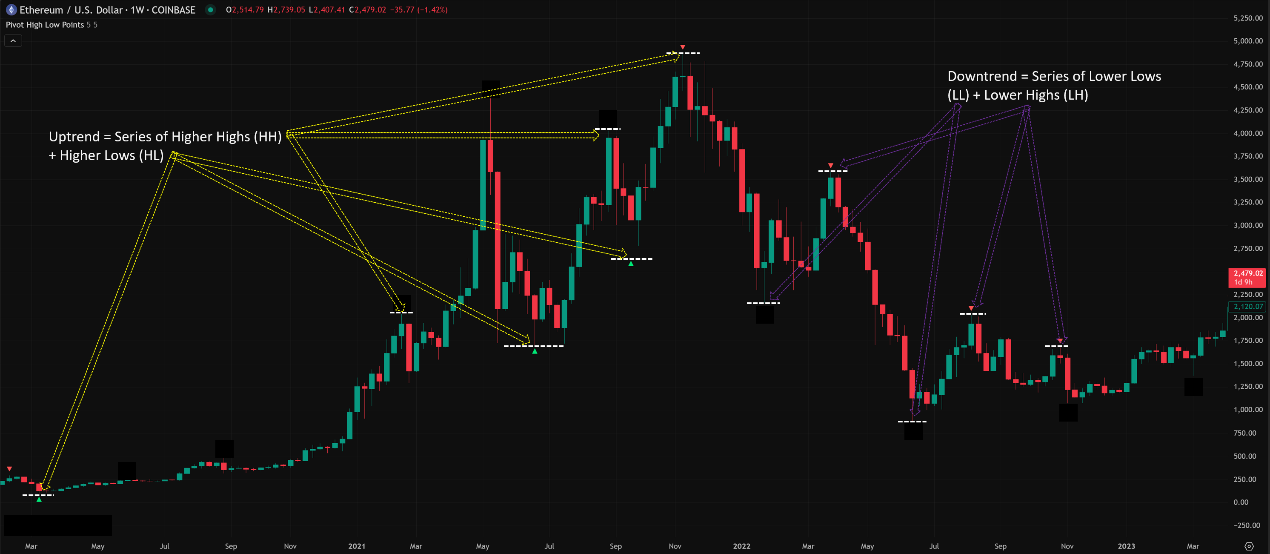
Defining Trend Structure:
This is the most fundamental and crucial use!
Uptrend: Look for a series of Higher Pivot Highs (HH) and Higher Pivot Lows (HL).
Downtrend: Look for a series of Lower Pivot Highs (LH) and Lower Pivot Lows (LL).
Trend Weakening/Reversal Signals:
In an uptrend, failure to make a new HH (forming an LH instead) is the first warning. Breaking below the previous HL might confirm a downtrend starting.
In a downtrend, failure to make a new LL (forming an HL instead) is the first warning. Breaking above the previous LH might confirm an uptrend starting.
「Using Pivot Points to Define Trend Structure (Uptrend)」
Level 2: Advanced Plays – Breakouts, Retests, Stops & Confluence
Mastered the basic structure? Let’s get more precise.
A. Breakout Trading:
Core Logic: When price closes decisively beyond a significant Pivot High or Pivot Low, it can signal the continuation of the existing trend or the beginning of a new one.
Break Above Pivot High: Potential buy signal, especially when making a new HH in an uptrend.
Break Below Pivot Low: Potential short signal, especially when making a new LL in a downtrend.
Key: Needs confirmation! Price merely touching the pivot point isn’t a breakout. Wait for a candle to close beyond the level. Combining with volume analysis (volume increase confirms breakout) is highly recommended.
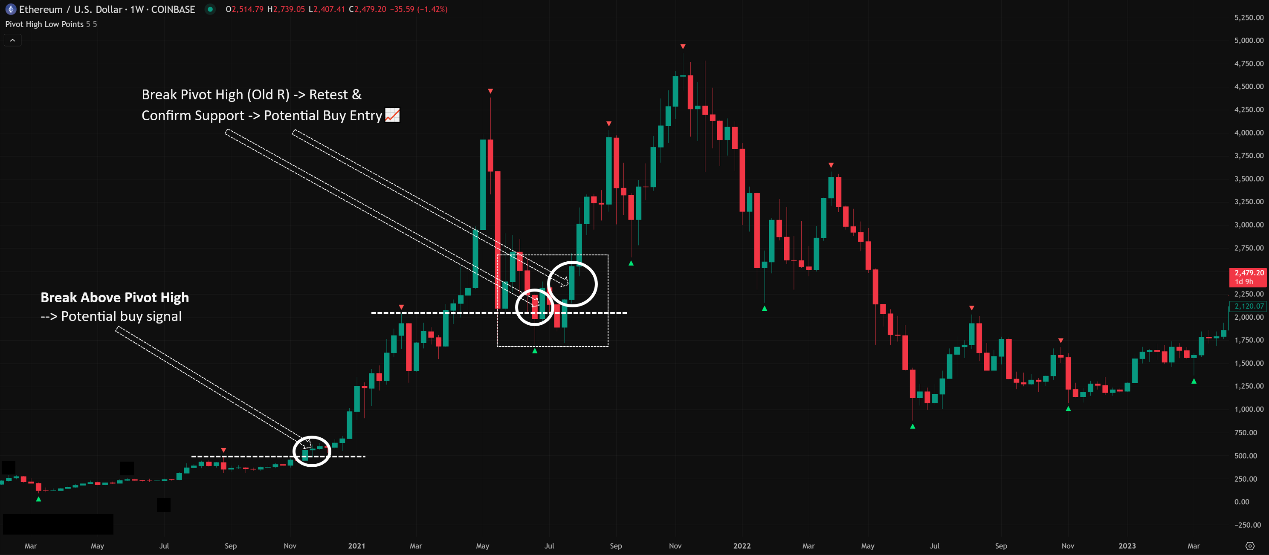
B. Retest Confirmation (Classic Setup!):
The Golden Setup: After price breaks above a Pivot High (former resistance), it often pulls back to test this level. If it holds (former resistance becomes new support), it offers a high-probability buying opportunity.
The Inverse: After price breaks below a Pivot Low (former support), it often rallies back to test this level. If it’s rejected (former support becomes new resistance), it offers a high-probability shorting opportunity.
Effectiveness: Waiting for a retest confirmation filters out many false breakouts compared to chasing the initial break. It often provides better entry points and more favorable risk/reward ratios.
「Pivot High Breakout & Retest Buy Example」
C. Setting Stop Losses:
Pivot Points High/Low are excellent references for stop loss placement!
Going Long: Place your stop loss slightly below the most recent meaningful Pivot Low.
Going Short: Place your stop loss slightly above the most recent meaningful Pivot High.
What’s “Meaningful”? Choose a Pivot Low/High that aligns with your trade’s timeframe and strategic logic. Not just any tiny wiggle. Often, it’s the previous HL (for longs in an uptrend) or the previous LH (for shorts in a downtrend).
Advantage: Placing stops behind levels where the market has already shown a turning point is logical and less likely to be hit by random noise.
D. The Power of Confluence:
Just like with Fibo levels, if a Pivot High/Low happens to align with other S/R levels, its significance increases exponentially!
Look for Confluence:
Pivot High + Fibonacci resistance level?
Pivot Low + Key Moving Average?
Pivot High/Low + Volume Profile POC/VAH/VAL?
Traditional Pivot Point S1/R1 + Pivot Low/High?
Effectiveness: Taking trades at these zones where multiple signals converge naturally leads to higher probability setups!
E. Parameter Settings & Timeframes (For the Tools!)
The Concept Itself: No parameters. A high is a high, a low is a low.
Indicator Tool Parameters (e.g., Fractals, Zig Zag):
Fractals:
Core Parameter: Periods Left/Right.
Default / Most Common: 2. (Middle bar > 2 bars left & 2 bars right). This is Bill Williams’ standard setting, offering a balance.
Larger Values (e.g., 3, 4, 5): Fewer Fractals, filters more noise, marks larger, more significant turning points. Better for longer-term traders or those wanting fewer signals.
Smaller Values (e.g., 1): Many more Fractals, marks tiny swing points. Potentially useful for extreme short-term scalpers, but very noisy.
Zig Zag:
Core Parameters: Deviation (%) / Depth (Points) / Backstep. (Names vary by platform).
These control how much the price must reverse (in % or points) before a new Zig Zag pivot is confirmed.
Larger Values: Filters more noise, shows only major swings, very smooth line.
Smaller Values: More sensitive to smaller reversals, shows more pivots.
Usage: Zig Zag parameters need tuning based on the asset’s volatility and your analytical goal. There’s no universal standard. Start with defaults and observe.
Timeframe Impact:
The significance of Pivot Points is directly proportional to the timeframe!
M1, M5, M15: Generates tons of pivots, most are just intraday noise with temporary S/R value.
H1, H4: Pivots become more meaningful, defining intraday or multi-day structure and S/R.
D1 (Daily): Daily Pivot Highs/Lows are very important S/R levels watched by many swing and position traders.
W1 (Weekly), MN (Monthly): Weekly and Monthly pivots represent major long-term turning points and are critical for macro analysis.
Consistency: Analyze pivots on your primary trading timeframe or one level higher for context.
F. Which Combos Are “Hot” & Effective? (Hottest Combos & Effectiveness)
No absolute “hottest,” but highly effective and practical frameworks exist:
The Classic: Breakout-Retest Confirmation
Combo: Pivot High/Low + Price Action + (Optional) Volume/Other Indicator Confirmation
Execution: Wait for price close beyond key Pivot -> Wait for price to retest the Pivot level -> Wait for confirming candle (e.g., Hammer at support) -> Enter.
Effectiveness: Relatively high probability strategy with manageable risk/reward, a trading staple.
Trend Continuation Entry: Trend Confirmation + Pullback to Prior Pivot Low / Rally to Prior Pivot High
Combo: HH/HL or LH/LL Structure + Pivot Low/High as Retracement Target + Candle Signal
Execution: Confirm uptrend (HH/HL) -> Wait for pullback near previous Pivot Low (HL) -> Look for bullish candle -> Consider long/add-on. Reverse for downtrend.
Effectiveness: Uses structural pullback points for entries within an established trend.
Confluence Trading: Pivot High/Low + Fibo/MA/VP Confluence Zone + Candle Signal
Combo: Multiple S/R Tools + Pivot Point + Candle Pattern
Execution: Identify “super zones” where Pivot High/Low overlaps with other key S/R -> Wait patiently for high-quality reversal candle signals within these zones.
Effectiveness: Focuses trading capital on the highest probability areas.
G. Best Parameter Combos? (Optimal Settings Verdict)
The Concept Itself: No parameters.
Fractals Indicator:
Standard/Most Common: 2 periods left/right. Good for most situations.
Fewer, Stronger Signals: Try 3 periods.
More, Faster Signals (Higher Risk): Try 1 period (uncommon).
Zig Zag Indicator:
No Standard Answer! Parameters MUST be tested and adjusted based on asset volatility, timeframe, and how much noise you want to filter. Start with defaults and observe.
Timeframe:
Higher is More Reliable! Daily (D1) pivots and above are most significant.
Use depends on your trading style.
Conclusion: The power of Pivot Points High/Low isn’t about tweaking parameters, but about understanding the market structure they reveal on different timeframes and how you combine that insight with other tools (especially confluence and price action confirmation).
The concept of Pivot Points High/Low (whether identified manually or via indicators) is fundamental to understanding market structure, trends, and key S/R levels in technical analysis. They are the “skeleton” of the price chart.
They help you:
Define and confirm trends (HH/HL, LH/LL).
Identify high-probability support and resistance zones.
Spot breakout and retest trading opportunities.
Set more logical stop-loss levels.
Increase analytical accuracy through Confluence.
For all young traders wanting to read the story behind the charts and master the market’s rhythm, mastering the identification and application of Pivot Points High/Low is an absolutely essential core skill!
Remember:
They are the foundation of market structure.
Higher timeframe pivots carry more weight.
Breakouts need confirmation; retests are golden opportunities.
Confluence is your best friend!
Understand how indicator parameters (if used) affect the pivots identified.
ALWAYS combine with Price Action for final decisions!
Alright! Hope this breakdown of Pivot Points High/Low gives you a solid grasp of this fundamental yet crucial concept! Start identifying these key turning points on your charts! See ya next time! Trade with structure! ️