Physical Address
304 North Cardinal St.
Dorchester Center, MA 02124
Physical Address
304 North Cardinal St.
Dorchester Center, MA 02124
What up, Floor Ninjas and Intraday Slayers! Time for another session at the Technical Analysis Boot Camp! Last time we talked about using those “natural” Pivot Points High/Low for analysis. Today, we’re unlocking a different beast, practically the “Day Trader’s Playbook,” an indicator automatically calculated by the computer: the standard Pivot Points indicator! You know the one – that PP line on your chart with several R lines above and S lines below. That’s Pivot Points Standard! ️
This isn’t about guessing support and resistance; it uses the previous trading session’s (usually yesterday’s) High, Low, and Close (HLC) to calculate a series of potential key levels for today (or the current session)! Many intraday and short-term traders check these Pivot Levels first thing when the market opens!
Wanna know why these lines are so popular? How they’re calculated? How to use them to gauge intraday strength, find entry points, or even set targets? Which Pivot calculation method is the most common? Okay! Let’s dive deep into the core of Pivot Points Standard, from theory to practical strategies! Let’s find the daily roadmap!
The history of Standard Pivot Points predates fancy computer charts!
Origin: Floor Traders’ Wisdom – Back in the day, before computers dominated trading floors, traders yelling in the pits needed a quick and simple way to estimate the day’s potential trading range and key turning points.
Pre-Market Calculation: They’d take yesterday’s High, Low, and Close (HLC), use a basic set of formulas, and calculate today’s Pivot Point (PP) and several support (S1, S2…) and resistance (R1, R2…) levels before the opening bell. They’d literally jot these down on a card.
Quick Reference Points: These calculated levels became crucial reference points for making fast buy/sell decisions during the chaotic trading session. For example, price hitting R1 might be a trigger to consider selling; price hitting S1 might be a trigger to consider buying.
Computerization & Popularization: With the rise of electronic trading, these calculations were naturally coded into indicators, automatically displayed on charts, making them accessible to everyone. While several variations exist (more below), the “Standard” or “Classic” Pivot Points based on HLC remain the most popular.
Self-Fulfilling Prophecy Continues: Just like Fibo levels, because so many traders watch the same set of Pivot Levels, buy/sell orders and stop losses naturally cluster around these prices, which helps reinforce their effectiveness as S/R.
So, Pivot Points Standard originated from the practical needs of floor traders for quick daily level estimation, were later automated, and remain effective partly due to their widespread use.
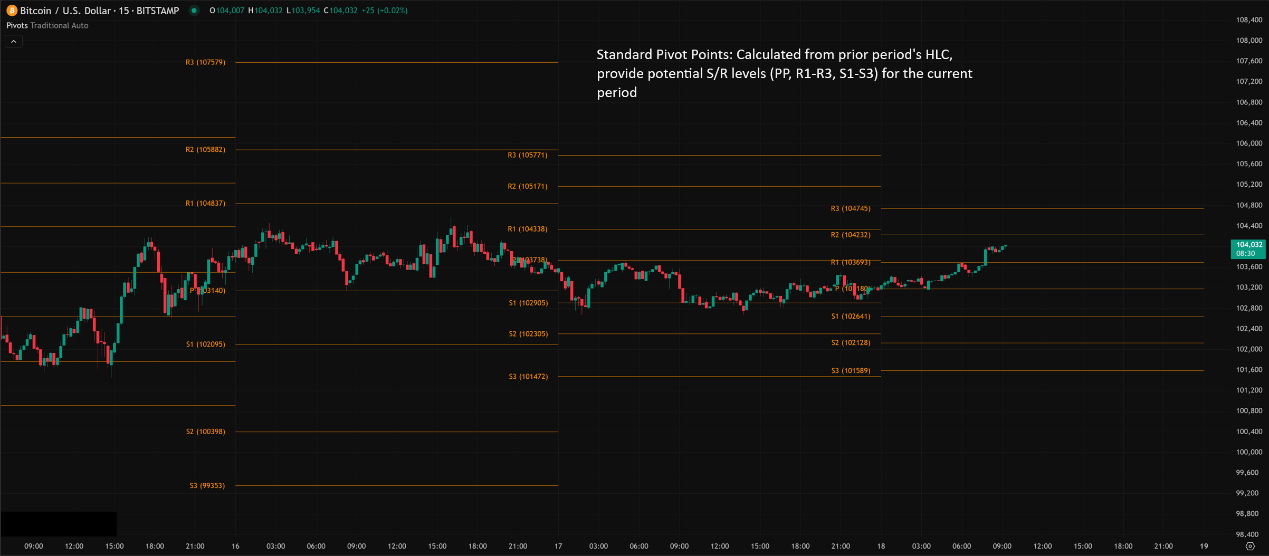
The core idea of Standard Pivot Points is using the previous period’s data to project potential levels for the current period. The most common application is Daily Pivot Points (using yesterday’s data for today’s levels).
Step One: Define the “Previous Period”
For Daily Pivots, use yesterday’s High, Low, Close.
For Weekly Pivots, use the previous week’s High, Low, Close.
For Monthly Pivots, use the previous month’s High, Low, Close.
Step Two: Calculate the Pivot Point (PP)
This is the central balance point.
Standard Calculation (Classic / Floor):
PP = (Previous High + Previous Low + Previous Close) / 3
PP represents a sort of “center of gravity” or “average value” concept from the previous period.
Step Three: Calculate Support Levels (S1, S2, S3…)
These are potential support zones below the PP.
Standard Calculation:
S1 = (PP * 2) – Previous High
S2 = PP – (Previous High – Previous Low)
S3 = S1 – (Previous High – Previous Low) (Some formulas vary
slightly, e.g., S3 = Previous Low – 2 * (Previous High – PP))
The key isn’t memorizing formulas, but knowing they’re derived from PP and the previous period’s range.
Step Four: Calculate Resistance Levels (R1, R2, R3…)
These are potential resistance zones above the PP.
Standard Calculation:
R1 = (PP * 2) – Previous Low
R2 = PP + (Previous High – Previous Low)
R3 = R1 + (Previous High – Previous Low) (Some formulas vary slightly, e.g., R3 = Previous High + 2 * (PP – Previous Low))
The Final Result: You see a set of fixed horizontal lines on today’s chart: a central PP line, with R1, R2, R3… above it, and S1, S2, S3… below it. These lines do not change throughout the current session (if calculating Daily Pivots) and provide a framework for the day’s price action.
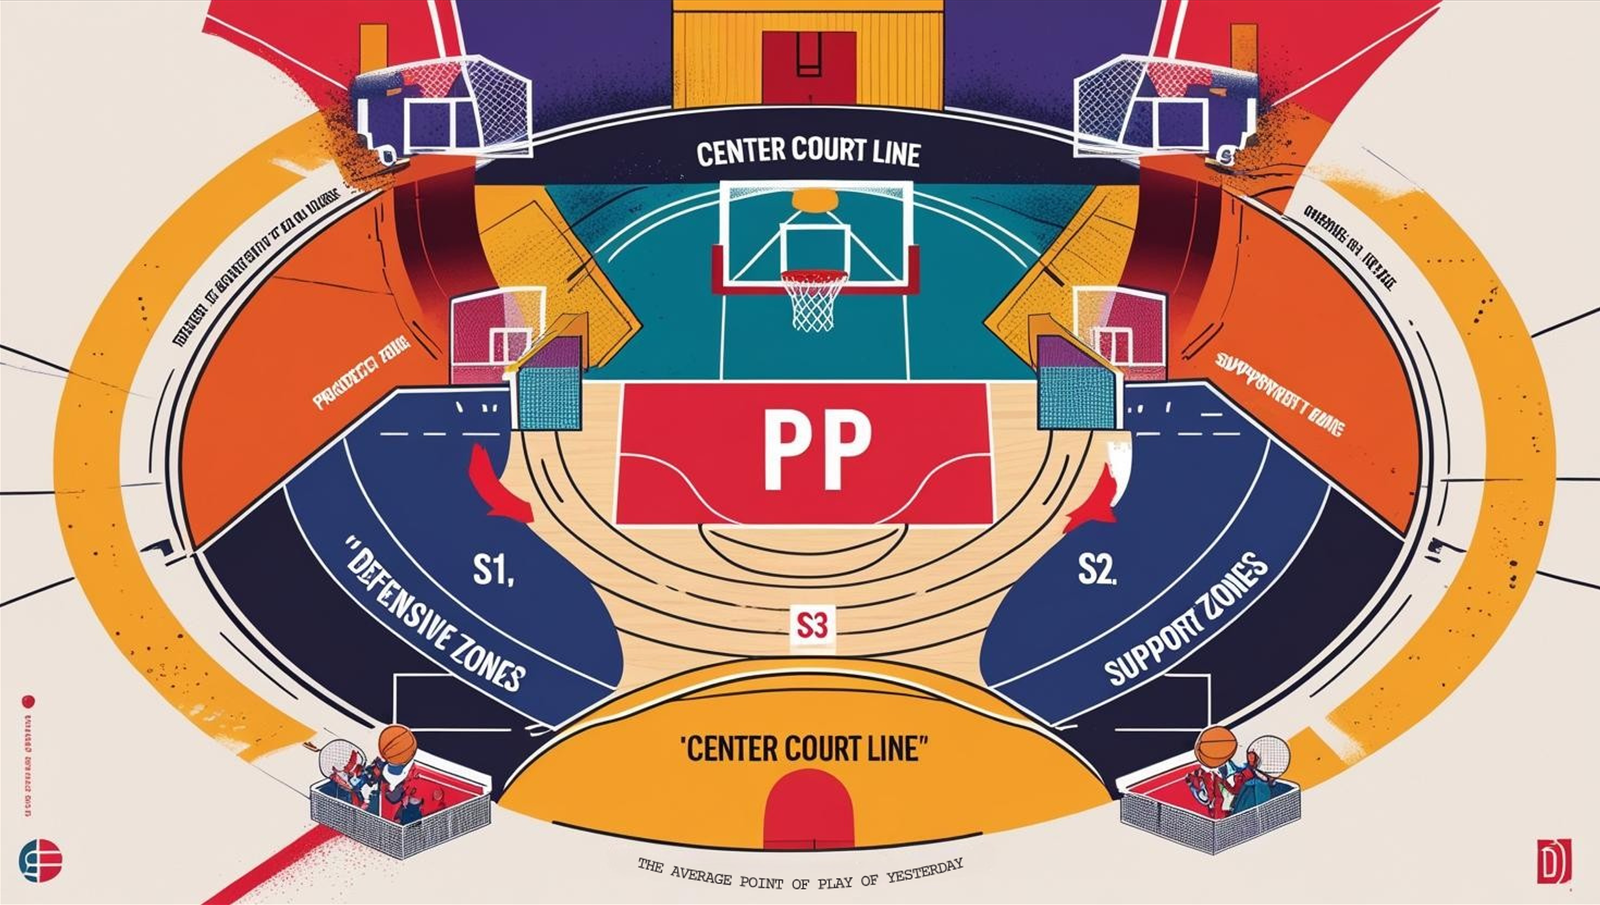
Think of a Basketball Game’s “Center Court” and “Defensive Zones”:
PP is like the “center court line,” the average point of play from yesterday.
R1/R2/R3 are like projected “defensive zones” the opposing team might hit if they push up today, based on yesterday’s action.
S1/S2/S3 are like projected “support zones” your team might fall back to if pushed down today.
「Pivot Points Standard Elements Explained」
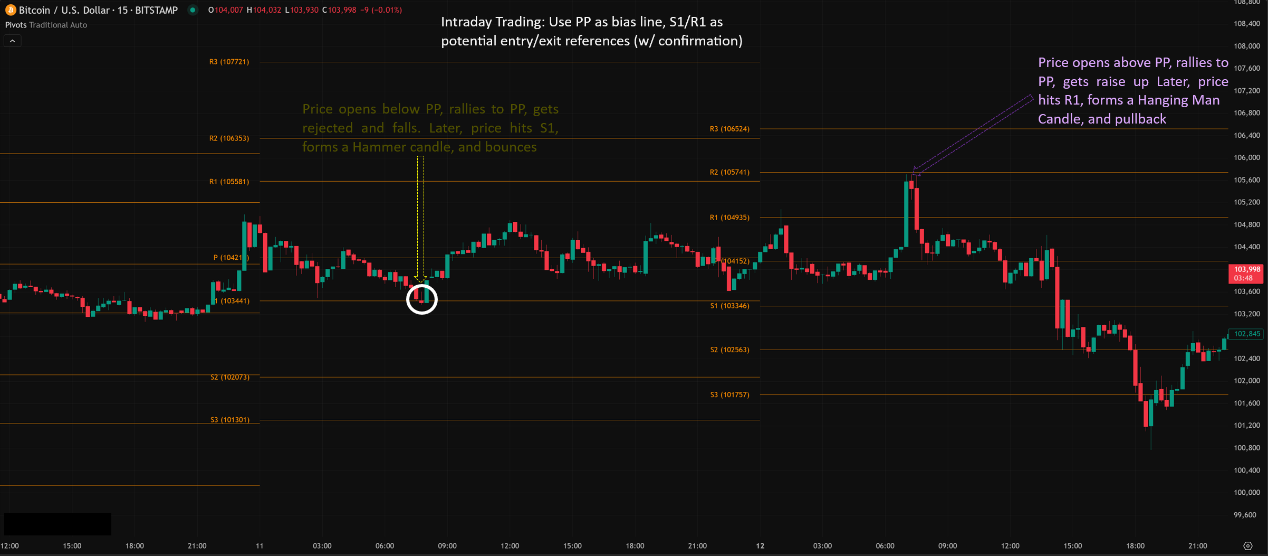
Level 1: Basic Usage – Intraday S/R Trading & Bias
Core Use: Intraday Support & Resistance
Pivot Levels (especially PP, S1, R1) are the go-to levels for Day Traders looking for intraday bounce/rejection opportunities.
Strategy:
Price drops near S1, S2, or S3, shows bullish signal -> Potential buy opportunity.
Price rallies near R1, R2, or R3, shows bearish signal -> Potential short opportunity.
The PP Line: A crucial intraday bull/bear line. Price holding above PP favors longs; price below PP favors shorts. PP itself is also significant S/R.
Determining Intraday Market Bias:
Opening Price vs. PP:
Open > PP: Intraday sentiment might be bullish; look for buying opportunities on pullbacks to PP or S1.
Open < PP: Intraday sentiment might be bearish; look for shorting opportunities on rallies to PP or R1.
Price Consistently Trading Above/Below PP:
Price spending most of the time above PP confirms intraday bullish bias.
Price spending most of the time below PP confirms intraday bearish bias.
「Pivot Points for Intraday S/R Trading Example」
Level 2: Advanced Plays – Breakouts, Targets, Confluence & Variations
Breakout Trading:
Breaking R1/S1: A strong close beyond R1 or S1 often suggests price will continue towards R2 or S2.
Break above R1 -> Target R2.
Break below S1 -> Target S2.
Breaking R2/S2: An even stronger signal, potentially targeting R3/S3.
Confirmation: Breakouts are stronger with increasing volume. Waiting for a retest of R1/S1 as support/resistance after the break can also improve reliability.
Using Pivot Levels for Profit Targets:
If you buy at S1, PP and R1 become logical initial profit targets.
If you short at R1, PP and S1 become logical initial profit targets.
Depending on market volatility and trend strength, targets can be extended to S2/R2 or even S3/R3.
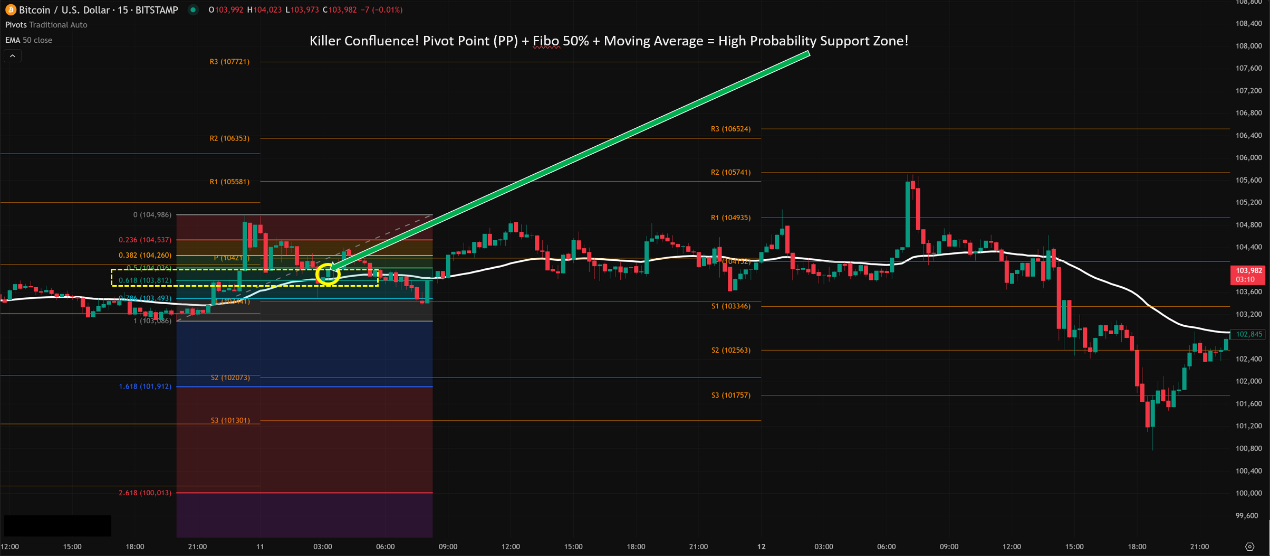
Power of Confluence (Again!):
Cannot stress this enough! Pivot Levels become much more powerful when they overlap with other S/R factors!
Look for Confluence:
Pivot S1 + Fibo 38.2%?
Pivot R2 + Previous High (Pivot High)?
Pivot PP + 50 EMA?
Pivot S2 + Volume Profile VAL?
Effectiveness: Trade signals occurring at these confluence zones are the high-probability setups you want to focus on!
「Pivot Point Confluence Example (PP + Fibo 50% + MA)」
Awareness of Other Pivot Point Calculation Methods:
While “Standard/Classic/Floor” is most common, you might encounter other types:
Woodie’s Pivots: Gives more weight to the Close price when calculating PP [PP = (H + L + 2*C) / 4]. S/R calculations also differ.
Camarilla Pivots: Calculates a set of 8 levels (4 R, 4 S) that are closer together, primarily used for range breakout and short-term reversal trading. Popular among Forex traders.
Fibonacci Pivots: Uses the standard PP calculation, but S/R levels are derived by adding/subtracting Fibonacci ratios (38.2%, 61.8%, 100%) of the previous day’s range (H-L) to the PP.
Demark Pivots: More complex calculation based on conditional relationships between open, high, low, close to project turning points, not directly using HLC in the standard way.
Key Takeaway: You don’t need to master all! But know that different types exist and understand which one your platform defaults to (usually Standard). If you specialize in a certain style (like short-term range trading), exploring Camarilla might be worthwhile.
Core Parameter 1: Calculation Periodicity
This is the most important setting! Determines which prior period’s HLC is used.
Common Choices & Effects:
Daily:THE MOST COMMON! Uses yesterday’s HLC for today’s levels. Standard for Day Traders and short-term analysis.
Weekly: Uses last week’s HLC for this week’s levels. Great for Swing Traders looking at key levels within the week. These levels are generally stronger than Daily Pivots.
Monthly: Uses last month’s HLC for this month’s levels. Best for Position Traders and long-term investors looking at major levels. Strongest significance.
Yearly: Rarely used, but provides ultra-long-term macro levels.
(Intraday Pivots – e.g., 4H, 1H): Some platforms allow this, using the prior H4/H1 HLC for the current H4/H1 levels. Less common and potentially less reliable than Daily.
Global Trader Usage: Daily Pivots are the universal language for day traders. Swing Traders heavily watch Weekly. Long-term players reference Monthly. For 24/7 Crypto, Daily Pivots usually follow the UTC day.
Core Parameter 2: Pivot Type
Platforms usually let you choose Standard/Classic/Floor, Fibonacci, Camarilla, Woodie’s, Demark, etc.
Standard/Most Common: Standard (Classic/Floor).
Chart Timeframe Application:
Pivot Levels (Daily, Weekly, Monthly) are fixed horizontal lines; they appear the same regardless of the chart timeframe you’re viewing (M5, H1, D1, etc.).
The Key is Matching:
If you are a Day Trader, you primarily watch Daily Pivots, observing price interaction with these levels on M5, M15, or H1 charts.
If you are a Swing Trader (holding for days/weeks), you primarily watch Weekly Pivots (maybe referencing Daily too), doing your analysis and finding entries on H4 or D1 charts.
If you are a Position Trader, you primarily watch Monthly Pivots, making decisions on D1 or W1 charts.
Which Combos Are “Hot” & Effective? (Hottest Combos & Effectiveness)
Pivot Points derive power from their objectivity and widespread use.
Most Common / Foundational: Daily Pivots on Intraday Charts (e.g., M15, H1)
Execution: Load Daily Pivots before the session starts. Watch price interact with PP, S1, R1. Use candle patterns at these levels for short-term S/R trades or to gauge intraday bias.
Effectiveness: Provides a clear, objective framework for navigating the trading day.
Swing Trader Favorite: Weekly Pivots on H4/D1 Charts + Confluence
Execution: Use Weekly Pivots to identify key S/R zones for the entire week. On H4 or D1 charts, wait for price to reach these Weekly levels AND confluence with other S/R factors (e.g., Daily Pivot, MA, Fibo). Enter based on price action confirmation.
Effectiveness: Catches higher-probability swing turning points.
Highest Confirmation: Pivot Level + Confluence + Volume + Candle Signal
Execution: The ultimate combo! Wait for price to hit a confluence zone involving a Pivot Level. Look for confirming volume (e.g., volume spike at support) AND a clear reversal candlestick pattern.
Effectiveness: Filters out as much noise as possible to identify high-quality trading opportunities.
Best Parameter Combos? (Optimal Settings Verdict)
Calculation Periodicity:
Day Trading: Daily is standard, can’t go wrong.
Swing Trading: Weekly is core, potentially supplemented by Daily.
Long Term: Monthly provides the macro view.
Pivot Type:
Standard (Classic / Floor) is the most widely used and understood. Start here. Explore others only if you have a specific reason and test thoroughly.
Conclusion: The “best” way to use Standard Pivot Points involves choosing the right Periodicity (Daily/Weekly/Monthly) for your trading style and using those levels as a core S/R framework, constantly looking for confluence with other analysis tools.
Standard Pivot Points are a time-honored, widely popular technical analysis tool that provides objective, forward-looking support and resistance levels based on simple HLC calculations.
They help you:
Quickly identify key S/R levels for the current trading session.
Determine short-term market sentiment bias (above/below PP).
Set logical targets and stop-loss references for intraday/swing trades.
Spot breakout and reversal opportunities (especially retests).
Significantly enhance trade signal quality through Confluence.
For young traders needing a clear, objective S/R framework to guide their decisions, especially Day Traders and Swing Traders, mastering Standard Pivot Points is absolutely fundamental!
Remember:
They use past data to project levels for the current period.
PP, S1, R1 are the most frequently tested levels.
Choosing the right Periodicity (Daily/Weekly/Monthly) defines their application.
Confluence is critical; relying solely on Pivot levels might not be enough.
Combine with Price Action and other indicators for confirmation!
Alright! Hope this comprehensive guide to Pivot Points Standard helps you leverage this “daily map” effectively! Load them onto your charts and see if price respects the levels! See ya next time! Trade the levels! ️✅