Physical Address
304 North Cardinal St.
Dorchester Center, MA 02124
Physical Address
304 North Cardinal St.
Dorchester Center, MA 02124
What’s cracking, fam! The technical analysis adventure continues! After breaking down a bunch of volume indicators, the one we’re introducing today has a somewhat “counter-intuitive” approach, specializing in tracking what’s sometimes called “Uninformed Money” or “Herd Mentality” – say hello to the PVI (Positive Volume Index)!
Sounds weird, right? Why track the “less informed” money? Because the theory behind PVI suggests that the real pros, the smart money, often make their moves when volume is low (they don’t want to alert the market), while retail traders or trend-followers tend to jump in and out on days when volume is high. PVI specifically captures price changes only on days when volume increases, aiming to gauge the market impact of this “crowd” activity.
Wanna know how PVI is calculated? How it’s used to potentially judge if the market is in a bull or bear phase? How it differs from its sibling, the NVI (Negative Volume Index)? How to use its Moving Average line for signals? Okay! Tune in, ’cause we’re about to give PVI the full breakdown! Let’s get this positive vibe check! ✨
PVI doesn’t usually stand alone; it’s often mentioned alongside its sibling, NVI (Negative Volume Index). Their design philosophies stem from observing market behavior at different volume levels.
Conceptual Originators: Paul Dysart & Norman Fosback – The core idea might trace back to Paul Dysart in the 1930s, but it was primarily Norman Fosback who formalized, systematically studied, and popularized PVI and NVI. He detailed them in his 1976 book, Stock Market Logic.
Core Philosophy:Differentiating “Smart Money” from “The Crowd” – Fosback’s theory posits that:
Smart Money: Tends to be discreet, preferring to trade on quiet days with low volume when fewer eyes are watching. Their activity is theoretically captured by the NVI (Negative Volume Index) (which only accumulates price changes on days when volume decreases).
The Crowd / Uninformed Investors: More susceptible to market noise and news, tending to follow trends and trade on days when volume is high and the market is active. Their activity is theoretically captured by the PVI (Positive Volume Index).
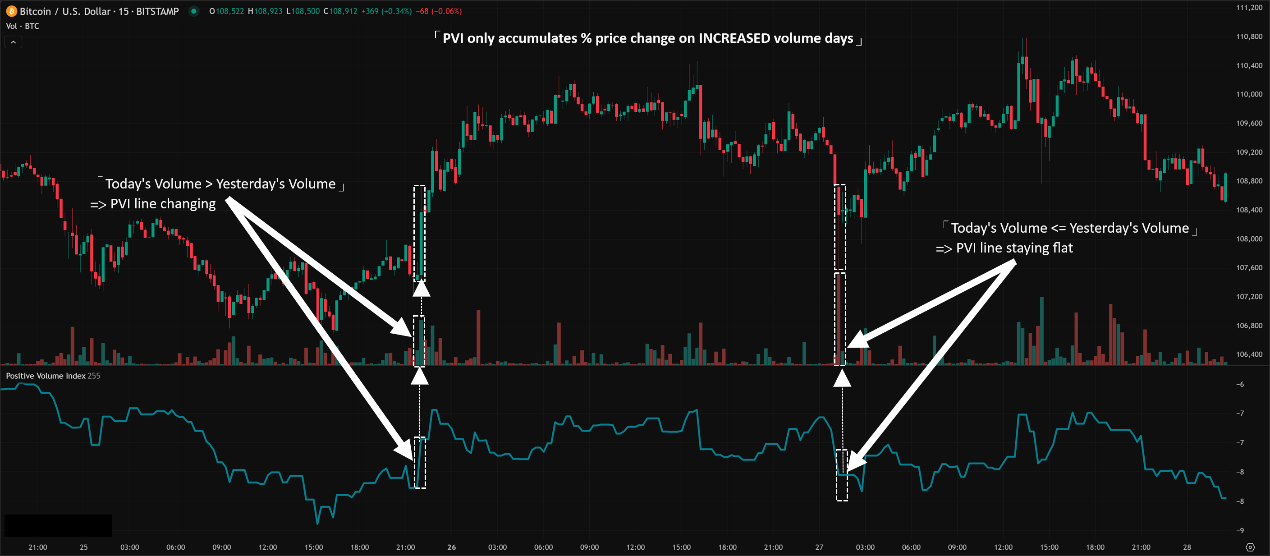
PVI’s Purpose: Quantifying Price Trends on “Active Days” – PVI was designed to accumulate percentage price changes only on days when volume is higher than the previous day. The goal is to see whether price tends to move up or down when market participation increases (i.e., when things get “noisier”), thereby inferring whether the “crowd momentum” is bullish or bearish.
So, PVI was born from a theory differentiating market participants, aiming to measure the potential trend driven by less-informed or momentum-chasing money by focusing exclusively on days with increased volume.
PVI’s calculation is unique due to its conditional accumulation.
Step One: Volume Comparison
Compare today’s volume to yesterday’s volume.
Step Two: Conditional Accumulation of Percentage Price Change
IF Today’s Volume > Yesterday’s Volume: (On days volume increased)
Today’s PVI = Yesterday’s PVI * [ 1 + (Today’s Close – Yesterday’s Close) / Yesterday’s Close ]
(Meaning: On high-volume days, apply today’s percentage price change to the previous PVI value, compounding it.)
IF Today’s Volume <= Yesterday’s Volume: (On days volume was flat or decreased)
Today’s PVI = Yesterday’s PVI (No change!)
(Meaning: On days volume didn’t increase, PVI ignores the price change completely and stays flat.)
Starting Point: The first day’s PVI is typically initialized at 100 or 1000.
Core Points:
PVI only changes on days when volume increases. On days with flat or decreasing volume, the PVI line is horizontal.
It accumulates percentage price changes, making it an index reflecting compounding effects.
Like OBV and A/D Line, the absolute value of PVI isn’t very meaningful. What matters is its trend direction and, crucially, its relationship with its own Moving Average (MA).
Think of Party FOMO:
Increased volume is like the party suddenly getting crowded and loud (market activity picks up).
PVI exclusively records the crowd’s mood (price up/down) during these “loud, busy” moments and accumulates that sentiment. On days the party quiets down, PVI doesn’t care.

「PVI Calculation Logic Explained」
PVI’s usage is quite distinct, often relying heavily on its relationship with its moving average.
Level 1: Basic Usage – Theoretical Interpretation & Trend Observation
Theoretical Market State Interpretation:
PVI Rising: Theoretically indicates that on high-volume days, prices tend to rise. Could reflect “crowd” optimism; market might be bullish.
PVI Falling: Theoretically indicates that on high-volume days, prices tend to fall. Could reflect “crowd” panic or bearishness; market might be bearish.
PVI Flat: Could mean price changes on high-volume days are cancelling out, or there haven’t been many days with increased volume recently.
Important Caveat: This is the theoretical basis. In practice, looking solely at the PVI line’s direction might provide unclear or lagging signals.
Observing with NVI (The PVI/NVI Combo):
The classic approach involves looking at PVI and NVI together.
Ideal Bull Market: Both PVI and NVI rising (price tends up on both active and quiet days).
Smart Money Led Bull: NVI rising, PVI flat or slightly up (buying strong on quiet days, crowd sentiment neutral on active days).
Crowd Led Bull / Potential Bubble: PVI rising sharply, NVI flat or falling (strong buying on active days, but no smart money support on quiet days).
Bear Market: Both PVI and NVI falling.
Note: This interpretation is quite conceptual and less commonly used for direct trading decisions nowadays.
Level 2: Advanced Plays – MA Crossover is KING!
This is the most common and widely accepted practical application of PVI!
A. PVI Crossovers with its Moving Average (MA):
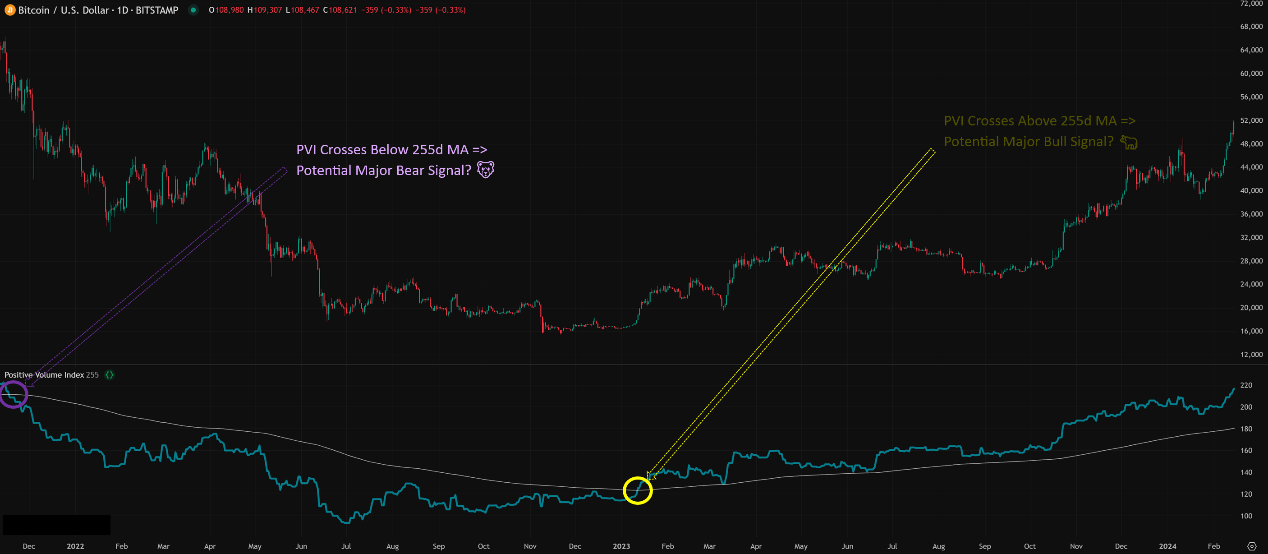
The Core Play: Add a long-term Moving Average onto the PVI line itself. The standard is typically a 255-day SMA (Simple Moving Average), representing approximately one year of trading days.
Generating Signals:
PVI Crosses ABOVE its 255-day MA: Potential Major Bull Market Signal. Fosback’s research suggested this has a higher probability of signaling the start of a long-term bull market. It implies that even on active days (potentially crowd-driven), the long-term cumulative price trend has turned positive.
PVI Crosses BELOW its 255-day MA: Potential Major Bear Market Signal. Suggests that on active days, the long-term cumulative price trend has turned negative, potentially signaling a bear market.
Why the 255-day MA?
This very long period aims to filter out short-term noise and capture major, long-term trend shifts.
PVI’s calculation method (only changing when volume increases) can make the line choppy or have long flat periods, requiring a long MA for smoothing and meaningful trend signals.
Fosback’s backtesting indicated the one-year MA worked well historically.
「PVI and 255-day MA Crossover Example」
B. PVI vs. MA Position as a Market State Filter:
How to Use: Use the PVI’s position relative to its long-term MA as a filter to gauge whether the overall market environment is likely in “bull mode” or “bear mode” for your other trading strategies.
PVI > 255-day MA: Market potentially in a long-term bull phase. You might lean towards long-only trades or have more confidence in buy signals from other systems.
PVI < 255-day MA: Market potentially in a long-term bear phase. You might lean towards short-only trades (if applicable), be more cautious with buy signals, or avoid longs altogether.
Effectiveness: Helps traders align with the broader market tide, potentially avoiding fighting strong underlying trends.
C. Observing Divergence: Less Common but Possible
Theoretically, divergence can be observed on PVI: Price makes new highs/lows, but PVI fails to confirm.
In Practice:
Because PVI only changes when volume increases, its line can be less smooth than RSI/MACD, making divergence signals potentially less clear or reliable.
Market focus is typically on the PVI’s relationship with its MA.
If a very clear, prolonged PVI divergence occurs, it could serve as a secondary warning, but must be confirmed by MA crossovers and price action.
D. Parameter Settings & Time Intervals (The PVI Parameter Puzzle)
Core PVI Calculation: NO Parameters! Like OBV and A/D Line, the basic cumulative calculation requires no period setting.
The Key Parameter: The MA Period!
Standard / Most Common: 255-period SMA (applied to Daily charts). This is the standard proposed by Fosback and widely accepted, aimed at capturing long-term trends.
Why 255? Approximates the number of trading days in a year (differs slightly by market, 250-260 are common approximations).
How Global Traders Play It?
Vast majority stick to the 255-day MA (or similar yearly period). They accept PVI as a long-term indicator, and using short MAs defeats its purpose and Fosback’s research basis.
Experimenting with Shorter MAs?
Feasibility: Technically possible to apply any MA period (e.g., 50, 20) to PVI.
Effect: Shorter MA periods yield more frequent crossovers, but the reliability dramatically decreases, leading to many false signals. PVI’s inherent choppiness and flat periods make short MAs generally ineffective.
Conclusion: Very few traders use short MAs with PVI. If you need shorter-term signals, use indicators designed for that purpose (RSI, Stochastics, MACD, etc.).
Choosing the Timeframe:
Most Common: Daily Chart. Because the 255-day MA is based on the yearly concept.
Weekly Chart: Also usable, potentially adjusting the MA period accordingly (e.g., a 52-week MA) for an even broader macro view.
Intraday Timeframes (H4, H1, M15, etc.): STRONGLY NOT RECOMMENDED! PVI’s core concept (differentiating active/quiet days) and its long-term MA crossover strategy become essentially meaningless on short timeframes; noise will completely dominate any potential signal.
E. Which Combos Are “Hot” & Effective? (Effective PVI Strategies)
Effective PVI strategies almost exclusively revolve around its relationship with its long-term MA.
Core Strategy: PVI + 255-Day SMA Crossover System
Execution:
Apply PVI on a Daily chart.
Overlay a 255-day SMA on the PVI line.
PVI crosses above MA -> Potential long-term buy signal / entry into bull mode.
PVI crosses below MA -> Potential long-term sell/exit signal / entry into bear mode.
Note: These are very long-term, lagging signals, unsuitable for short-term trading. Their value lies in capturing major trend shifts.
Auxiliary Strategy: PVI Market State Filter
Execution:
Use PVI vs. its 255-day MA to determine current mode (Bull > MA, Bear < MA).
Only consider executing other buy strategies when in bull mode.
Only consider executing other short strategies (if applicable) when in bear mode.
Effectiveness: Increases the odds of your other strategies succeeding by aligning them with the long-term PVI-indicated tide.
F. Best Parameter Combos? (The Optimal Setting Verdict)
PVI Indicator Itself: No parameters.
Moving Average on PVI:
Standard / Best Practice: 255-period SMA (applied to Daily chart). This is the setting with the most historical backing and research.
Other Long-Term Options: A 200-period SMA (another common long-term MA) or a 52-week SMA (on Weekly charts) could also be considered.
Short-Term MAs: Strongly discouraged for PVI.
Conclusion: PVI’s “best partner” is its long-term moving average (typically 255-day SMA), and it’s best used on Daily or Weekly charts.
The Positive Volume Index (PVI) is a rather unique volume-related indicator. Its core concept attempts to track the long-term impact of less-informed investors or “the crowd” on price by focusing exclusively on days with increased volume.
Its main value lies in:
Offering a unique market perspective: Theoretically distinguishing “smart money” vs. “crowd” when combined with NVI.
Generating very long-term trend signals: Via crossovers with its 255-day MA.
Acting as a market state filter: Gauging potential long-term bull or bear modes.
For young traders interested in exploring classic, philosophy-driven, long-term indicators, PVI is worth knowing about. However, be aware:
It is a very lagging indicator; primary signals come from MA crossovers.
The underlying theory (smart money vs. crowd) is a simplification; real markets are more complex.
Not suitable for short-term trading.
Must be combined with other analysis tools and price action.
Hope this deep dive into PVI gives you a clearer understanding of this somewhat “alternative” indicator! See ya next time! Stay curious, stay informed!