Alright, all you traders on the front lines, Crypto Headz, and Fintech Geeks! Wanna see the real structure of a trend on your charts? Relying on just one or two moving average lines can sometimes get you faked out by noise. Today, we’re breaking down a visually stunning indicator that helps you feel the market’s “flow” – the EMA Ribbon (Exponential Moving Average Ribbon)! Think of it like turning on “trend thermal vision,” letting you see instantly if that trend is legit!
What the heck is an EMA Ribbon? How’s it different from GMMA?
An EMA Ribbon is basically what happens when you throw a whole bunch of EMAs with different periods onto the same chart. Instead of just one or two EMAs, the Ribbon goes for the “squad goals” approach, usually using 6-8 or even more EMAs.
「EMA Ribbon: Visualizing Trend with Multiple Lines」
How’s it different from GMMA (Guppy Multiple Moving Average)?
- GMMA explicitly separates short-term and long-term groups, focusing on their interaction.
- EMA Ribbon is usually one continuous set of EMAs (e.g., 5, 10, 15, 20, 25, 30, 35, 40 EMA) or uses sequences like Fibonacci numbers (e.g., 5, 8, 13, 21, 34, 55…). Its focus is on the overall shape, width, and direction of the entire Ribbon, creating a dynamic view of trend strength and a support/resistance zone.
EMA Ribbon’s Origin Story & Design: Why So Many Lines?
Unlike GMMA with Daryl Guppy, the EMA Ribbon doesn’t have a single, famous inventor. It’s more like a visualization technique that evolved within the trading community. Why do it this way?
- Overcoming Single MA Weaknesses: Single MAs are prone to whipsaws (fakeouts), especially in choppy markets. Multiple lines can confirm each other, filtering out some noise.
- Visualizing Trend Strength:
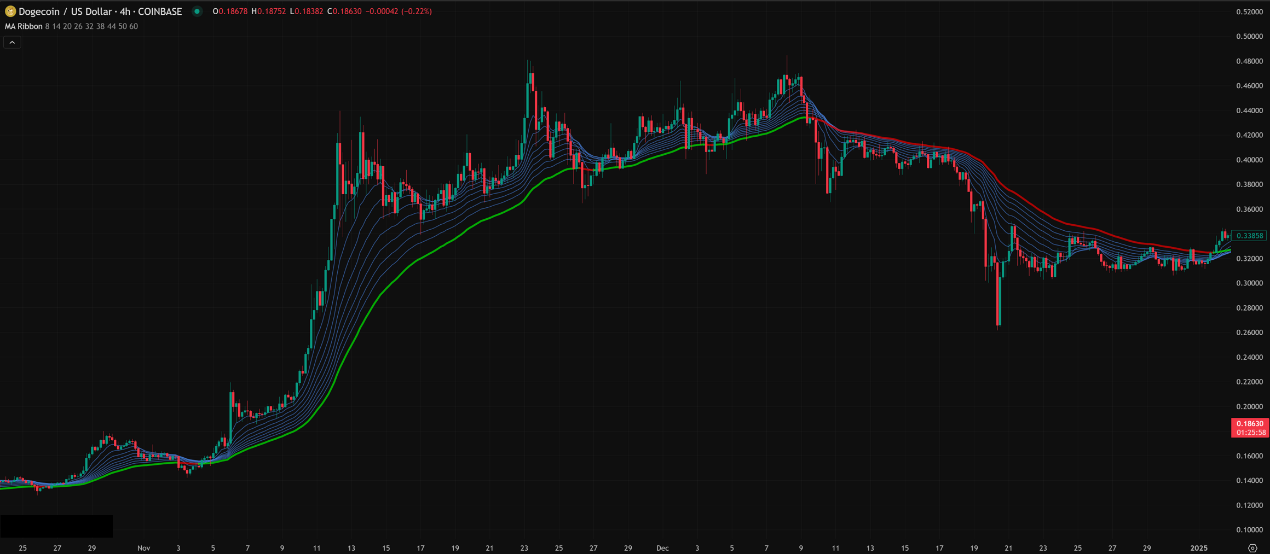
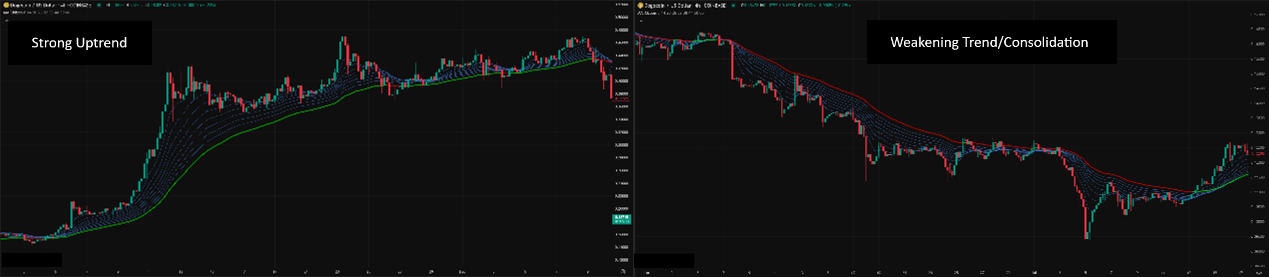
- When all EMA lines run parallel and spread apart (fanning out), forming a wide, smooth Ribbon, it signals a very strong trend with high market consensus.
- When the lines squeeze together (compression) or even twist/tangle, it means the trend is weakening, buyers and sellers are battling it out, the market is hesitant – possibly consolidating or preparing to reverse.
- Providing a Dynamic Support/Resistance Zone: The entire Ribbon acts as a wider S/R zone, not just a single line. Price entering the Ribbon becomes an area to watch closely.
「Reading the EMA Ribbon: Expansion vs. Compression」
EMA Ribbon Basics (Getting Started Guide):
- Spotting Direction & Strength:
- Ribbon angled upwards, lines parallel and expanding → Strong uptrend.
- Ribbon angled downwards, lines parallel and expanding → Strong downtrend.
- Ribbon flattening, lines compressing, tangling → Consolidation / Unclear trend / Potential reversal.
- Dynamic S/R Zone:
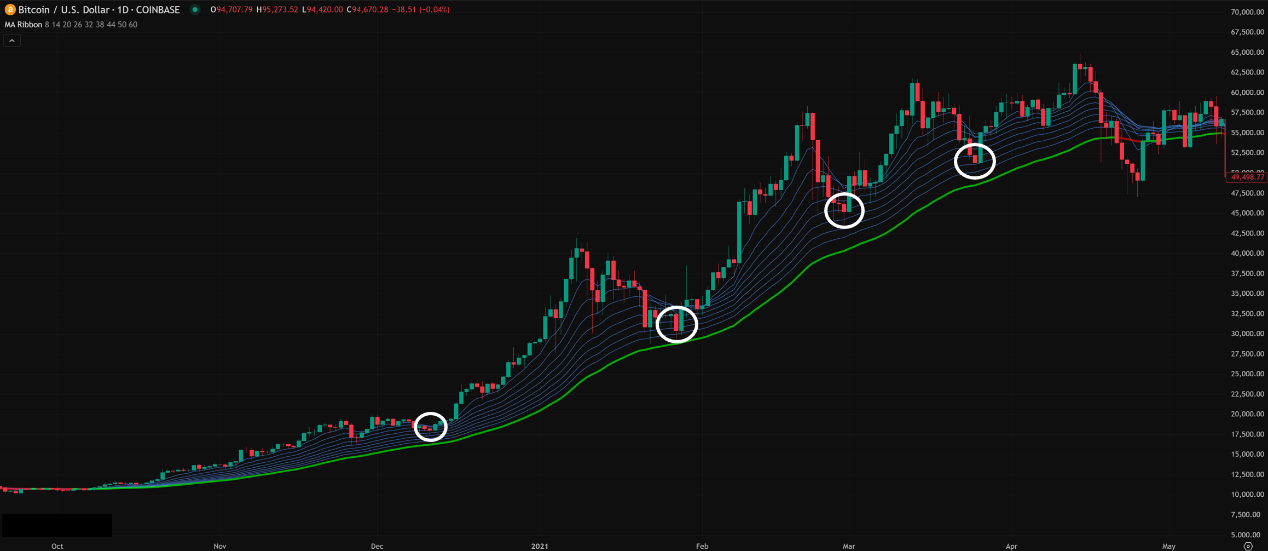
- Uptrend: Price pulls back to the upper edge or enters the Ribbon. If it finds support (e.g., bullish candlestick pattern appears) and breaks back above the Ribbon’s upper edge → Potential buy opportunity (trend continuation entry/add-on).
「EMA Ribbon’s Dynamic Support Role」
-
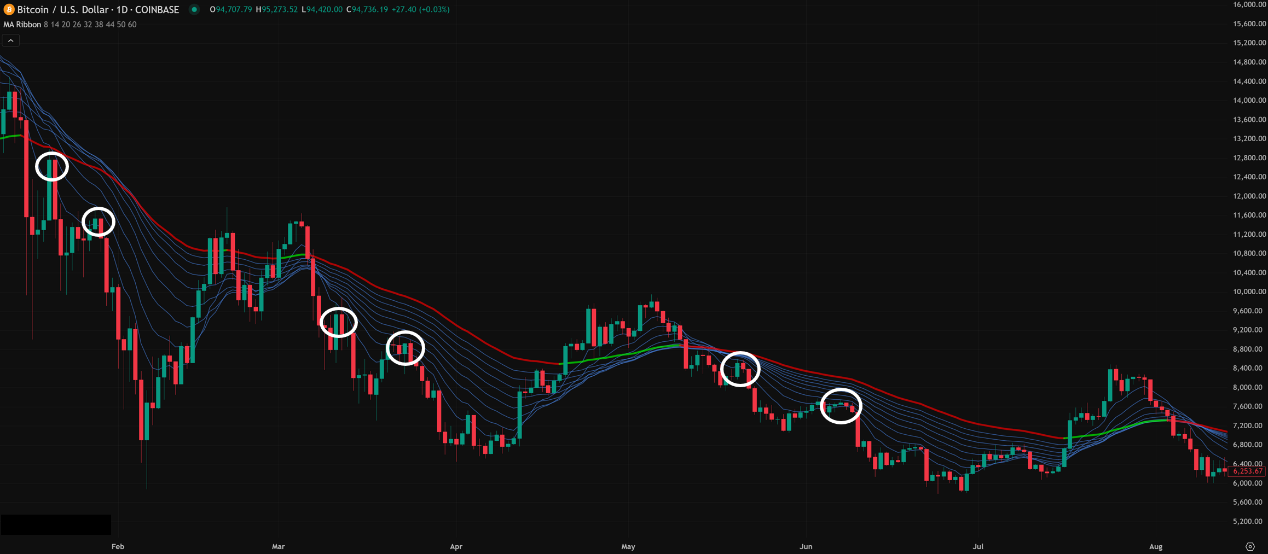
- Downtrend: Price rallies to the lower edge or enters the Ribbon. If it hits resistance (e.g., bearish candlestick pattern) and breaks back below the Ribbon’s lower edge → Potential sell/short opportunity.
「EMA Ribbon’s Dynamic Resistance Role」
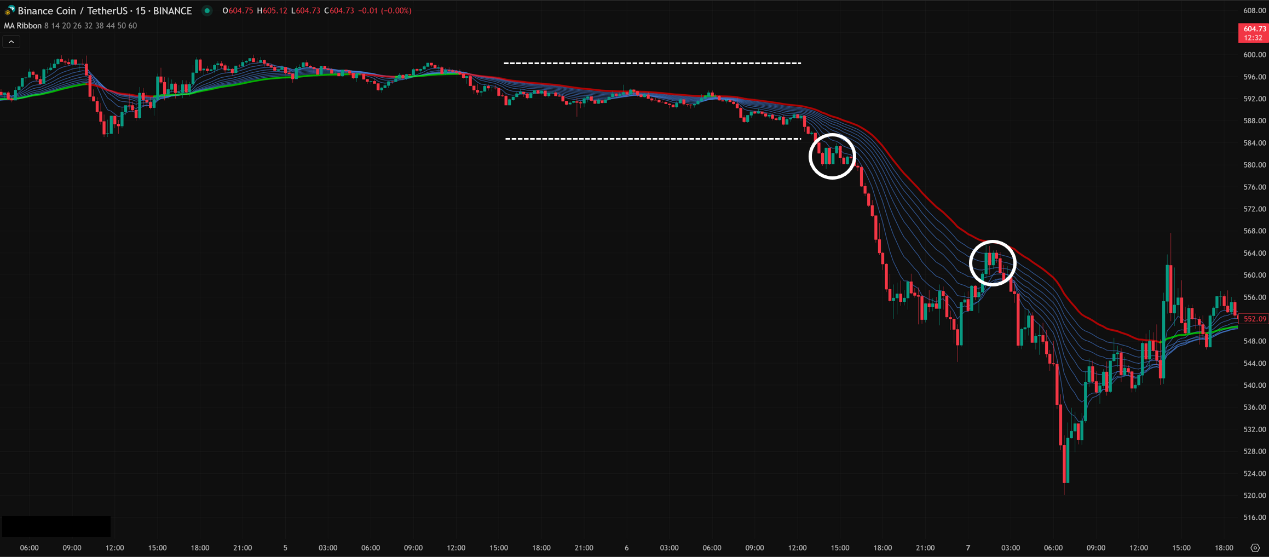
3. Potential Reversal Signals:
-
- A previously expanding Ribbon starts consistently compressing.
- Price crosses completely through the entire Ribbon (e.g., breaks down from above to below, or up from below to above).
- The Ribbon completely flips direction (e.g., transitions from sloping up to sloping down).
- Heads Up: Reversal signals often lag. It’s usually best to wait for the Ribbon to start expanding again in the new direction for confirmation.
Advanced Plays & Low Timeframe Breakdown (Pro Level Class):
Similar to GMMA, the EMA Ribbon’s power is typically more evident on higher timeframes (H1, H4, Daily) because it needs time to develop stable patterns. But can it be used on shorter charts at all? Let’s dive into the 1M / 5M / 15M chaos zone.
Deep Dive into Short Timeframes (1-min / 5-min / 15-min Charts):
- The Core Challenge: Just like with GMMA, low timeframes are packed with noise. The EMA Ribbon becomes hyperactive, lines frequently squeeze and fan out, and the whole Ribbon can twist and turn rapidly, making stable signals hard to find.
- 1-Minute Chart (1M):
- Analysis: Extremely unstable! The entire Ribbon will basically wiggle, compress, and expand with almost every price bar. Trying to use traditional pullback-to-Ribbon support/resistance strategies is nearly impossible because the Ribbon itself changes too fast. Price will frequently slice right through the whole thing.
- Potential Uses (Extremely High Risk!):
- Spotting Extreme Compression Breakouts: Similar to GMMA, maybe watch for moments the Ribbon gets squeezed super tight (almost like a single line), followed by a sudden, large, single-direction candle breaking out with volume. This might offer an ultra-short-term scalping chance, but it’s incredibly difficult, and the lag might mean you’ve already missed the best entry.
- Basically Useless for Trend: On the 1M, the Ribbon’s direction changes far too quickly to reliably gauge the short-term trend.
- Bottom Line: Strongly, strongly advise against using the EMA Ribbon for trading decisions on the 1M chart. It’ll just make your head spin.
「EMA Ribbon on 1-Minute Chart: Extreme Instability!」
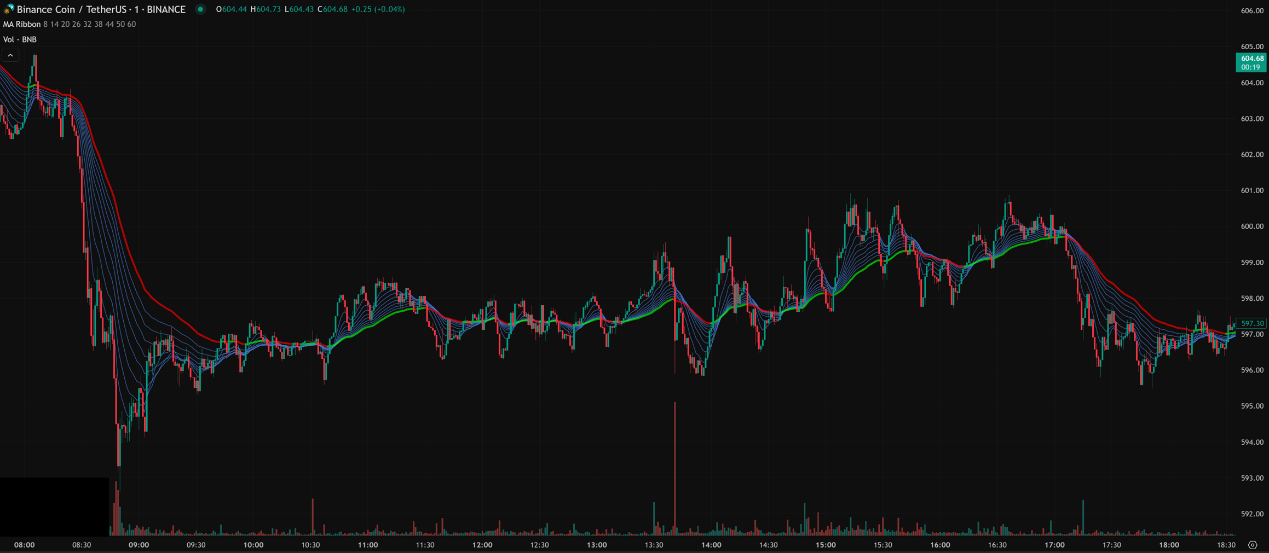
- 5-Minute Chart (5M):
- Analysis: A tiny bit better than 1M, but the Ribbon is still very choppy and prone to “fake expansions” and “fake compressions.” You might use it to get a feel for the ultra-short-term intraday momentum, but be extremely cautious.
- Potential Uses:
- Momentum Filter: When the Ribbon shows a relatively consistent direction (e.g., angled up/down for several candles with slight expansion), you could consider looking for trades in that direction, but use faster entry signals (like candlestick patterns) for timing.
- Short-Term Compression Breakouts: Look for periods where the Ribbon clearly narrows, then price breaks out of that tight range with volume, and the Ribbon starts to fan out in the breakout direction. This signal is slightly more reliable but still needs confirmation.
- Bottom Line: The 5M EMA Ribbon can serve as an auxiliary reference for intraday momentum, but shouldn’t be your primary decision tool. The lag is still significant, making it easy to chase highs and sell lows.
「EMA Ribbon on 5-Minute Chart: Still Volatile, Use as Secondary Tool」
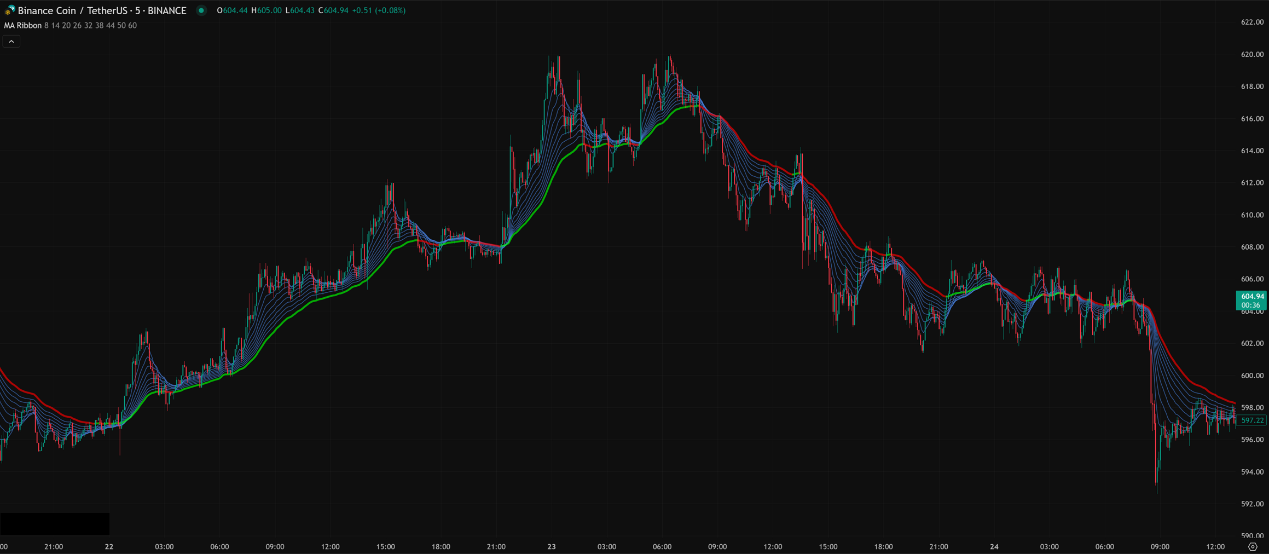
- 15-Minute Chart (15M):
- Analysis: Among these low timeframes, the 15M is where the EMA Ribbon starts to look interesting. The Ribbon’s shape is relatively more stable, and its expansion/compression better reflects market consensus changes over a decent period. It can be useful for gauging the trend during key intraday sessions.
- Potential Uses:
- Intraday Trend Confirmation & Pullback Entries: When the Ribbon is steadily expanding upwards/downwards, consider this the main intraday trend. Wait for price to pull back into the Ribbon (not necessarily just the edge). Look for support/resistance within the Ribbon (e.g., reversal candlestick signals), then enter with the trend.
- Trend Weakness / Consolidation ID: If the Ribbon consistently narrows or flattens out from a slope, it’s a clear warning sign that momentum is fading and consolidation might be starting.
- Breakout Strategy: After a period of Ribbon compression and flattening, if price breaks out decisively with volume, and the Ribbon begins to fan out again in the breakout direction, this is a more reliable breakout entry signal.
- Bottom Line: The 15M EMA Ribbon is a more practical visualization tool for short-term trading, especially good at showing trend intensity and providing dynamic pullback zones. Still, always recommended to use it conjunction with volume, price action, or other indicators.
「EMA Ribbon on 15-Minute Chart: More Practical Application」
Conclusion: Which Low Timeframe Combo is Hottest & Most Effective? How to Use It?
- Hottest & Most Effective? Like GMMA, the EMA Ribbon wasn’t primarily designed for hyper-short-term trading. On charts like 1M/5M/15M, there’s no single “hottest” combo.
- If You Really Want to Use It Short-Term, How Do You Make It Work?
- Timeframe Hierarchy: 15-Min >> 5-Min >> 1-Min. The longer the timeframe, the more stable the Ribbon’s shape and the more reliable the signals.
- Core Focus:
- Shape Over Specific Points: Pay attention to the Ribbon’s width (expansion/compression) and slope (direction). Expansion = strong trend; Compression = weak trend or range.
- Zone, Not a Line: Treat the entire Ribbon as a dynamic S/R zone. Price entering the Ribbon is a ‘watch zone,’ not an immediate entry/exit signal. Wait for confirmation within the Ribbon (like a reversal candle) or a breakout from the Ribbon’s edge before acting.
- Compression is Opportunity: Pay special attention to periods of extreme compression followed by expansion, as this often precedes a significant move.
- Golden Rule: Combine & Confirm!
- Volume: Volume changes are crucial during breakouts from the Ribbon or when price tests it as S/R.
- Price Action: Candlestick patterns like Pin Bars or Engulfing patterns appearing within the Ribbon zone dramatically increase signal probability.
- Key Levels: Combine with traditional S/R levels, daily Pivot Points, etc.
- Risk Awareness: Short-term volatility is high. The Ribbon’s lag can cause missed entries or getting chopped up in sideways markets. Strict stop-losses are non-negotiable!
EMA Ribbon Default Parameters & “Best” Parameters?
- Common Default Parameters:
- There’s no single universal standard, but common setups include:
- 8 EMAs (Popular): E.g., 5, 10, 15, 20, 25, 30, 35, 40 (arithmetic progression); OR 5, 8, 13, 21, 34, 55, 89, 144 (Fibonacci sequence, often default on platforms like TradingView).
- 6 EMAs: E.g., 10, 20, 30, 40, 50, 60.
- Which is the “Best” Parameter Combo?
- Say it with me: There’s NO magic bullet!
- For the EMA Ribbon, because its strength is visualization, many find the default parameter sets work quite well. The number of lines and their spacing are usually sufficient to show the expansion/compression effects clearly.
- Considerations for Tweaking:
- Number of Lines: Too few, you don’t get the Ribbon effect; too many might look cluttered. 6-8 lines is often a good balance.
- Period Settings:
- Shorter-Term Trading (e.g., 15M): Might use shorter starting periods and smaller gaps (e.g., 5 through 40).
- Longer-Term Trading (e.g., Daily): Might use longer starting periods and wider gaps (e.g., 20 through 100+).
- Conclusion: Start with the default parameters, like the common Fibonacci sequence combo on TradingView. Once you’re familiar with its visual language, you can then consider fine-tuning based on your trading style and timeframe, using backtesting. But often, the need to tweak isn’t as critical as with some other indicators.
「Parameter Tweaking? Backtest First!」

Bottom Line: EMA Ribbon is Your Trend “Heat Map,” Helping You Feel the Market Temperature!
The EMA Ribbon is a highly intuitive tool that helps you:
- Quickly see trend direction and strength.
- Judge market consensus (expansion) vs. indecision (compression).
- Identify dynamic support and resistance zones.
But remember its characteristics:
- It Lags: Won’t give you perfect top/bottom signals.
- Low TF Noise: Be very careful on 1M/5M; becomes more practical on 15M+.
- Requires Interpretation: Focus on the overall shape, not just single line crosses.
- Use with Confluence: Combining with Volume, Price Action, etc., is essential.
- Risk First: No indicator replaces solid risk management.
「EMA Ribbon = Trend Thermometer + Risk Shield」

Hope this deep dive into the EMA Ribbon, especially the low timeframe applications, helps you Smart Traders out there! Go load it onto your charts and start watching how that Ribbon flows!
Next Steps:
- Add an EMA Ribbon (using defaults) to your 15M, 1H, and 4H charts.
- Observe how the Ribbon’s width and shape differ in strong trends vs. consolidations.
- Watch how price interacts with the Ribbon, especially on pullbacks into it.
- Try to spot examples where the Ribbon goes from compressed to expanding, and see what happened next.
- Keep Experimenting, Keep Learning, Keep Earning! Good luck with your trades! 💹✨