Physical Address
304 North Cardinal St.
Dorchester Center, MA 02124
Physical Address
304 North Cardinal St.
Dorchester Center, MA 02124
Alright, all you Market Runners chasing ultimate momentum, Crypto accelerator pilots, and traders looking to instantly gauge price “explosiveness”! Today, we’re breaking down one of the most OG, purest momentum indicators out there – the ROC (Rate of Change)! It’s got no fancy frills, no complex calculations; it just tells you straight up: Yo, compared to N days ago, how much % has the price changed? Wanna know how to use this original “price accelerometer”? Let’s get it!
What the heck is ROC? How’s it related to the Momentum indicator?
The ROC indicator simply measures the percentage change in price over a specific time period. It’s the embodiment of the most basic momentum concept. It’s like a close sibling to the Momentum indicator we discussed earlier:
Momentum (Subtraction version): Current Close – Close N periods ago. Shows the absolute price difference, baseline is 0.
ROC (Division/Percentage version): [(Current Close – Close N periods ago) / Close N periods ago] * 100, OR more commonly calculated as (Current Close / Close N periods ago) * 100.
With the first formula, the baseline is 0. Positive means up, negative means down.
With the second (more common on platforms like TradingView), the baseline is 100. Above 100 means up, below 100 means down.
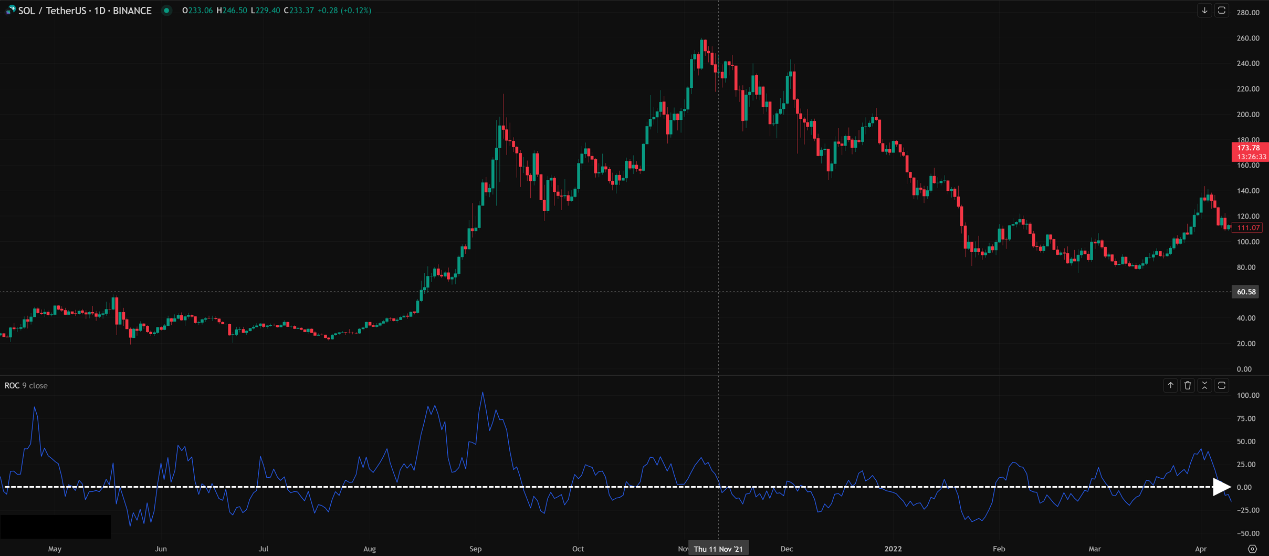
Core Interpretation (regardless of calculation):
Line above baseline (100 or 0) → Upward momentum.
Line below baseline → Downward momentum.
The further the line is from the baseline → The stronger the momentum (larger % price change / faster speed).
The closer the line is to the baseline → Momentum is weakening.
We’ll primarily use the version with the 100 baseline for explanation, as it’s more common on many platforms.
「ROC Indicator Structure: Measuring Price Change Percentage (%)」
Like the Momentum indicator, the ROC concept is so fundamental it doesn’t have a specific “inventor” associated with its popularization. It stems from the most basic question traders ask: “Compared to before, is the price up or down now? By what percentage?”
Design Philosophy:
Standardize Momentum: Using percentage change allows comparison across assets with different price levels (e.g., a 10% rise from $10 to $11 and from $100 to $110 would yield similar ROC readings). The subtraction-based Momentum indicator can’t do this.
Quantify Velocity: Directly shows the rate of price change.
Identify Momentum Shifts: Use the indicator line’s direction and position to gauge strengthening or weakening momentum.
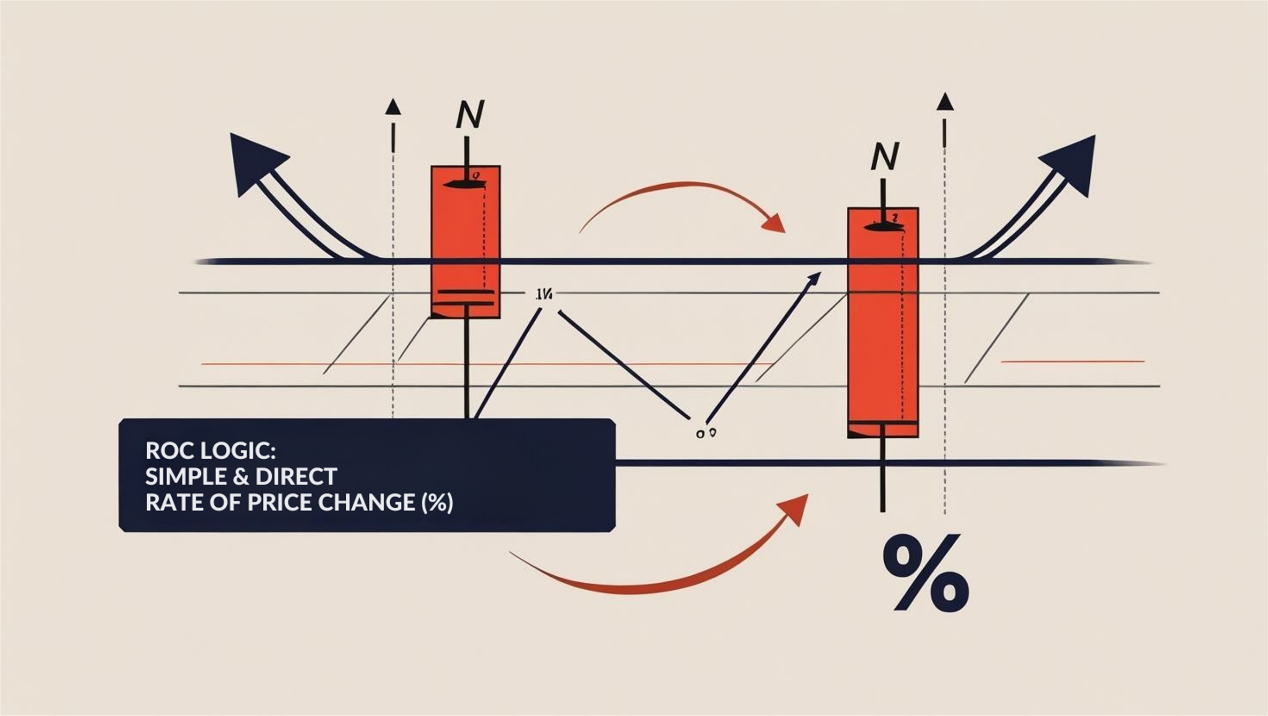
The Core: Just a simple percentage change calculation! Raw and Simple!
「ROC Logic: Simple & Direct Rate of Price Change (%)」
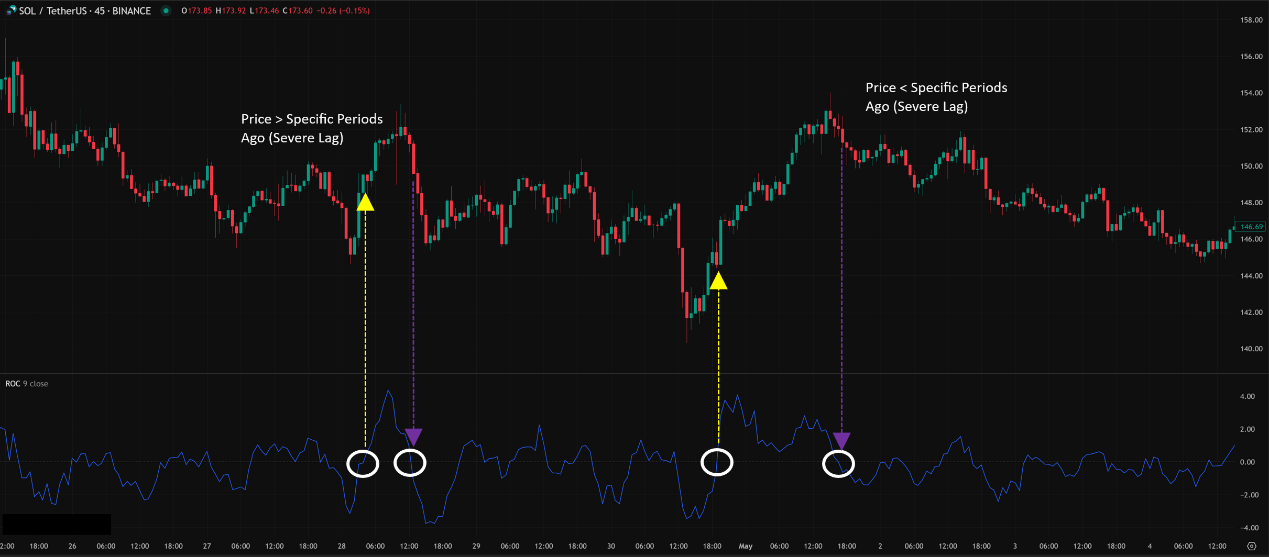
100 Baseline Cross (Super Lagging!):
ROC line crosses above 0 from below → Upward momentum confirmed? (Price is higher than N periods ago)
ROC line crosses below 0 from above → Downward momentum confirmed? (Price is lower than N periods ago)
MEGA WARNING! This signal lags severely! By the time ROC crosses 100, the price has often already made a significant move. This signal has very low trading value on its own. DO NOT use it for entries! At most, it just tells you “Okay, the price now is higher/lower than N periods ago.”
「ROC Baseline Cross: Historical Comparison Only, Not a Trade Signal」
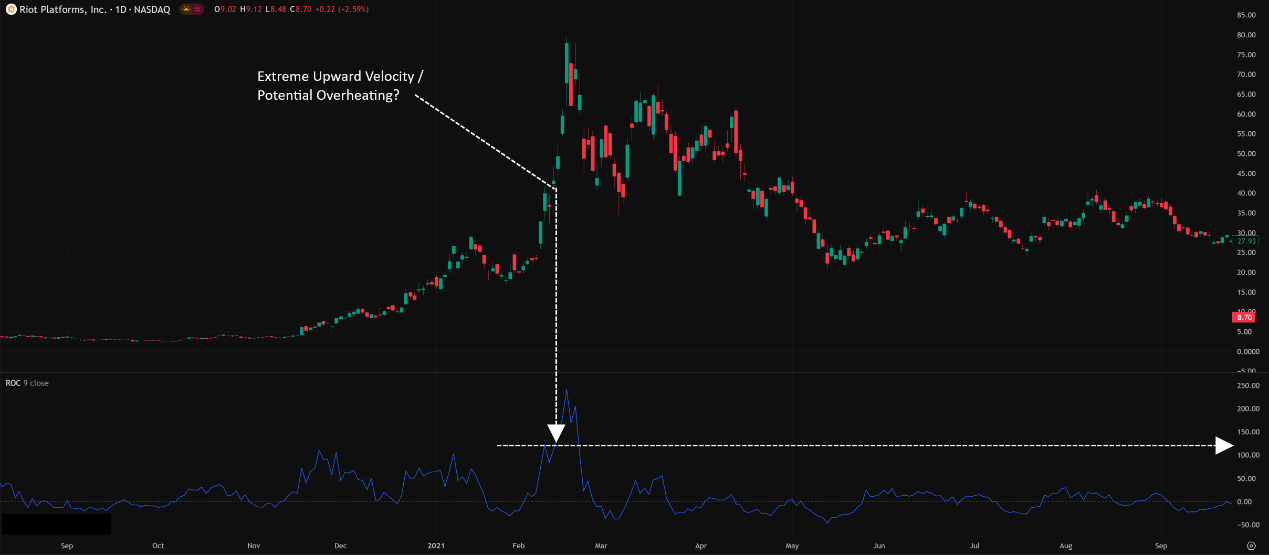
Extreme Readings (Still NOT OB/OS!):
ROC reaches historically high levels (e.g., 110, 120, or higher) → Recent price rise was extremely fast (% change was large). Could mean the trend is strong, but could also be a warning of short-term overheating/exhaustion (caution!).
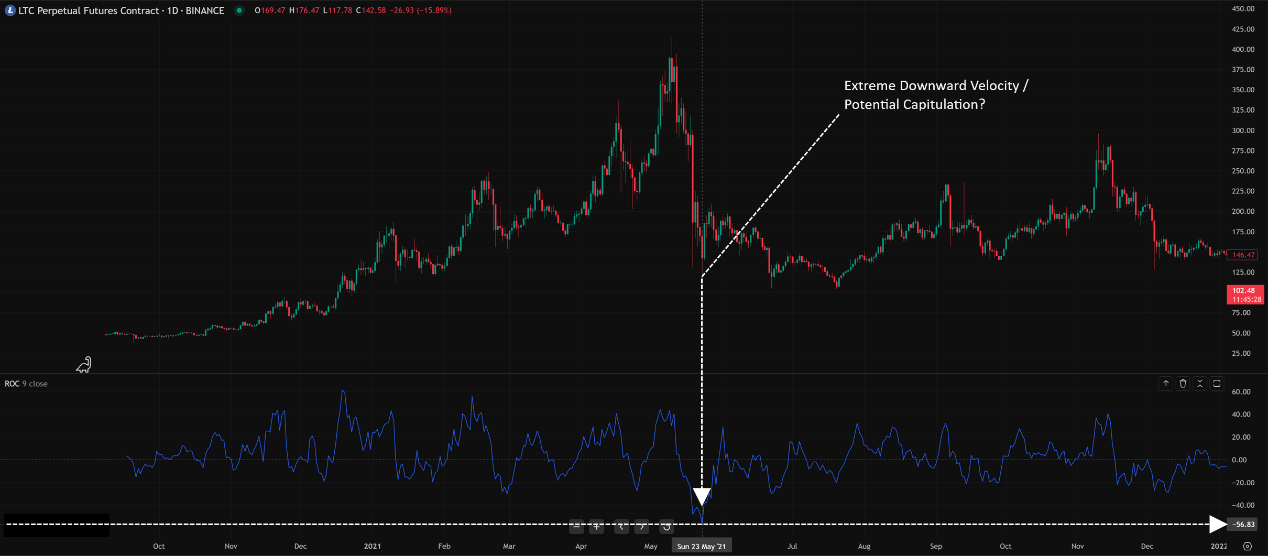
ROC reaches historically low levels (e.g., 90, 80, or lower) → Recent price drop was extremely fast (% change was large). Could mean the trend is strong, but could also signal short-term capitulation/panic selling bottom (caution!).
Key Reminder: ROC has no fixed overbought/oversold levels! “Extreme” is relative to the asset’s own history. And extreme speed doesn’t mean it has to stop!
「ROC Extreme Readings: Reflects Speed, Not Reversal Points」
ROC’s real value, like Momentum’s, lies in comparing changes in momentum, especially divergence!
Divergence (ROC’s Core Value!):
This is the essence of using ROC (or Momentum)! Look for situations where momentum disagrees with price action.
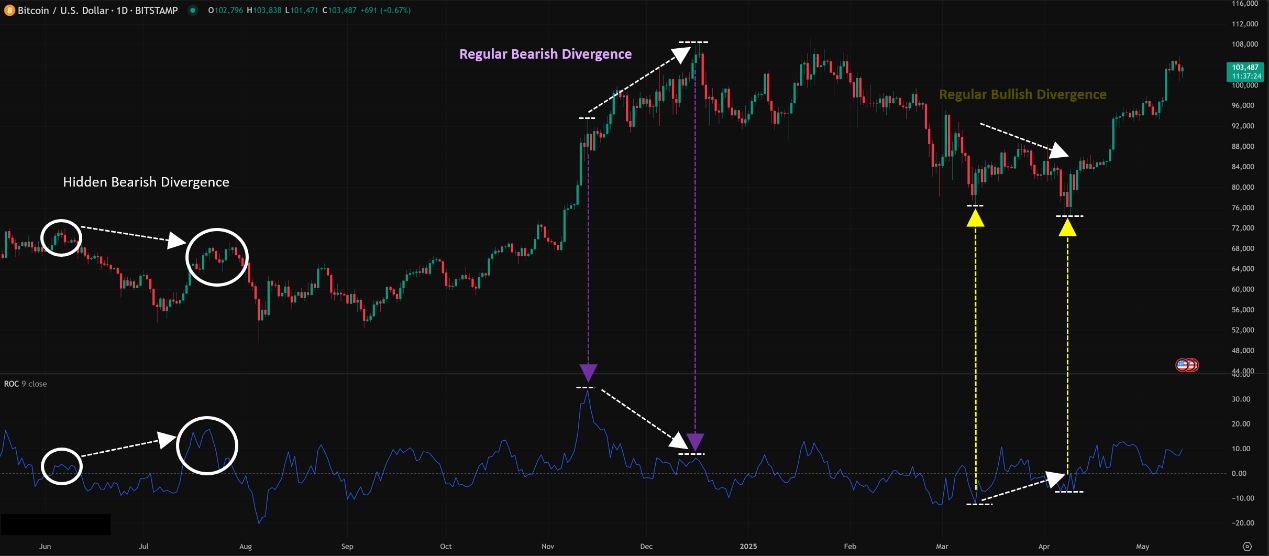
Regular Bullish Divergence:
Price LL, but ROC line HL (speed of decline is slowing) → Potential bottoming / bounce signal.
Regular Bearish Divergence:
Price HH, but ROC line LH (speed of ascent is slowing) → Potential topping / pullback signal.
Hidden divergence also applies for trend continuation signals.
Why it’s Important: Because momentum (speed) often turns before price itself does! When you spot divergence, the market’s telling you: “Even though I pushed price to a new high/low, the force behind that push is much weaker now!”
「ROC’s Ace: Regular Divergence (Momentum Leads Price)」
As a Confirmation Tool:
Use ROC’s direction/strength to confirm other trade signals.
Example: Price breaks resistance + ROC is also strongly above 100 and rising → Higher confirmation of breakout validity. Price forms a bullish candle pattern + ROC shows bullish divergence → Increased confidence in a potential bounce.
Identifying Momentum Strength:
Compare the peaks/troughs of ROC during consecutive up/down waves.
In an uptrend, if price makes new highs but ROC peaks get progressively lower → Clear bearish divergence, fading upside momentum.
In a downtrend, if price makes new lows but ROC troughs get progressively higher → Clear bullish divergence, fading downside momentum.
Core Parameter: Period (N)
ROC’s soul is this N! It determines how far back you’re comparing the price.
Default Parameters: Highly variable! 9, 10, 12, 14, 20, 21, 25 are all common defaults. TradingView might default to 9.
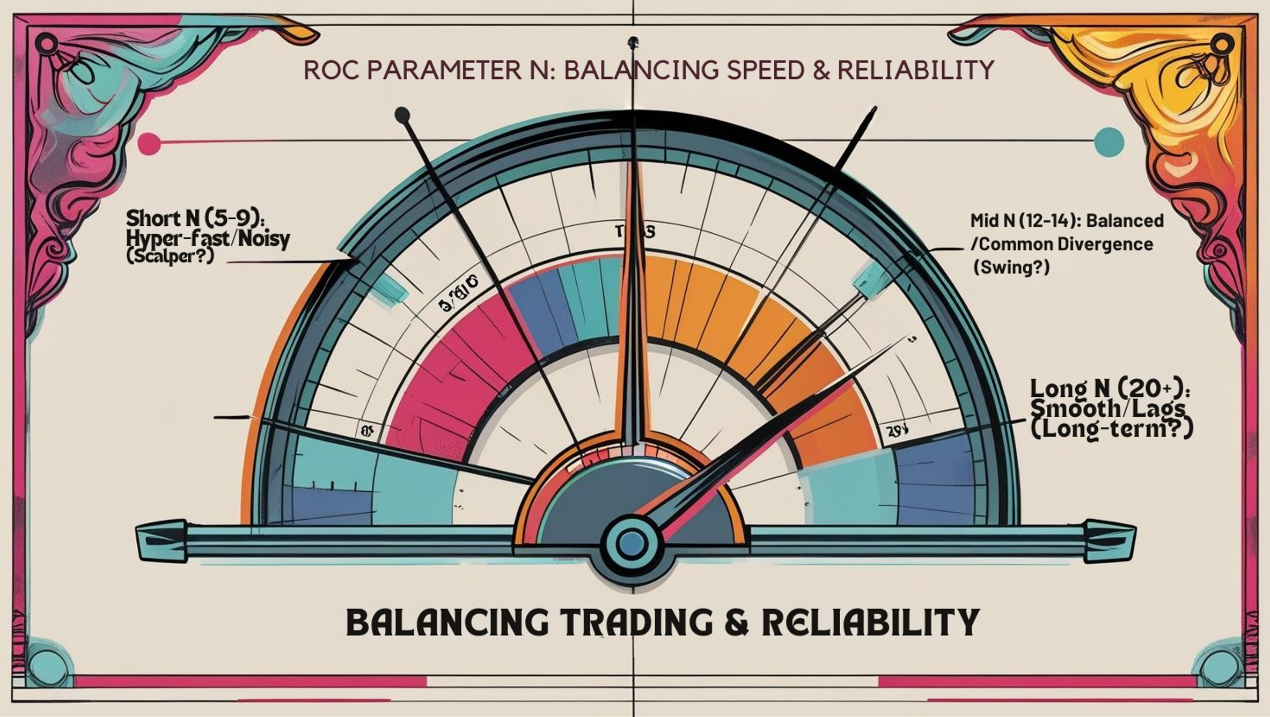
Impact of Changing N:
Shorter N (e.g., 5, 9): ROC is extremely sensitive, reacts super fast, very volatile line. Catches the shortest-term velocity changes, but extremely noisy.
Longer N (e.g., 20, 25, 50): ROC is smoother, reacts slower. Better reflects the dominant momentum trend over a period. Divergence signals might be more reliable but more lagging.
Parameter Settings Analysis & “Hottest” Combo Discussion:
Which N Works Best? No single answer! Depends on your objective and trading style.
Catching ultra short-term swings/Scalping? Might use 5-9, but accept massive noise.
Looking for Swing Divergences? 12 or 14 periods are commonly used and offer a reasonable balance. Much classic technical analysis literature uses 12.
Analyzing mid-to-long-term momentum trends/divergences on Daily/Weekly? 20, 21, or 25, or even longer (e.g., 50) might be more suitable.
The “Hottest” Combo?
No single combo is universally “hot.” However, the 12 or 14 period region is arguably the most common “sweet spot” for catching swing trade divergences due to its relative balance.
What about Crypto? Crypto’s high volatility might make very short N (like 9) too noisy. Using 14 or 20 might make divergences easier to read.
Conclusion:
2. If focusing on swing divergences, strongly consider testing 12 or 14.
3. For longer-term analysis, try 20/21/25.
4. Backtesting is MANDATORY! Especially compare the reliability of divergence signals generated by different N periods.
「ROC Parameter N: Balancing Speed & Reliability」
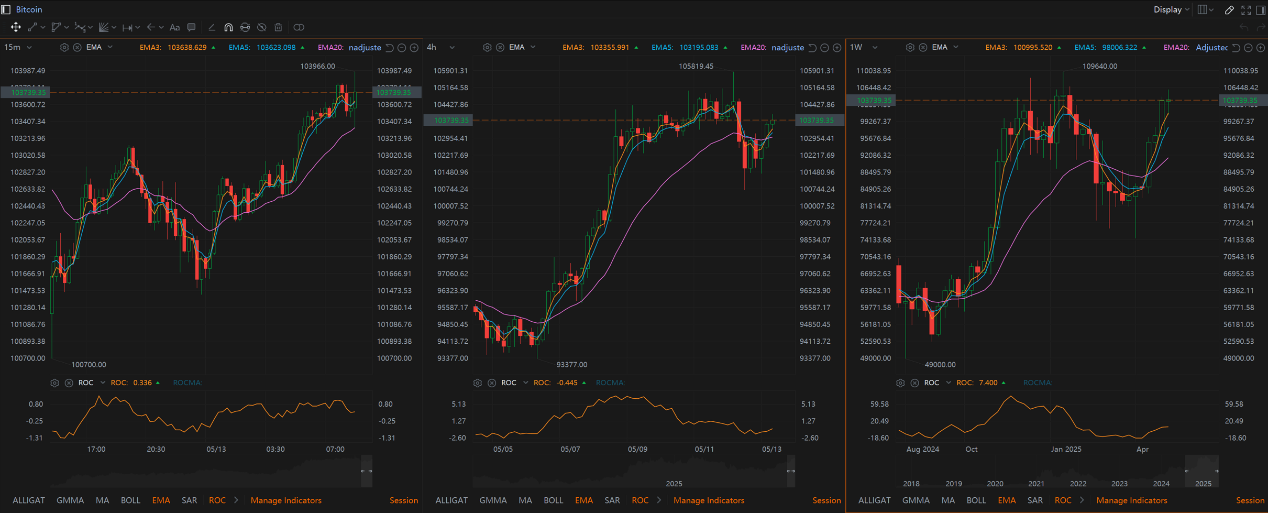
Timeframe Analysis:
All Timeframes Applicable! But usage and reliability differ.
Ultra Short-Term (M1, M5, M15):
Using short N will be extremely volatile. Divergences might appear but be fleeting and unreliable. Might mainly watch for momentary speed bursts? High risk!
Intraday / Short Swing (H1, H4):
Common usage zone. Use N=12 or 14. Divergence is the primary focus. Can use ROC to confirm momentum behind intraday breakouts.
Swing / Long-Term (Daily, Weekly):
Where ROC divergence has the most value! Use N=14, 20, or 25. Longer-term divergences often precede significant trend changes. Can observe long-term momentum trends (line staying above/below 100).
「ROC Timeframes: Longer = More Meaningful Divergence」
Parameters: No single “hottest,” but 12 or 14 period is a common sweet spot for swing divergences. Adjust N based on need and testing.
Timeframe: Daily/Weekly/H4 are the golden zones for divergence analysis.
Hottest / Most Effective Usage = Become a “Divergence Hunter” + Combine with Confirmation:
Core Value is Divergence! Treat ROC primarily as a leading indicator of momentum exhaustion.
Baseline Crosses have minimal value.
Extreme Readings are speed references, NOT reversal points.
ALWAYS Combine with Price Action, S/R, Trendlines, Patterns! ROC divergence needs price confirmation.
Use ROC to Confirm Momentum for Other Signals.
ROC: The Purest Engine Tachometer
ROC is a fundamental, direct momentum indicator. It doesn’t give you overly processed info; it’s like looking straight at the engine’s tachometer. Pros:
Simple calculation, direct concept.
Fast reacting (relative to lagging indicators).
Divergence signals are powerful leading indicators.
Standardized (%), useful for comparing across assets.
Cons:
Baseline crosses lag severely.
No OB/OS levels.
Line can be very volatile/noisy (especially short N).
Fewer built-in signals, relies heavily on divergence interpretation.
「ROC: The Market Engine’s Tachometer」
While simple, mastering ROC’s divergence signals can make you highly sensitive to shifts in market momentum. Incorporating it into your system as a momentum confirmation layer can effectively improve trade conviction.
Next Steps:
Add the ROC indicator (try period 12 or 14) to your charts. Note if the baseline is 100 or 0.
Practice obsessively identifying bullish and bearish divergences! This is key!
Observe how price typically behaves after ROC hits historical highs/lows.
Note how far price usually moves by the time ROC crosses its baseline.
Try using ROC to confirm signals from your other favorite strategies.
Backtest! Test if different N periods yield better divergence results in your market.
Hope you master the market’s speed and acceleration, catching every momentum burst! ⚡️