Okay, all you Market Slayers, Crypto Power Players, and Game Changers looking to master the market’s rhythm! Today, we’re dissecting an indicator you’ll find on virtually every charting platform – a true OG that’s like the “Hello World” of technical analysis but holds infinite depth: the RSI (Relative Strength Index)! Don’t think just because everyone knows it, it’s simple. Mastering RSI can seriously level up your game in spotting reversals and confirming momentum!
What the heck is RSI? Why is it a Must-Know?
RSI was invented in 1978 by the GOAT of technical analysis we’ve mentioned multiple times, J. Welles Wilder Jr. It’s a Momentum Oscillator designed primarily to measure the speed (velocity) and magnitude (change) of recent price movements, thereby assessing whether the market is Overbought or Oversold.
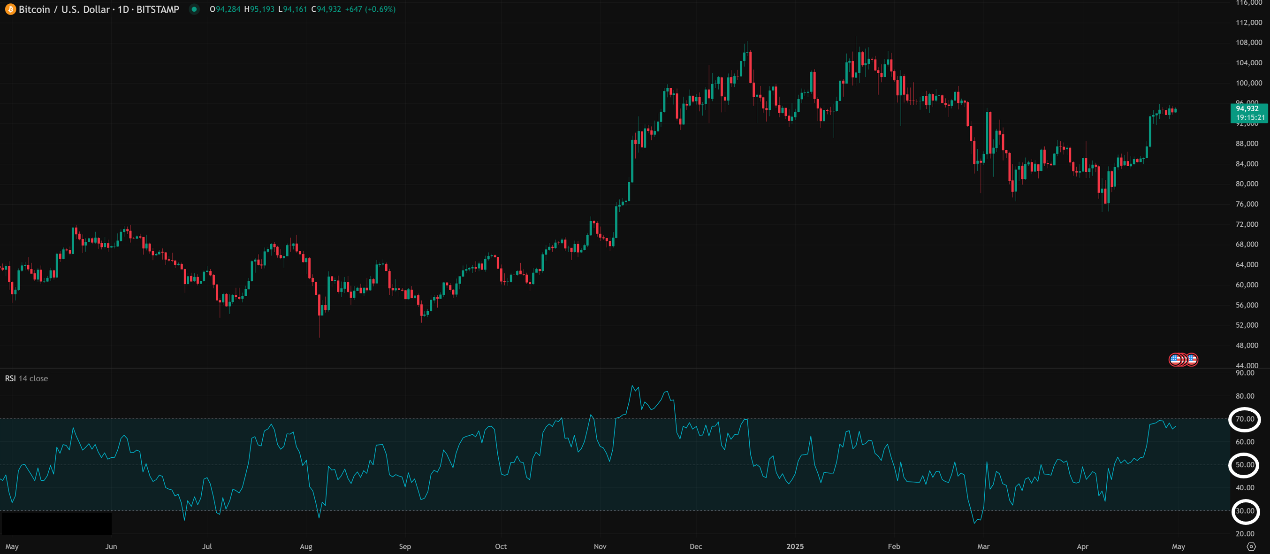
Its value oscillates between 0 and 100, and you’ll usually see two key levels marked:
- 70 Level: RSI above 70 is typically considered potentially Overbought (buying frenzy, price might have risen too far, too fast, risk of pullback).
- 30 Level: RSI below 30 is typically considered potentially Oversold (selling panic, price might have fallen too far, too fast, chance of a bounce).
- 50 Level: The centerline, often seen as the watershed between bullish and bearish momentum.
「RSI Structure: 0-100 Oscillation + 70/30 OB/OS Zones」
Why is it a Must-Know? Because RSI:
- Is Ubiquitous: Almost every trader knows it, giving its signals a degree of “consensus” power.
- Measures Momentum: Helps you gauge if a rally/decline still has juice.
- Provides OB/OS Warnings: Offers early clues about potential reversals (though not guarantees).
- Generates Divergence Signals: This is one of RSI’s most powerful features, capable of predicting trend weakness!
RSI’s Origin Story & Design: How Do You Measure “Relative Strength”?
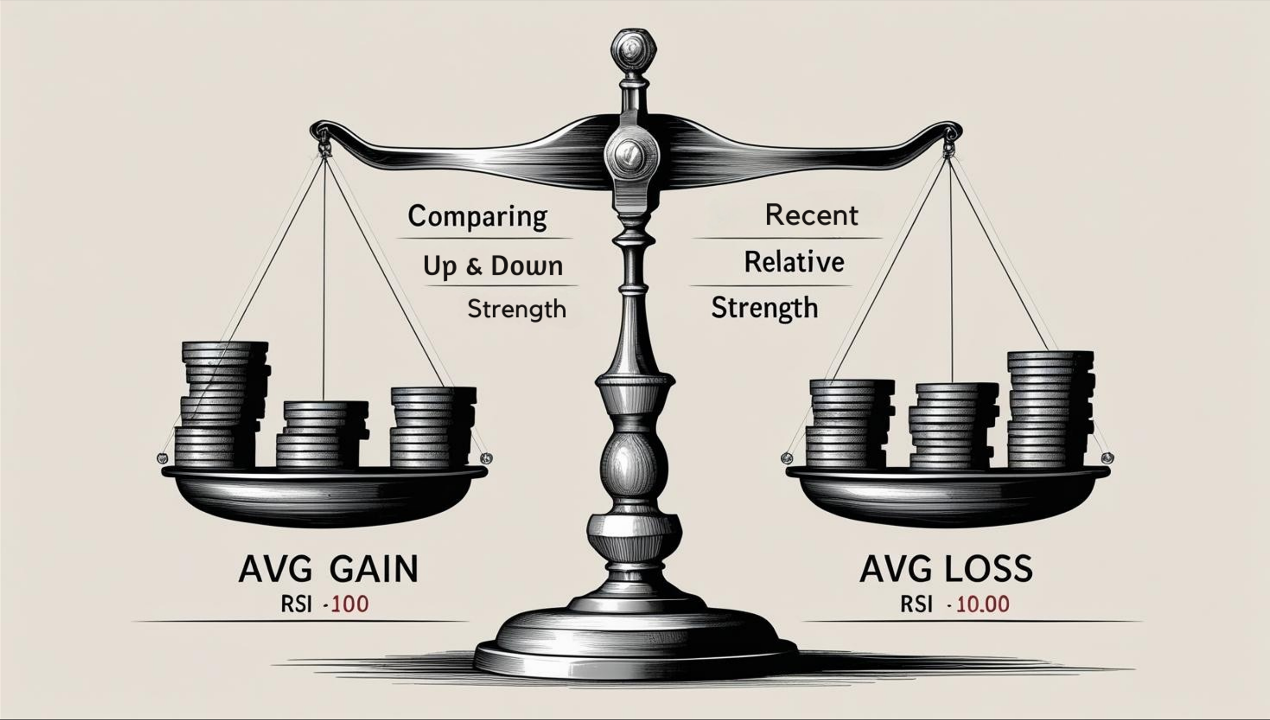
Wilder wanted an indicator to quantify the relative strength between the average closing gains on up days and the average closing losses on down days over a specific period.
Core Calculation Concept (Feel the logic):
- Calculate Average Gain & Average Loss:
- Look back over N periods (e.g., 14 days).
- Sum up all the gains on up days, divide by N for Average Gain.
- Sum up all the losses (absolute value) on down days, divide by N for Average Loss.
- (Wilder used a specific smoothing method similar to EMA, giving more weight to recent data).
- Calculate Relative Strength (RS):
- RS = Average Gain / Average Loss
- A higher RS value means recent buying pressure has been stronger.
- Normalize RS to Oscillate Between 0 and 100:
-
- RSI = 100 – [ 100 / (1 + RS) ]
- This step simply converts the RS value into an easier-to-interpret 0-100 oscillator.
Simply Put: RSI compares the ratio of “buyer strength” vs. “seller strength” over a recent period. High RSI means buyers have been winning lately; low RSI means sellers have had the upper hand.
「RSI Logic: Measuring Relative Strength」
RSI Basic Plays (Newbie Essentials):
- Overbought/Oversold Zones (Basic but Be Careful!):
- RSI > 70 → Overbought Warning → Potential pullback? Consider tightening stops or taking partial profits. NOT an immediate short signal!
- RSI < 30 → Oversold Warning → Potential bounce? Consider looking for buy setups. NOT an immediate bottom-picking signal!
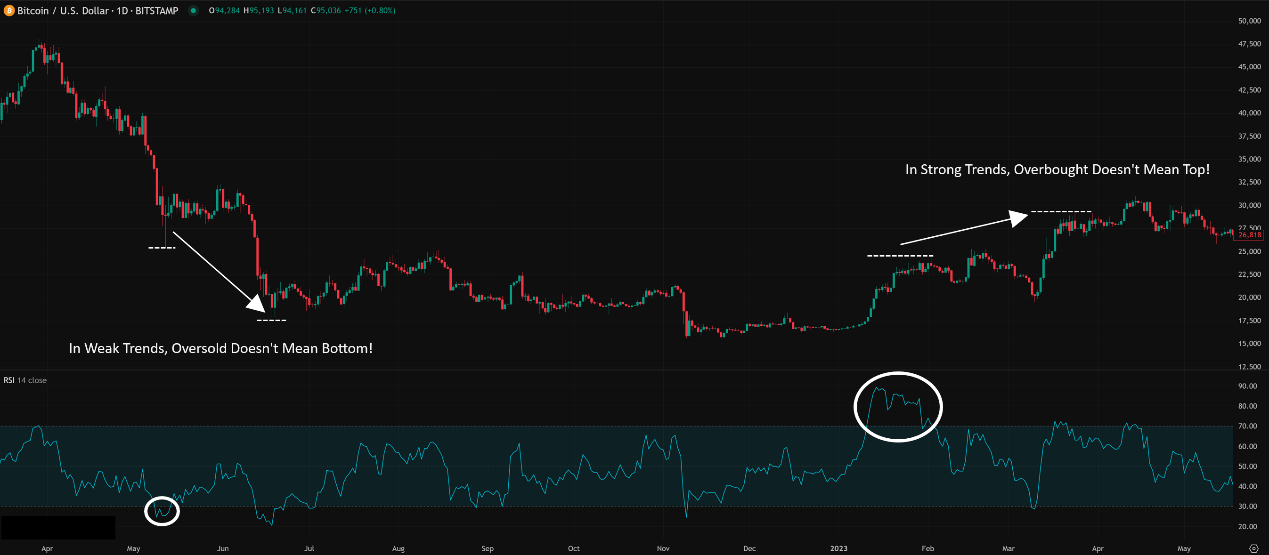
- CRUCIAL WARNING (Beginner Trap!): In strong trending markets (bull or bear), RSI can stay in the overbought (>70) or oversold (<30) zone for extended periods while price continues to move in the trend direction! If you short every time RSI hits 70 or buy every time it hits 30 in a strong trend, you’ll get crushed! Overbought can get more overbought, oversold can get more oversold!
「RSI OB/OS Trap: Trend is Key! 」
2. 50 Centerline Crossover:
-
- RSI crossing above 50 from below → Momentum strengthening, favors bulls.
- RSI crossing below 50 from above → Momentum weakening, favors bears.
- This can act as an auxiliary trend confirmation or an early sign of momentum shift.
RSI Advanced Plays (Pro-Level Techniques):
The real magic of RSI lies beyond just the 70/30 levels!
- Divergence (RSI’s Superpower!):
- This is often a leading signal that predicts a potential trend reversal!
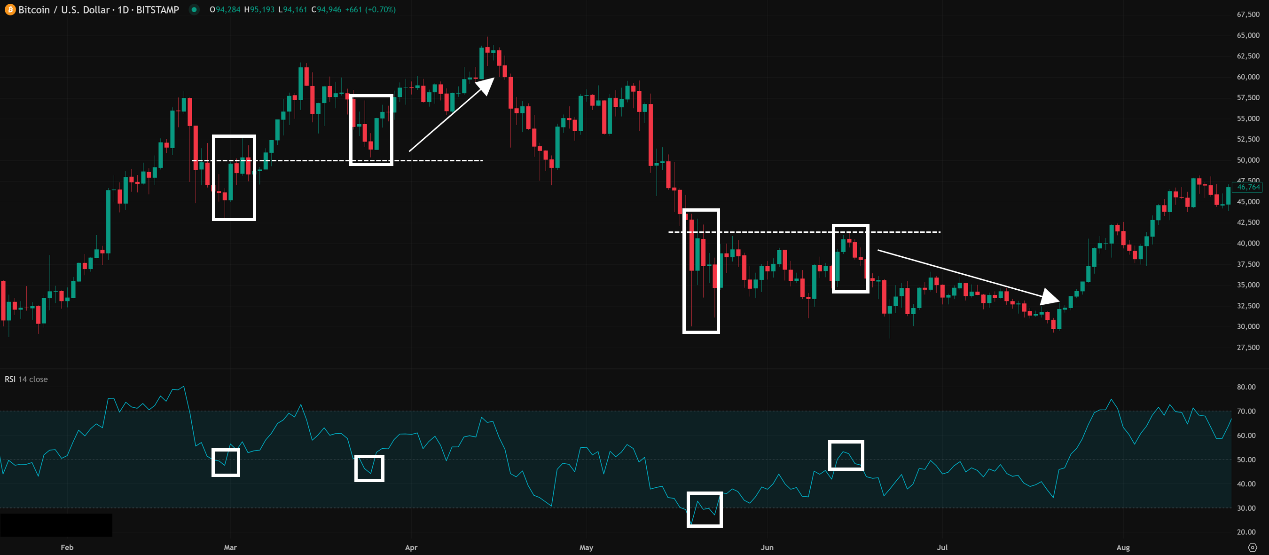
- Regular Bullish Divergence:
- Price makes a New Low (Lower Low, LL).
- But RSI fails to make a new low, forming a Higher Low (HL) instead.
- Interpretation: Even though price is falling, the momentum (speed/force) of the decline is weakening! Like a car rolling downhill but running out of gas – it might stop or turn around soon. It’s a potential bottoming signal.
-
- Regular Bearish Divergence:
- Price makes a New High (Higher High, HH).
- But RSI fails to make a new high, forming a Lower High (LH) instead.
- Interpretation: Even though price is rising, the momentum of the ascent is fading! Like a rocket running low on fuel. It’s a potential topping signal.
「RSI’s Ace: Regular Divergence (Predicts Reversals)」
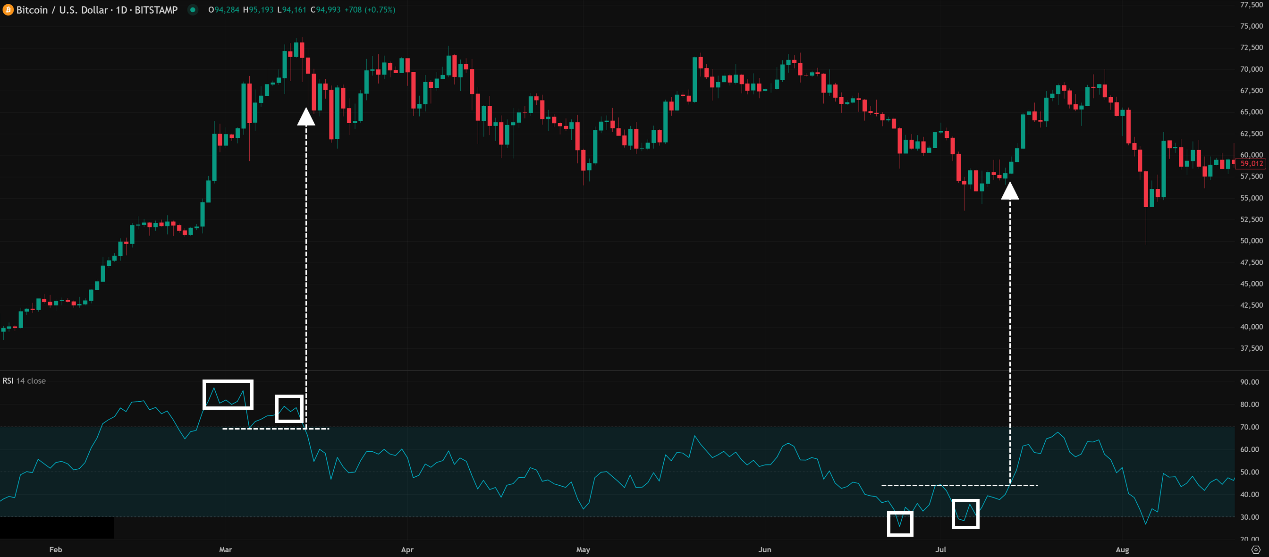
2. Hidden Divergence (Trend Continuation Signal!):
-
- Less famous than regular divergence, but very useful for confirming trend continuation!
- Hidden Bullish Divergence:
- Price makes a Higher Low (HL) (a pullback in an uptrend).
- But RSI makes a Lower Low (LL).
- Interpretation: Price pulled back shallowly, but RSI dipped deeper, suggesting the pullback might just be a healthy correction where downside momentum got exhausted quickly. The original uptrend is likely to continue. It’s a potential buy/add-on signal during pullbacks.
- Hidden Bearish Divergence:
- Price makes a Lower High (LH) (a rally in a downtrend).
- But RSI makes a Higher High (HH).
- Interpretation: Price bounced weakly, but RSI spiked higher, suggesting the rally is likely just a weak counter-trend bounce fueled by temporary excitement. The original downtrend is likely to continue. It’s a potential sell/add-to-short signal during rallies.
「RSI Advanced: Hidden Divergence (Predicts Trend Continuation)」
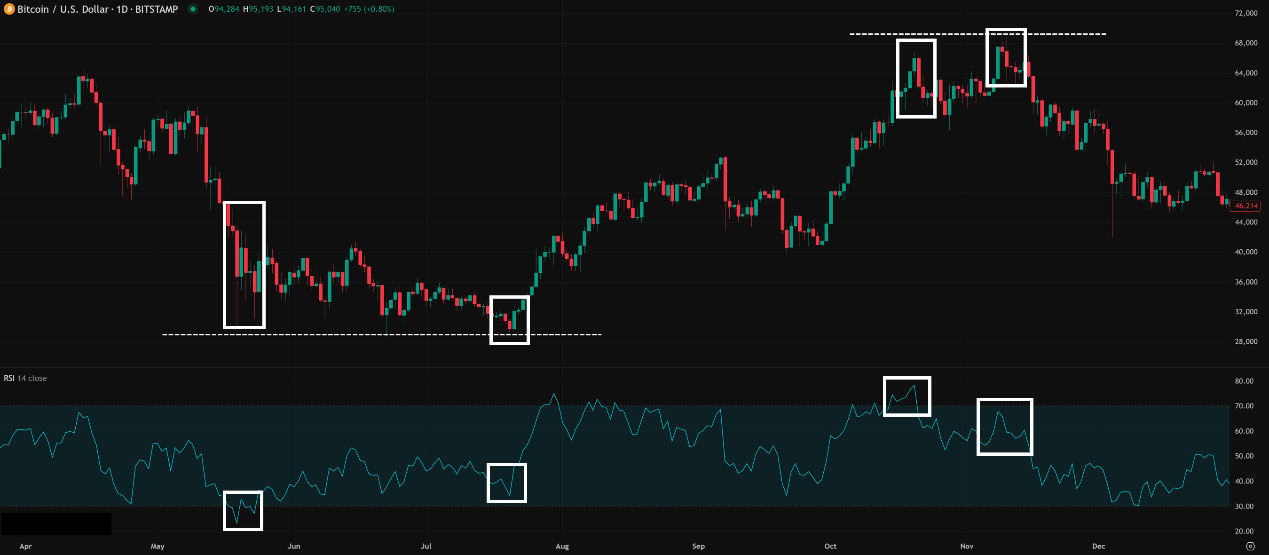
3. Failure Swings (A Signal Wilder Himself Emphasized):
-
- Similar to divergence but doesn’t require looking at price, only the RSI itself.
- Top Failure Swing (Bearish):
- RSI goes above 70 (overbought).
- Pulls back below 70.
- Rallies again but fails to exceed its previous peak.
- Subsequently breaks below the previous pullback low. This confirmation break is a stronger sell signal.
- Bottom Failure Swing (Bullish):
- RSI goes below 30 (oversold).
- Bounces back above 30.
- Dips again but fails to break below its previous low.
- Subsequently breaks above the previous bounce high. This confirmation break is a stronger buy signal.
「RSI Failure Swings: Top (Left) & Bottom (Right)」
4. RSI Trendline Breaks:
-
- Just like on price charts, you can draw trendlines on the RSI indicator itself.
- Sometimes, RSI will break its own trendline before the price breaks its trendline. This can act as a leading warning that a price trendline break might follow soon.
RSI Parameter/Timeframe Breakdown (How to Tweak?):
Core Parameter: Period (N)
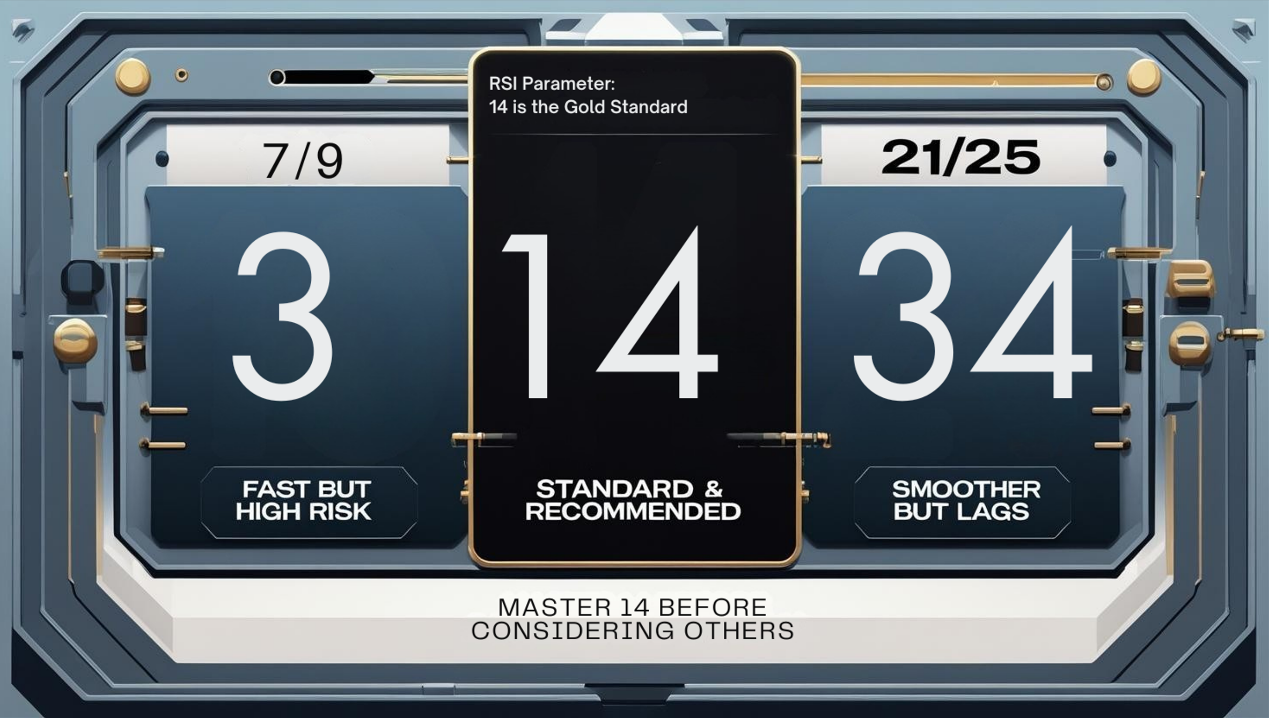
- Default Parameter: 14! This was Wilder’s original setting and remains the standard used by the vast majority of traders and platforms worldwide. It works well across various timeframes.
- Impact of Changing N:
- Shorter N (e.g., 7, 9):
- RSI is faster, more sensitive, line is choppier.
- Pros: Enters OB/OS zones faster, reacts quickly to short-term moves.
- Cons: Lots of false signals! Reliability of OB/OS zones decreases significantly. More prone to whipsaws in choppy markets.
- Longer N (e.g., 21, 25):
- RSI is slower, smoother, line oscillates less wildly.
- Pros: Filters more noise, fewer false signals, OB/OS signals are slightly more reliable.
- Cons: Lagging reaction, might miss short-term opportunities, divergence signals might be less pronounced.
Parameter Settings Analysis & “Hottest” Combo Discussion:
- Is Period 14 Sacred? Not strictly, but it’s the best starting point and the most widely accepted standard.
- Why Use Shorter Periods (e.g., 7, 9)?
- Typically used by ultra short-term traders (Scalpers) or those trying to catch very quick momentum bursts. They sacrifice reliability for speed.
- Usage: Might only look for extreme OB/OS readings (e.g., 90/10) for reversal scalps, or use 50-line crosses for very fast momentum bias. Extremely high risk!
- Why Use Longer Periods (e.g., 21, 25)?
- Longer-term trend traders might use these for smoother, more reliable long-term momentum readings.
- Usage: Might focus more on the 50 line as a long-term bull/bear divider, or use wider OB/OS zones (e.g., 80/20).
- The “Hottest” Combo?
- For the vast majority, sticking with the default 14 period is the most robust approach with the most available resources and community understanding.
- There’s no “unique” parameter combo guaranteed to be better. Before changing, ask yourself: WHY change? Have I truly mastered all the uses of the 14-period RSI (especially divergence)?
- Adjusting usage > Adjusting parameters! For example, in strong trends, adjusting your OB/OS levels to 80/20 might be more effective than changing N to 7.
「RSI Parameters: 14 is the Gold Standard」
Timeframe Analysis:
- All Timeframes Applicable! The beauty of RSI is its concept applies from M1 to Monthly charts.
- But Signal Significance Varies:
- Ultra Short-Term (M1, M5, M15): RSI will be very volatile, hitting OB/OS frequently with low reliability. Divergences might be brief. Mainly used for extreme readings or quick momentum checks.
- Intraday / Short Swing (H1, H4): RSI becomes more useful. Divergences are more reliable. Failure swings and trendline breaks can be observed. OB/OS zones require trend context.
- Swing / Long-Term (Daily, Weekly, Monthly): RSI divergence signals carry the most weight on these longer timeframes! Weekly/Monthly divergences often precede major market turning points. OB/OS zones also become more meaningful (but still beware strong trends). The 50 line gains significance as a long-term bull/bear divider.
Summary: Which Unique Parameter Combo + Timeframe is Hottest & Most Effective? How to Use It?
- Parameters: Stick with 14! If you must change, understand why and test thoroughly. Consider adjusting OB/OS levels (e.g., 80/20 in trends) instead of N.
- Timeframe: All work, but Daily/Weekly signals (especially divergence) are most significant.
- Hottest / Most Effective Usage = Master “Divergence” + Combine with “Market Structure“:
- Divergence is Core! Both regular and hidden – spend time identifying and understanding them.
- Don’t Trade OB/OS Blindly! Always consider if the market is trending or ranging.
- The 50 Line is the Momentum Divider.
- Failure Swings & RSI Trendline Breaks are Bonus Confirmations.
- ALWAYS Confirm with Price Action, Support/Resistance (S/R), Patterns, etc.! RSI only provides momentum clues.
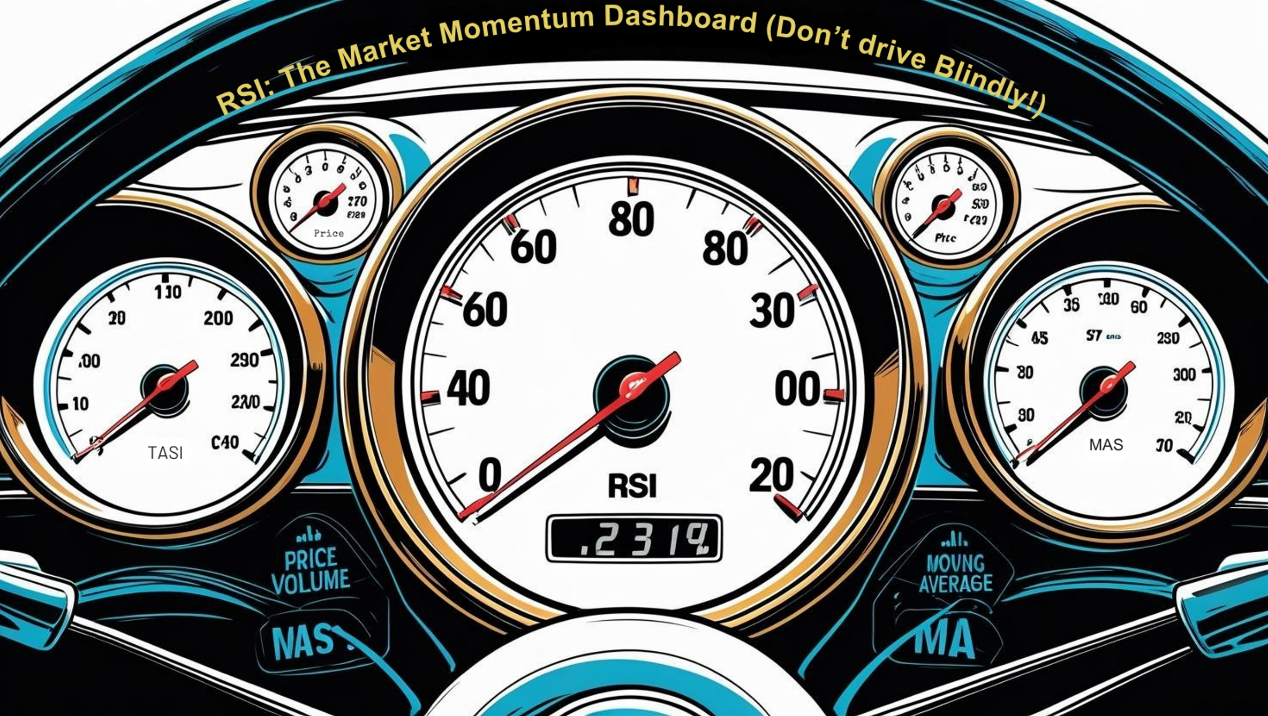
RSI: Your Market “Momentum Detector,” Not a Buy/Sell Button!
RSI is an indispensable part of the technical analysis toolbox. Its strengths:
- Versatility: Offers OB/OS, momentum, and divergence signals.
- Ubiquity: Widely used, provides a consensus baseline.
- Divergence Power: Can provide leading clues about reversals.
But remember its limitations:
- OB/OS Fails in Strong Trends.
- Crossovers Can Lag.
- Can Generate False Signals, Needs Confirmation.
「RSI: The Market Momentum Dashboard」
Mastering the nuances of RSI, especially divergence, can significantly enhance your trading insights. Integrate it into your system, don’t rely on it in isolation!
Next Steps:
- Add RSI (using default 14) to all your commonly used timeframe charts.
- Start practicing identifying regular and hidden divergences.
- Observe how RSI behaves in the OB/OS zones during strong trends.
- Note price reactions when RSI crosses the 50 line.
- Try drawing trendlines on the RSI indicator itself.
- Backtest! Validate different RSI uses in your market.
Hope you all become RSI masters and accurately capture market momentum! 🔥📈📉