Physical Address
304 North Cardinal St.
Dorchester Center, MA 02124
Physical Address
304 North Cardinal St.
Dorchester Center, MA 02124
Okay, listen up, all you sharp traders and aspiring pros! What’s up? Wanna level up your game in the crypto seas, stock oceans, forex waves, and pretty much any financial market out there? Wanna know how to catch those market ‘explosions’ and ‘quiet times’? Today, we’re breaking down a technical indicator you see all the time, but many don’t know how to use to its full potential: Standard Deviation (SD)! Don’t think this is just some boring math class stuff – in the trading world, it’s a low-key but seriously powerful tool in your arsenal!
Ready? Let’s dive deep!
This indicator isn’t some revolutionary new invention. Its core idea comes straight outta statistics: ‘standard deviation’ is used to measure how spread out a bunch of data points are (in our case, prices). So how did it make its way into trading?
Its ‘Daddy’ is Actually Bollinger Bands: Yep! Those Bollinger Bands you use all the time? The middle line is a Moving Average (MA), and the upper and lower bands are calculated using Standard Deviation! When John Bollinger invented Bollinger Bands back in the 1980s, he wanted a statistical way to measure market volatility. He figured out that prices usually tend to fluctuate within a certain standard deviation range around a moving average.
Going Solo: Later on, traders realized that looking at Standard Deviation by itself also has value, not always needing to be paired with Bollinger Bands. It directly tells you if the market is currently experiencing ‘calm waters’ or ‘choppy seas.’
So, the birth of the Standard Deviation indicator was all about helping us quantify something invisible but incredibly important in the markets: Volatility.
Don’t sweat it, no heavy math required here. But understanding how it works helps you understand why it works.
Find the ‘Average Price’: First, the indicator calculates a Simple Moving Average (SMA) over a specific period (like the last 20 days). This is our baseline.
Measure How ‘Far’ Each Day Is: Then, it looks back over that period and sees how far each day’s closing price was from that SMA line (this difference is called ‘deviation’).
Calculate the ‘Average Distance’: Finally, it uses a statistical formula (the Standard Deviation formula) to figure out the average amount of this deviation.
In simple terms, the Standard Deviation value means:
High SD Value: Means recent price swings have been big, prices are often far from the average. The market is very ‘active’ or ‘uncertain’.
Low SD Value: Means recent price swings have been small, prices are hugging the average line, not much action. The market is ‘quiet,’ maybe ‘building energy.’
Think of a rubber band:
Low SD = Relaxed rubber band, not much tension.
High SD = Rubber band stretched tight, full of potential energy!
「Explaining the Standard Deviation Concept」
Level 1: The Textbook Basics
The most fundamental way to read SD is to gauge the market state:
Extremely Low Standard Deviation: Usually means the market is consolidating (moving sideways). Prices lack direction, volume might dry up. Many traders see this as the ‘calm before the storm’ because markets rarely stay quiet forever. Low volatility is often followed by a big, directional move (a breakout up or down).
How to Use It: Watch for the price to break out of this consolidation range. If the breakout happens as the SD indicator starts to rise, it could be an entry signal.
Extremely High Standard Deviation: Indicates intense market volatility. This could be due to major news releases, unexpected events, or a trend reaching exhaustion, leading to panic selling or FOMO buying.
How to Use It:
Trend Followers: High SD might confirm a strong, ongoing trend (if price keeps moving decisively in one direction).
Contrarian Traders: At extreme highs in SD, especially when price is stretched super far from its average, some might look for ‘Mean Reversion’ opportunities. They’re betting the price will temporarily snap back towards the average. This is a high-risk play, so be cautious!
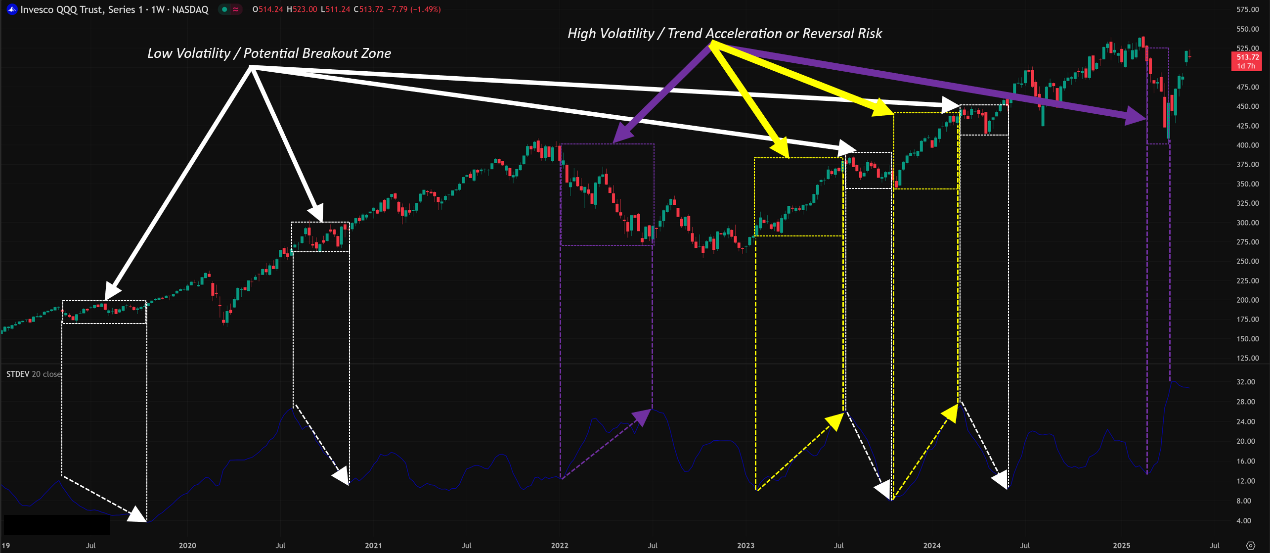
「High vs. Low Standard Deviation Examples」
This is where the real edge is! Many just stick to the default settings, but the pros know how to tweak it.
A. Parameter Settings (Periods) Deep Dive:
Default Parameter: 20 Periods
Why 20? It roughly corresponds to the number of trading days in a month for traditional stock markets. It’s a balanced setting, good for capturing medium-term volatility shifts. Pretty common on the Daily (D1) chart.
How Traders Around the World Play It (Global Variations & Styles):
Short-Term/Day Traders (Scalpers/Day Traders – Common in US/EU & Asian crypto circles):
Parameters: Tend to use shorter periods, like 10, 12, or even 5 periods.
Why: Shorter settings are more sensitive to recent price changes, allowing quicker detection of sudden volatility spikes or drops. Great for finding quick in-and-out opportunities on M5 (5-minute) or M15 (15-minute) charts.
Example: In the fast-moving crypto market, many use a 10-period SD on an M15 chart to spot ‘volatility breakout’ entries.
Swing/Trend Traders (Used everywhere, depends on the asset):
Parameters: Might stick with the default 20 periods, or use slightly longer ones like 30 or 50 periods.
Why: Longer periods filter out short-term noise, revealing the broader volatility trend. For instance, if a 50-period SD has been low for a long time and starts climbing, it could signal the start of a major new trend.
Example: Using a 30-period SD on an H4 (4-hour) or D1 chart to judge if a consolidation phase is nearing its end.
Long-Term Investors:
Parameters: Might employ 100 or even 200 periods.
Why: They’re concerned with very long-term market conditions, like determining if the market has entered an extended period of low or high volatility.
Example: Using a 100-period SD on a W1 (Weekly) chart to assess the overall risk level in the broader market.
B. The Impact of Timeframes:
The same parameter setting can mean totally different things on different timeframes!
Short Timeframes (M1, M5, M15): SD will jump around a lot, lots of ‘spikes.’ It reacts fast, but there’s a lot of noise. Good for catching brief intra-day volatility plays, but easy to get faked out by false signals.
Medium Timeframes (M30, H1, H4): More balanced. SD is smoother but still responsive enough. Ideal for swing trading, catching moves that last several days to a few weeks. Many favor H1 / H4 with a 20-period SD.
Long Timeframes (D1, W1, MN): SD changes very slowly, showing the volatility state of major trends. A significant shift here might indicate a structural change in the market. Suitable for long-term positioning and gauging the big picture.
C. Which Combos Are “Hot” & Effective? (The “Hot” Combos – Disclaimer: No Holy Grail!)
Remember: The market’s dynamic, and no single parameter combo is the ‘best’ forever. Here are some combos currently discussed or known to perform well in specific strategies, but backtesting and personal validation are KEY!
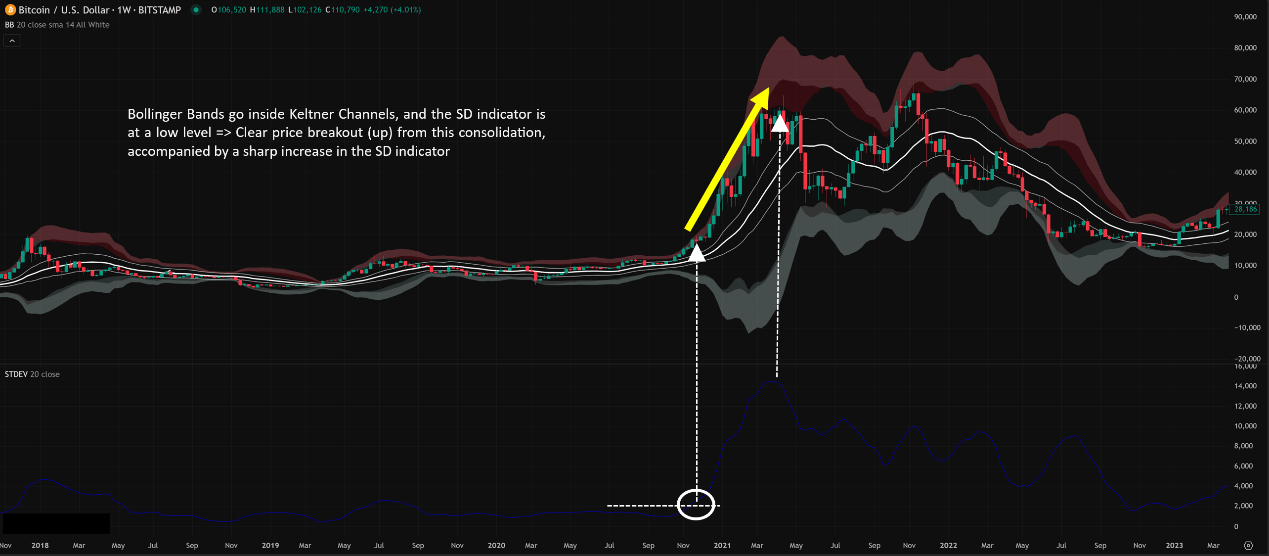
Combo 1: “Volatility Squeeze Breakout” Strategy
Settings: 20-period SD + Bollinger Bands (20, 2) + Keltner Channel (20, 1.5 ATR) (Many platforms bundle this as the TTM Squeeze indicator)
Timeframes: H1, H4, D1
Logic: When the Bollinger Bands squeeze inside the Keltner Channels, it means SD is extremely low – market energy is highly compressed (like a coiled spring). The SD indicator itself will be at rock bottom.
How to Use: Wait for the price to break out strongly (up or down) from this ‘squeeze zone’, AND the SD indicator must turn sharply UP, confirming volatility’s return. Enter in the direction of the breakout. This is a classic strategy for catching moves after sideways consolidation.
Effectiveness: Said to work better in markets that have recently been trending (either up or down) and are now pausing.
「”Volatility Squeeze Breakout” Example」
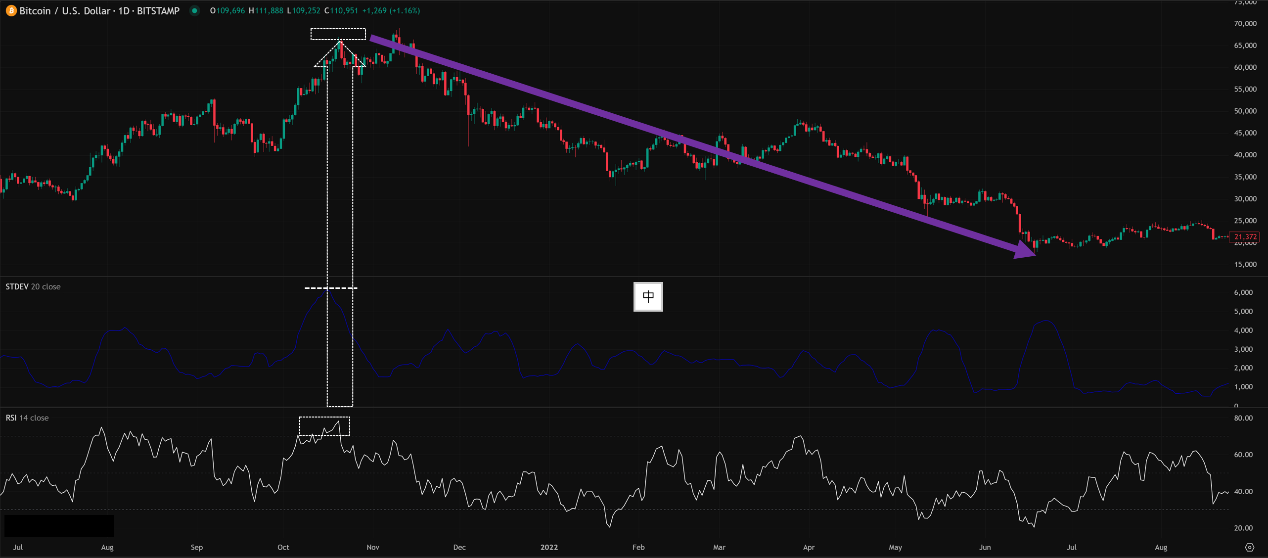
Combo 2: “Extreme Volatility Fade” Capture
Settings: 10 or 14-period SD + RSI (Relative Strength Index)
Timeframes: M15, M30, H1 (Shorter-term focus)
Logic: In highly volatile markets like crypto, price can sometimes shoot extremely far from its average in a short time, causing SD to spike. When SD hits a recent extreme high, AND price is simultaneously overbought/oversold (e.g., RSI > 70/80 or < 30/20), AND a reversal candlestick pattern appears (like a Pin Bar, Engulfing Pattern), it might signal a short-term reversal opportunity.
How to Use: In extreme high SD conditions, wait for the RSI extreme + a clear reversal Price Action signal. Then consider a counter-trend scalp, usually targeting a move back towards the moving average. This is extremely risky, a tight stop-loss is mandatory!
Effectiveness: Better suited for experienced short-term traders with high risk tolerance. Can be useful in range-bound markets or near potential trend exhaustion points.
「”Extreme Volatility Fade” Example」
Combo 3: “Low Vol Entry, High Vol Exit” Filter (Volatility Filter)
Settings: 20 or 30-period SD (depends on your trading cycle) + Your existing entry strategy (e.g., MA crossover, trendline break)
Timeframes: Match your primary strategy’s timeframe (H1, H4, D1 common)
Logic: Use SD to help decide when to pull the trigger and when to stay sidelined.
How to Use:
Entry Filter: When your entry signal triggers, check the SD. If SD is low and just starting to turn up, the signal might be more reliable (volatility supports the move). If SD is still dead flat, even with a signal, maybe wait or reduce your position size – it could be a fakeout.
Exit Consideration: When you’re holding a profitable position and SD spikes to extremely high levels, it could mean the market is getting overheated, and the trend might reverse or pull back sharply. Consider taking partial profits or tightening your stop-loss.
Effectiveness: This isn’t a standalone strategy but an optimizer to potentially improve the win rate and risk management of your existing system. Many successful traders use volatility indicators as a decision filter.
D. What Are the Best Parameter Combos? (The Million Dollar Question)
Let’s be real: There isn’t one! Absolutely not! If anyone tells you a specific setting is universally the best, they’re either lying or new to the game.
Why?
Markets Change: Bull markets, bear markets, choppy ranges – different conditions favor different indicator behaviors.
Assets Differ: Bitcoin’s volatility profile is vastly different from Gold, the S&P 500, or a specific stock like TSLA. The “best” settings will vary.
Your Style Matters: Are you a scalper or a long-term holder? High risk tolerance or low? These factors influence how you should use SD.
So What Do You Do?
Start with the Default: 20 periods is a solid starting point.
Understand the Logic: Know that shorter periods = sensitive, longer periods = smoother.
Backtest Extensively: Use historical data for the markets and timeframes you trade. Try different parameters (e.g., 10, 14, 20, 30, 50) and see which ones historically performed better with your strategy (remembering past performance doesn’t guarantee future results).
Combine with Other Indicators: SD only tells you “how loud” the market is, not “which way” it’s going. Always use it alongside trend indicators (MAs, MACD), momentum oscillators (RSI, Stochastics), chart patterns, support/resistance, etc.
Keep Optimizing: Stay curious, observe the market, and periodically review if your chosen parameters are still effective.
Key Takeaways on Parameters/Timeframes:
Short-term / High-Volatility Markets (e.g., Crypto M15/H1): Consider 10-14 period SD.
Mid-term Swings (e.g., Stocks/FX H4/D1): 20-30 period SD are common choices.
Long-term Trends (e.g., Indices/Commodities W1): 50+ period SD can offer perspective.
TTM Squeeze Strategy: Typically uses 20-period SD (with BB 20,2 / KC 20, 1.5).
Most Importantly: TEST! TEST! TEST! Find what works for you.
Standard Deviation isn’t a direct buy/sell signal generator, but it’s a crucial market state detector and strategy filter. It helps you:
Quantify Volatility: Turn the abstract market “vibe” into a concrete number.
Identify Potential Opportunities: Low volatility can signal upcoming breakouts; high volatility can signal potential reversals or trend acceleration.
Optimize Entries & Exits: Combine it with your strategy to potentially improve timing and manage risk.
Adapt to Different Markets: Tweak parameters and timeframes to apply it across various assets and trading styles.
For you young, global traders aiming to crush it in crypto, forex, stocks, whatever – mastering Standard Deviation can definitely help you find more alpha (that sweet extra return)!
Remember:
There are no holy grail settings.
Always combine SD with other analysis tools.
Backtesting and real-world practice are king.
Hope this deep dive helps you out! Go fire up your trading platform and play around with Standard Deviation! Got questions or insights? Drop ’em in the comments on the site! We’ll break down more cool indicators next time! Peace out!