Physical Address
304 North Cardinal St.
Dorchester Center, MA 02124
Physical Address
304 North Cardinal St.
Dorchester Center, MA 02124
Okay, all you agile Swing Traders, Crypto bounce catchers, and friends looking to precisely nail those market “gear shifts”! Today, we’re dissecting an oscillator that reacts super fast and specifically tells you the price’s “relative position” within its recent high-low range – the Stochastic Oscillator, or simply Stoch! It’s often mentioned alongside RSI, but its gameplay and strengths are quite different! Wanna know how to use it to catch bounces and spot momentum exhaustion? Let’s get into it!
What the heck is Stochastic (Stoch)? What’s the biggest difference from RSI?
The Stochastic Oscillator was developed by George C. Lane back in the 1950s. It’s a momentum oscillator based on a core premise:
In an uptrend, closing prices tend to cluster near the recent highs.
In a downtrend, closing prices tend to cluster near the recent lows.
When this pattern changes (e.g., closing prices start falling away from the highs in an uptrend), it might signal weakening momentum.
It mainly consists of two lines, oscillating between 0 and 100:
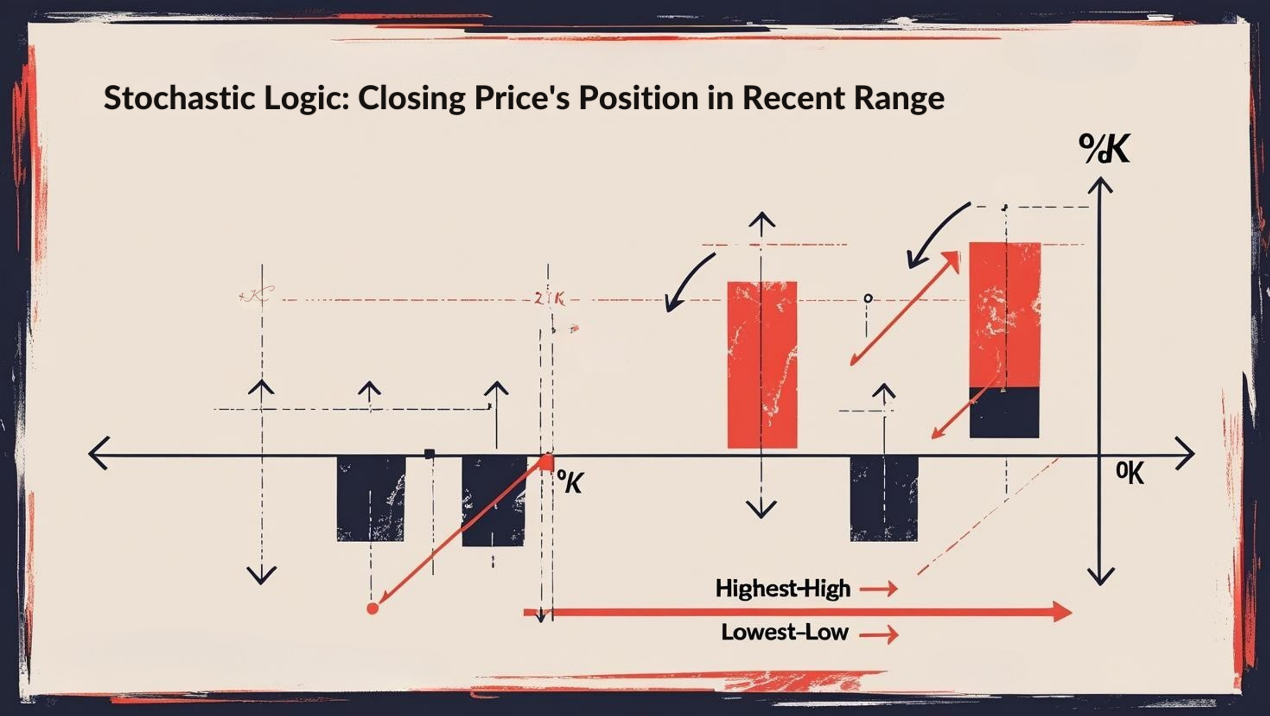
%K Line: The main line. It calculates the current closing price’s position relative to the highest high and lowest low over a set period (e.g., the last 14 days). The higher the value, the closer the close is to the recent high.
%D Line: Usually a moving average of the %K line (e.g., 3-period SMA). Its purpose is to smooth out the %K line and provide more reliable trading signals. It’s the signal line.
Many platforms also distinguish between Fast Stochastic and Slow Stochastic:
Fast Stoch: The %K line has no additional smoothing; the %D line is an SMA of this raw %K. Lines react extremely fast but are super choppy (noisy).
Slow Stoch (More Commonly Used): The %K line itself is already an SMA of the raw Fast %K (e.g., 3-period), and the %D line is then an SMA of this Slow %K (e.g., 3-period). The lines are smoother, making signals relatively more reliable. We’ll primarily discuss Slow Stoch below.
Biggest difference from RSI:
RSI: Measures the speed and magnitude of price changes (recent average gains vs. average losses).
Stochastic: Measures the closing price’s position relative to its recent trading range.
Analogy: If price is a car, RSI is like looking at its speedometer (how fast it’s going). Stochastic is like looking at its position within the lane (is it hugging the left line, the right line, or driving down the middle?).
「Stochastic Structure: %K (Position) + %D (Smoothed) + 80/20 Zones」
George Lane’s observation was simple but profound: Momentum often changes direction before price does. The closing price’s position relative to the recent high-low range is a good way to reflect this momentum shift.
Design Philosophy:
When upside momentum is strong, buyers tend to push the price to close near the session’s high.
When downside momentum is strong, sellers tend to push the price to close near the session’s low.
If this strength fades, the close fails to push near the extremes, causing the Stochastic lines to turn down/up from extreme levels, signaling a potential turn.
Calculation Core (%K – Slow Stoch Concept):
2. Smooth %K_raw to get Slow %K: Apply a short-period SMA (e.g., 3-period) to %K_raw.
3. Calculate %D: Apply another short-period SMA (e.g., 3-period) to the Slow %K.
「Stochastic Logic: Closing Price’s Position in Recent Range」
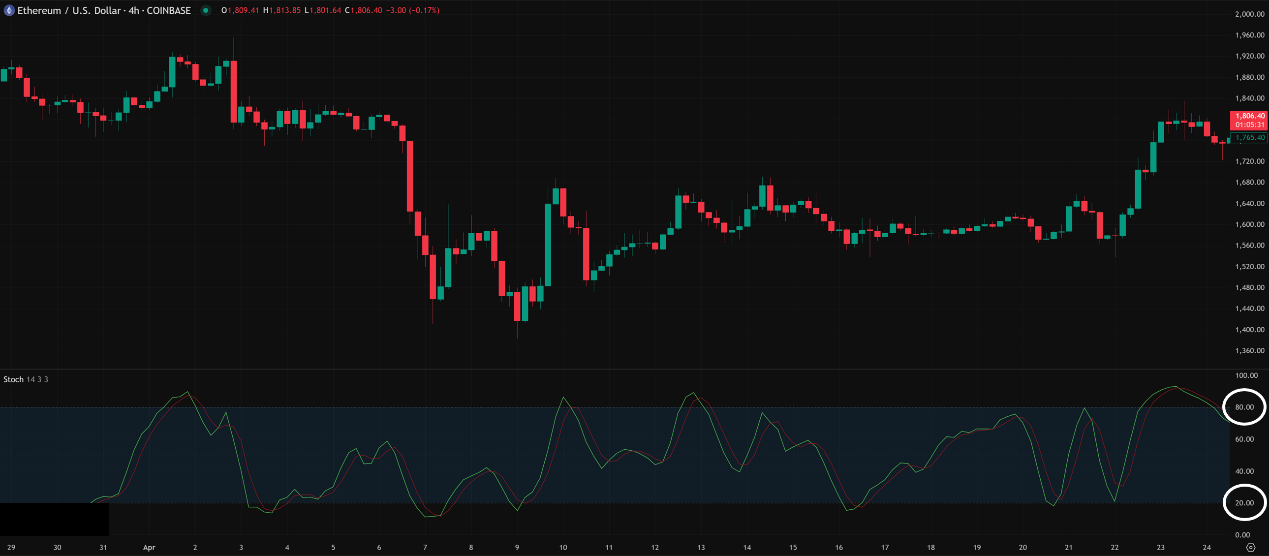
Overbought/Oversold Zones (Common but Use with Caution!):
Stoch (usually watching %D) > 80 → Overbought. Market might be rising too fast, risk of pullback. NOT an immediate short signal!
Stoch < 20 → Oversold. Market might be falling too fast, chance of a bounce. NOT an immediate buy signal!
Same Trap as RSI: In strong trending markets, Stochastics can stay >80 or <20 for extended periods! Acting immediately on these levels in a strong trend is a recipe for disaster!
More Reliable Use: Wait for the Stoch lines to cross back below 80 from the overbought zone as a potential sell/exit long signal; wait for them to cross back above 20 from the oversold zone as a potential buy/exit short signal. This confirmation step is crucial!
「Stochastic OB/OS: Exiting the Zone Matters More Than Entering」
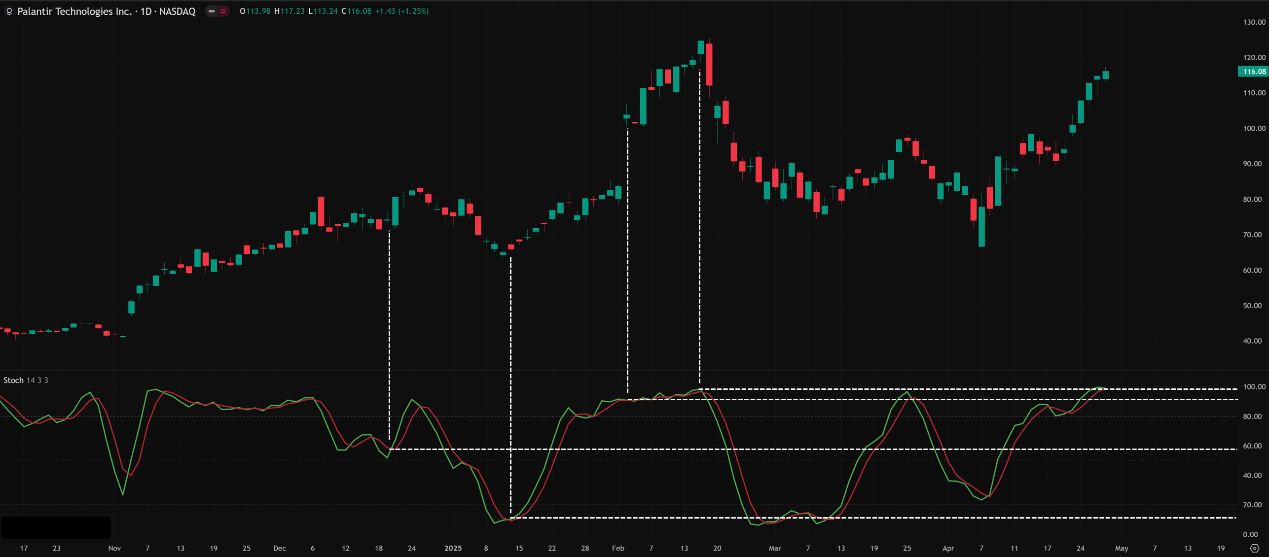
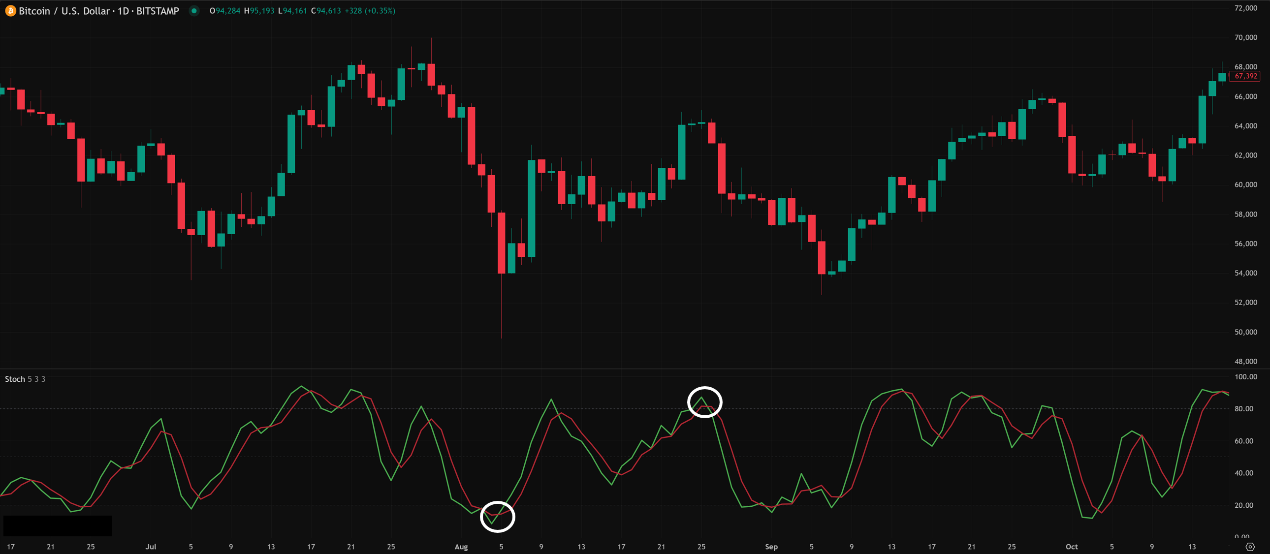
%K / %D Line Crossover (K/D Crossover):
%K line (fast) crosses ABOVE %D line (slow): Bullish Crossover, potential buy signal. Stronger if it occurs in or near the oversold zone (<20).
%K line (fast) crosses BELOW %D line (slow): Bearish Crossover, potential sell signal. Stronger if it occurs in or near the overbought zone (>80).
Pros: Signals momentum shifts faster than RSI crosses or Stoch exiting 80/20.
Cons: Generates MANY false signals! Especially in choppy markets or during minor fluctuations in strong trends. Absolutely needs other confirmation!
「Stochastic K/D Cross + OB/OS Zone = Enhanced Signal」
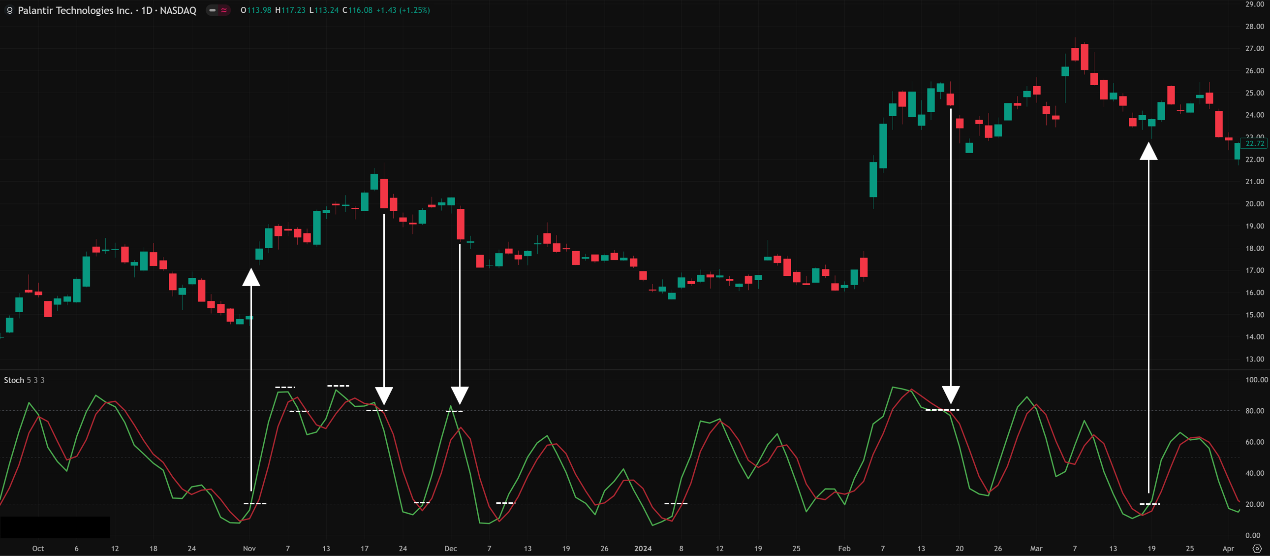
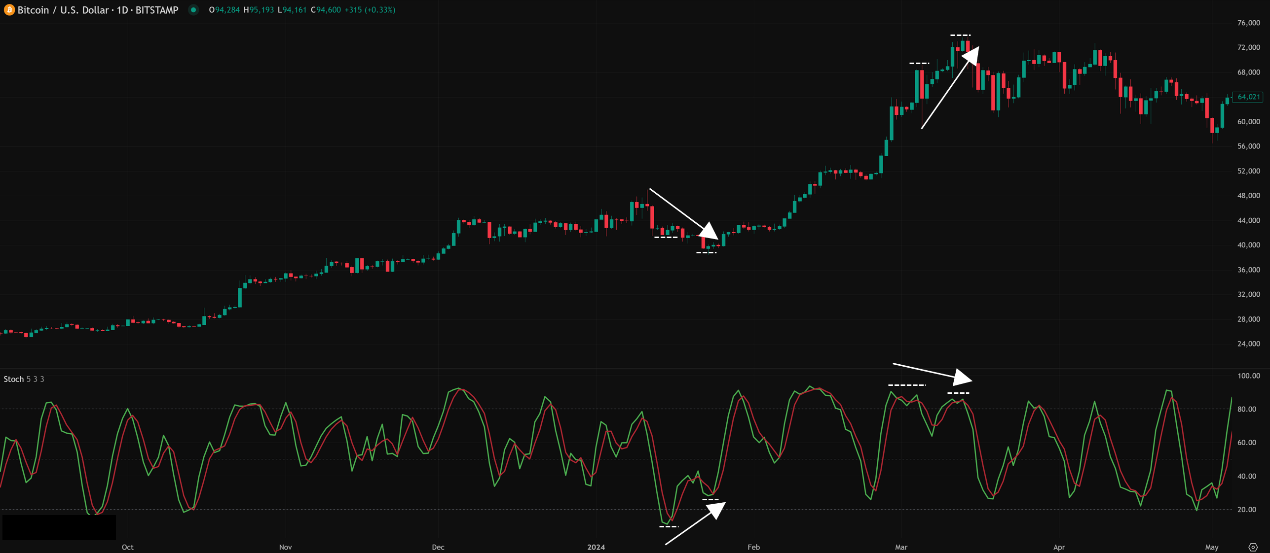
Stoch’s real power, like RSI’s, often lies in divergence!
Divergence (Stoch’s Killer App!):
Because Stoch reacts fast, its divergence signals might appear earlier than RSI’s, but they might also be less reliable (needing stronger confirmation).
Regular Bullish Divergence:
Price LL, Stoch HL → Potential bottoming / bounce signal.
Regular Bearish Divergence:
Price HH, Stoch LH → Potential topping / pullback signal.
「Stochastic’s Ace: Regular Divergence (Predicts Reversals)」
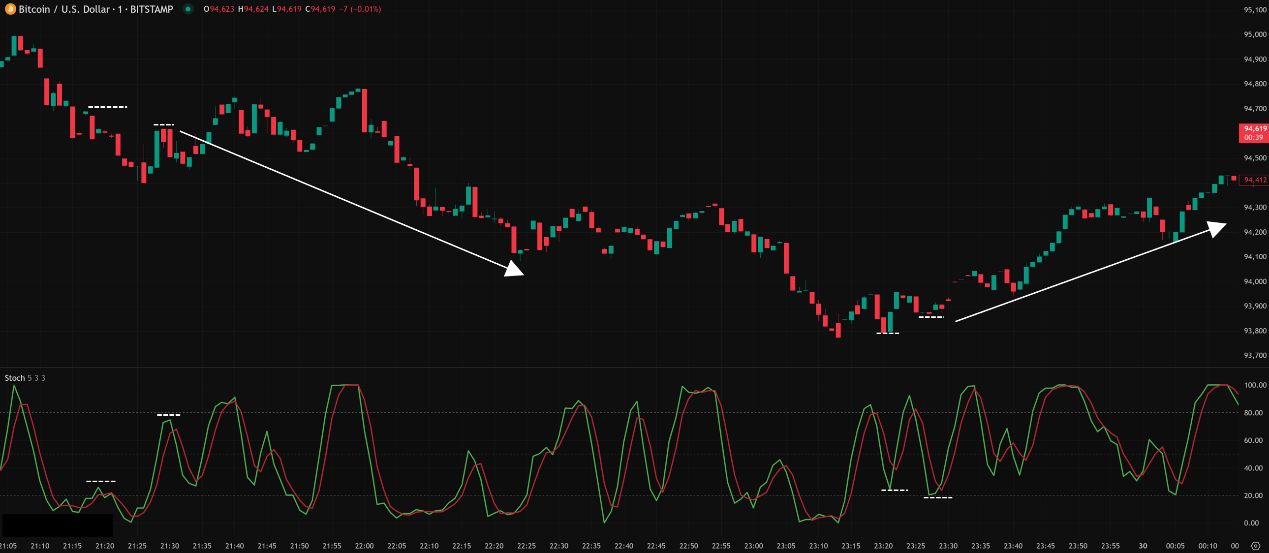
Hidden Divergence (Confirming Trend Continuation):
Hidden Bullish Divergence:
Price HL, Stoch LL → Potential uptrend continuation, buy-the-dip opportunity.
Hidden Bearish Divergence:
Price LH, Stoch HH → Potential downtrend continuation, sell-the-rally/short opportunity.
「Stochastic Advanced: Hidden Divergence (Predicts Trend Continuation)」
Stochastic Pop / Thrust (Less Common but Useful):
Bullish Pop: When Stoch breaks strongly above 20 from the oversold zone and quickly surges towards 50 or higher, indicating a sudden burst of buying pressure. Could signal the start of a quick rally.
Bearish Thrust: When Stoch breaks strongly below 80 from the overbought zone and quickly plunges towards 50 or lower, indicating a sudden surge in selling pressure. Could signal the start of a sharp drop.
This tactic tries to catch moments of momentum explosion.
Using 80/20 Levels as a Trend Filter:
In an uptrend, Stoch tends to frequently hit or stay near 80 and rarely breaks below the 40-50 zone. If Stoch starts frequently breaking below 50 or hitting 20, it might be a sign the uptrend is weakening.
In a downtrend, Stoch tends to frequently hit or stay near 20 and rarely breaks above the 50-60 zone. If Stoch starts frequently breaking above 50 or hitting 80, it might be a sign the downtrend is weakening.
Core Parameters (Slow Stochastic):
%K Lookback Period: The period N for calculating highest high / lowest low. Default = 14.
%K Smoothing Period: The SMA period used to smooth the raw %K_raw into Slow %K. Default = 3.
%D Period: The SMA period used to smooth the Slow %K to get the %D line. Default = 3.
So the default setting is usually written as (14, 3, 3).
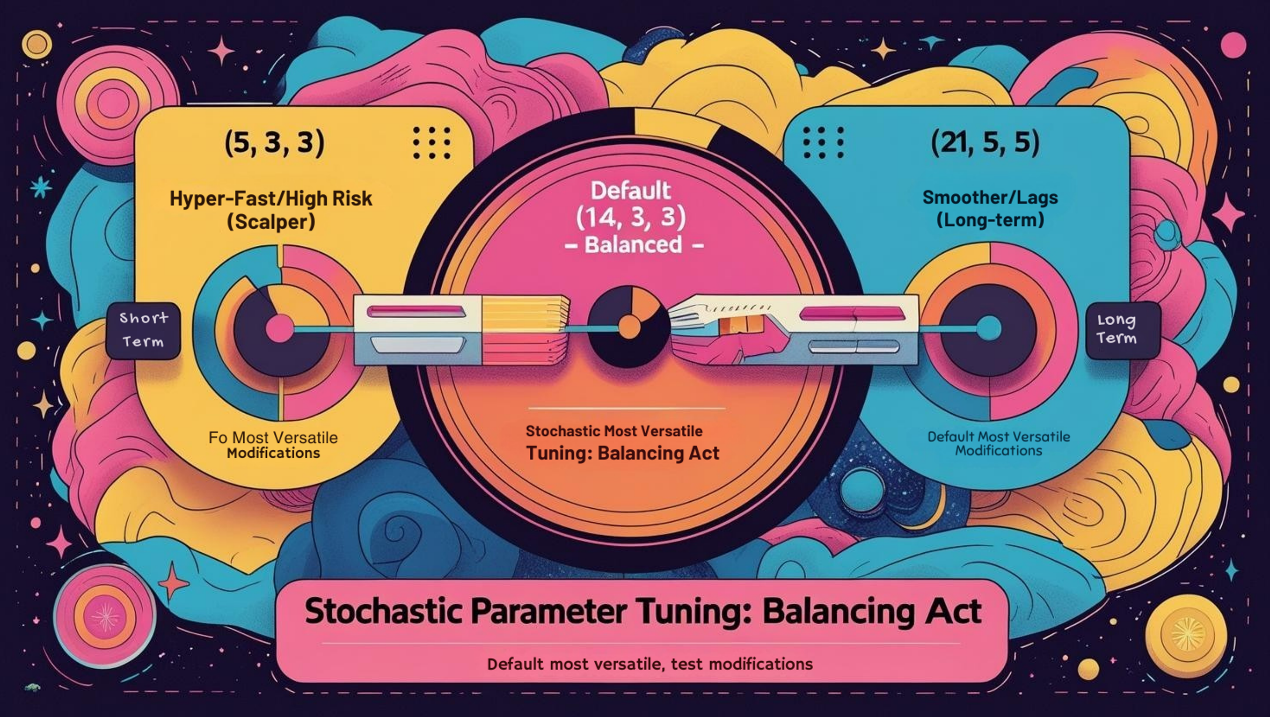
Parameter Settings Analysis & “Hottest” Combo Discussion:
Is Default (14, 3, 3) Best? It’s the most common and widely accepted setting, especially suitable for swing trading on H1, H4, Daily charts. It strikes a decent balance between responsiveness and smoothness.
Effects of Changing Parameters:
Shorter Lookback Period (e.g., 5, 3, 3 or 8, 3, 3):
Effect: Indicator becomes extremely sensitive, reacts super fast, lines are very choppy.
Use Case: Primarily for ultra short-term traders (Scalpers) on M1/M5/M15 charts trying to catch tiny fluctuations and reversals. They might focus only on extreme OB/OS (e.g., 95/5) or very fast K/D crosses.
Risk: Flooded with false signals! Requires pinpoint entries and strict stops.
“Hottest”? (5, 3, 3) is a known setting in scalping circles, but definitely not for beginners.
Longer Lookback Period (e.g., 21, 5, 5 or longer):
Effect: Indicator is smoother, reacts slower, better reflects longer-term momentum.
Use Case: For longer-term traders or those wanting to filter more noise. Might focus more on the 50 level or wider OB/OS zones.
Risk: Too lagging, might miss many swing opportunities.
Shorter Smoothing Periods (e.g., 14, 1, 1 – essentially becomes Fast Stoch!):
Effect: Lines react faster but extremely noisy.
Longer Smoothing Periods (e.g., 14, 5, 5):
Effect: Both %K and %D lines are smoother, reducing crossover signals, potentially making them more reliable but also more lagging.
Conclusion: The “hottest” combo for most people remains the default (14, 3, 3). It offers the best versatility. Scalpers can explore (5, 3, 3) / (8, 3, 3), knowing the risks. Long-term traders might test (21, 5, 5). The key is Backtesting!
「Stochastic Parameter Tuning: Balancing Act」
Timeframe Analysis:
Ultra Short-Term (M1, M5, M15):
Usable, but Extremely Noisy! Especially with short parameters (e.g., 5, 3, 3). Lines will frequently whip between 80/20, crosses are constant. Might primarily watch for extreme OB/OS (e.g., 95/5) or very clear divergences.
Intraday / Short Swing (H1, H4):
Stochastic’s Common Playground! (14, 3, 3) performs reasonably well here.
How to Use: Combine OB/OS zone exits, K/D crossovers, and divergences to find trading opportunities. Hidden divergence is also useful here.
Swing / Long-Term (Daily, Weekly):
Still very useful, especially for Divergence! Longer-term Stochastic divergence signals are more reliable and often precede major turns. Default (14, 3, 3) or slightly longer parameters (e.g., 21, 5, 5) work. OB/OS zones become more meaningful, but still beware strong trends.
Parameters: Default (14, 3, 3) is the most robust and versatile choice. Scalpers can test (5, 3, 3) / (8, 3, 3); Long-term can test (21, 5, 5), but Backtest!
Timeframe: H1, H4, Daily are the most common and relatively effective periods. Weekly is good for major divergence. M15 or lower is high risk.
Hottest / Most Effective Usage = Master “Divergence” + Use “OB/OS Exit Confirmation” + Combine with “Market Structure”:
Divergence is Soul! Master both regular and hidden divergence.
Don’t Fade 80/20 Blindly! Wait for lines to exit the OB/OS zones as confirmation.
K/D Crossovers act as early hints, especially near OB/OS zones, but always confirm with other S/R or price action.
In ranging markets, Stoch’s OB/OS and crossovers might be more effective. In trending markets, beware OB/OS traps and focus more on hidden divergence.
ALWAYS Combine with Price Action, Trendlines, Patterns, etc.! Stochastic provides momentum and relative position info, not a complete strategy.
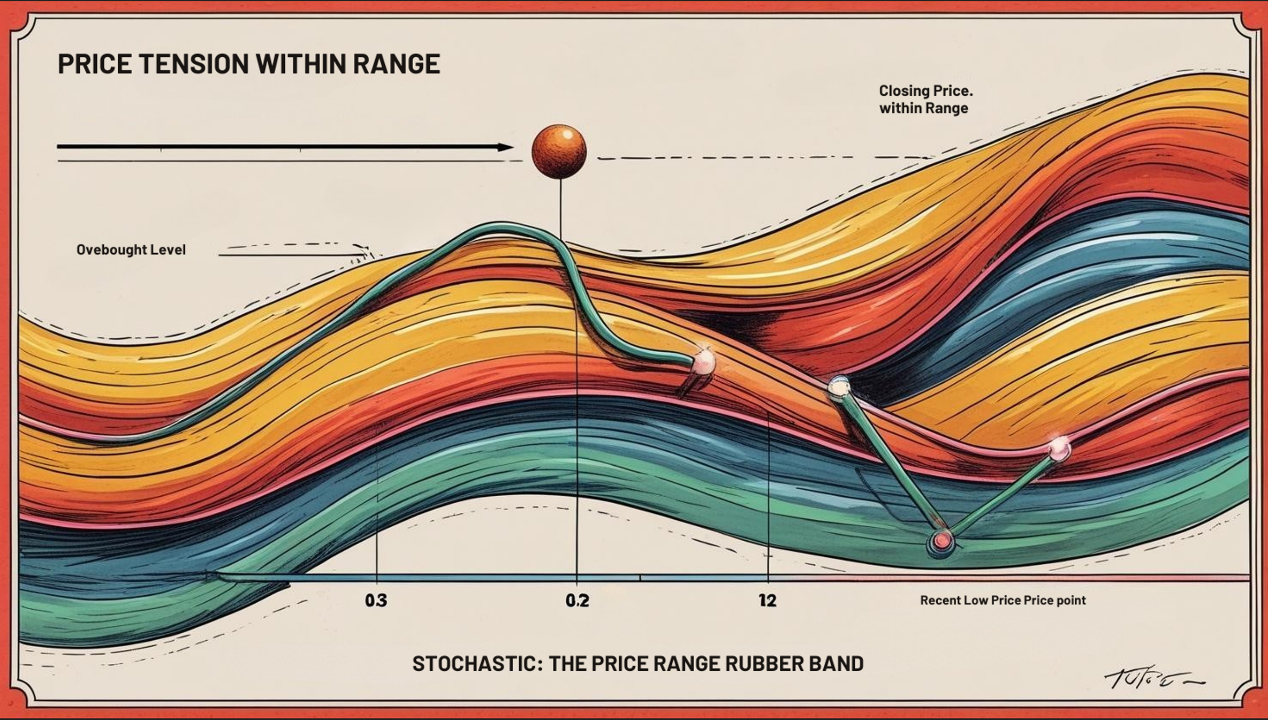
Stochastic: The Market’s “Rubber Band,” Showing Tension & Snap-Back
Stochastic is like a rubber band, showing how stretched the price is relative to its recent range (OB/OS) and how likely it might be to snap back. Its pros:
Fast reacting, especially the %K line.
OB/OS zones are relatively intuitive (despite traps).
Divergence signals are very useful.
Can be more effective than RSI in ranging markets for catching short swings.
But its cons:
Many false signals, especially K/D crosses.
OB/OS highly unreliable in strong trends.
Lines can be somewhat jagged (esp. Fast Stoch).
「Stochastic: The Price Range Rubber Band」
Stochastic is a very popular oscillator, especially among Swing Traders and some Day Traders. Learning its nuances, particularly divergence and how to interpret OB/OS in different market conditions, will make your analytical toolbox much more complete.
Next Steps:
Add Stochastic (use default 14, 3, 3 Slow Stoch) to your H1, H4, Daily charts.
Focus on practicing identifying regular and hidden divergences.
Observe how Stoch behaves differently in the 80/20 zones during strong trends vs. ranges.
Watch price action when the %K line exits the 80/20 zones.
Try combining Stoch with your favorite trend indicators or S/R analysis.
Backtest! If you want to use different parameters, validate them with data!
May you precisely capture the market’s bounces and turns! ⚡️