Physical Address
304 North Cardinal St.
Dorchester Center, MA 02124
Physical Address
304 North Cardinal St.
Dorchester Center, MA 02124
Alright crew, all you traders seeking ultimate timing, Crypto short-term snipers, and folks who want to master indicators like a pro! Today, we’re unlocking what could be called an “indicator of an indicator,” a high-level play that combines two classic weapons into one – the Stochastic RSI (StochRSI)! The name tells you straight up, it’s a mashup of Stochastic + RSI! Sounds powerful, right? Its reaction speed is indeed off the charts, but is it truly easy to use? How do you avoid getting faked out by its hyper-speed signals? Let’s break it down!
What the heck is StochRSI? What’s the fundamental difference from Stoch / RSI?
First things first! StochRSI is NOT applying the Stochastic formula directly to price, nor is it simply adding the Stoch and RSI lines together. Its core concept is: Applying the Stochastic Oscillator formula TO the RSI indicator’s values!
RSI: Measures the relative strength of price (recent gains vs. losses).
Stochastic: Measures the closing price’s position within its recent high-low range.
StochRSI: Measures the RSI value’s position within its own recent high-low range! It measures the momentum of the RSI indicator itself!
It usually consists of two lines (%K and %D), oscillating between 0 and 100 (theoretically 0-1, but most platforms multiply by 100):
StochRSI %K Line: The main line, showing the current RSI value’s position within the range of the highest and lowest RSI values over the past N periods.
StochRSI %D Line: A moving average of the %K line (usually a 3-period SMA), used to smooth %K and act as a signal line.
「Stochastic Formula Applied to RSI!」
Biggest difference from Stoch / RSI:
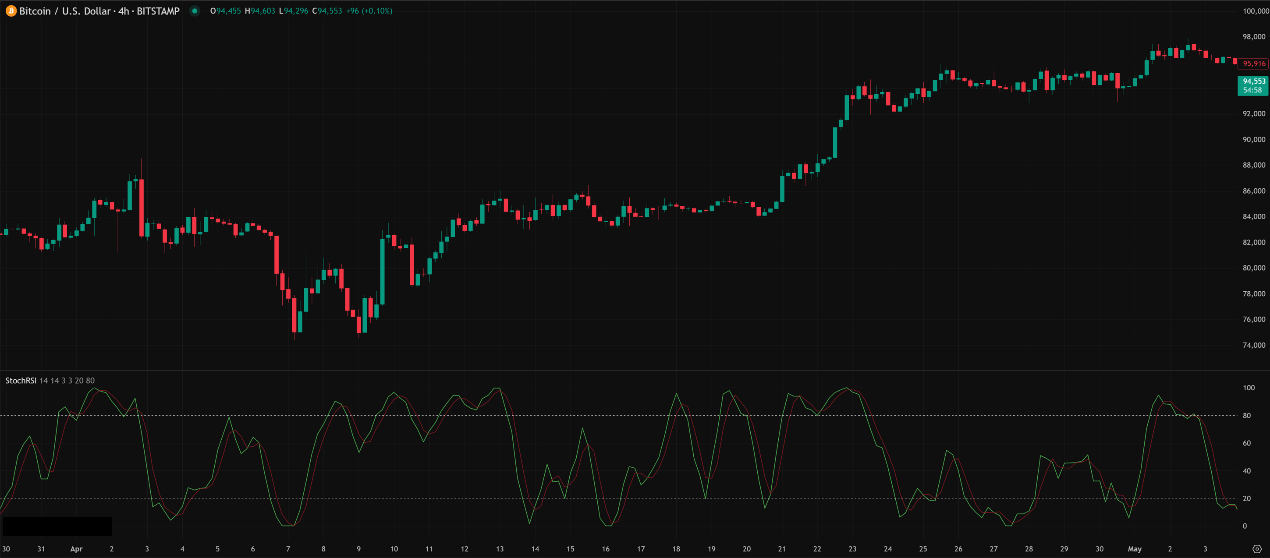
Way Faster Speed! Because it calculates oscillation based on RSI (which is already an oscillator), StochRSI reacts dramatically to even tiny changes in RSI. This makes its fluctuations between 0-100 far faster than both RSI and standard Stochastics!
Tons More Signals! Because it moves so fast, it frequently enters the Overbought (OB) / Oversold (OS) zones and generates crossover signals much more often.
StochRSI was introduced by technical analysts Tushar Chande and Stanley Kroll in their 1994 book, “The New Technical Trader.” Their main goal in inventing StochRSI was to:
Increase the Sensitivity of RSI Signals: They felt RSI was sometimes too slow, especially in ranging markets or early trends, potentially staying out of OB/OS zones for long periods. They wanted a tool that could reflect changes in RSI’s momentum more rapidly.
Generate More Trading Signals: StochRSI’s fast oscillations produce significantly more OB/OS and crossover signals than RSI.
Core Calculation Concept (Feel the Process):
Step One: Calculate Standard RSI first! (e.g., using 14 periods).
Step Two: Find the Highest and Lowest RSI values over the past N periods (e.g., the last 14 periods).
Step Three: Apply the Stochastic formula to calculate StochRSI %K!
StochRSI %K = [(Current RSI – Lowest RSI in Period) / (Highest RSI in Period – Lowest RSI in Period)] * 100
Step Four: Calculate StochRSI %D!
Apply a short-period SMA (e.g., 3-period) to the StochRSI %K line.
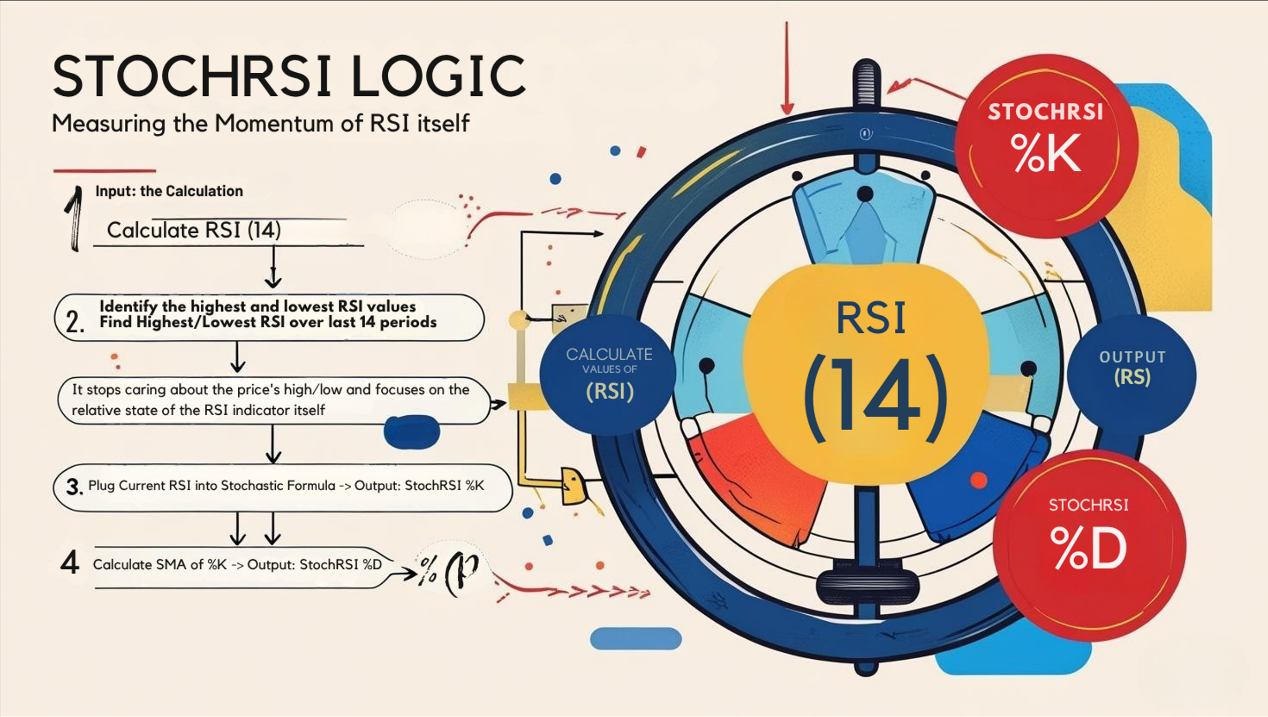
Simply Put: StochRSI is asking: “Hey, where is the current RSI line sitting relative to its own recent highs and lows?” It stops caring about the price’s high/low and focuses on the relative state of the RSI indicator itself. Think of it as putting a “magnifying glass” or an “accelerator” on the RSI.
「StochRSI Logic: Measuring the Momentum of RSI Itself」
Due to StochRSI’s extreme speed, its basic uses are similar to RSI/Stoch, but the pitfalls are much larger!
Overbought/Oversold Zones (OB/OS – 80/20 Standard, But Meaning is Different!):
StochRSI > 80 → Overbought.
StochRSI < 20 → Oversold.
Key Difference: StochRSI being overbought only means RSI is high relative to its own recent range, it DOES NOT necessarily mean the price itself is overbought! Price might still have plenty of room to run up, but RSI rose quickly in the short term, pushing StochRSI to 80.
Usage (Extremely Risky, Not Recommended Alone!):
Some might consider shorting when StochRSI > 80, or buying when < 20 for quick scalps.
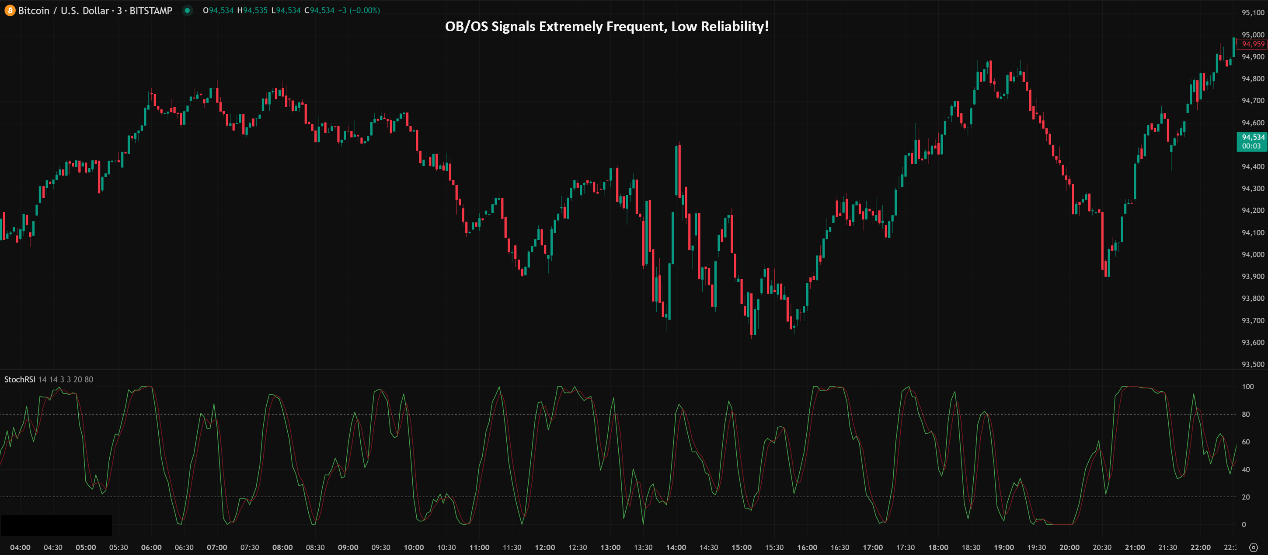
BUT! Because it’s so sensitive, it enters the 80/20 zones extremely frequently, especially during trends! You’ll constantly get OB/OS signals while the price might not reverse at all! Failure rate is extremely high!
Slightly More Reliable Use: Similar to Stoch, wait for the lines to exit the OB/OS zones (e.g., crossing below 80 from above; crossing above 20 from below) as an initial confirmation, but even this confirmation is much weaker than with Stoch or RSI.
「StochRSI OB/OS: More Signals ≠ More Accuracy!」
%K / %D Line Crossover (K/D Crossover – More Signals, More Noise!):
%K crosses above %D → Bullish Crossover.
%K crosses below %D → Bearish Crossover.
The Problem: Because StochRSI itself is so volatile, K/D crosses happen very, very often, and the vast majority are just market noise, especially in ranges.
Usage Suggestion:
Absolutely NEVER use alone!
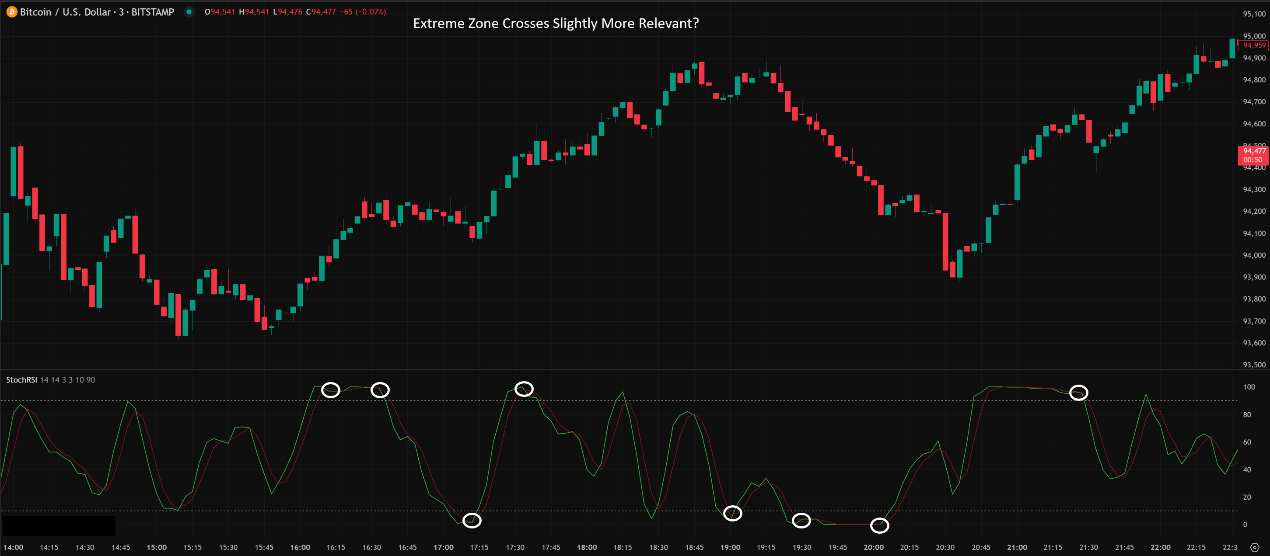
Consider paying attention only to crosses occurring in extreme zones (e.g., <10 or >90).
Best used as a final entry timing confirmation for signals derived from more reliable indicators (e.g., your main strategy signals buy, wait for a StochRSI bullish cross to enter).
「StochRSI K/D Crosses: Faint Signals in the Noise?」
StochRSI’s high-noise nature makes advanced usage tricky.
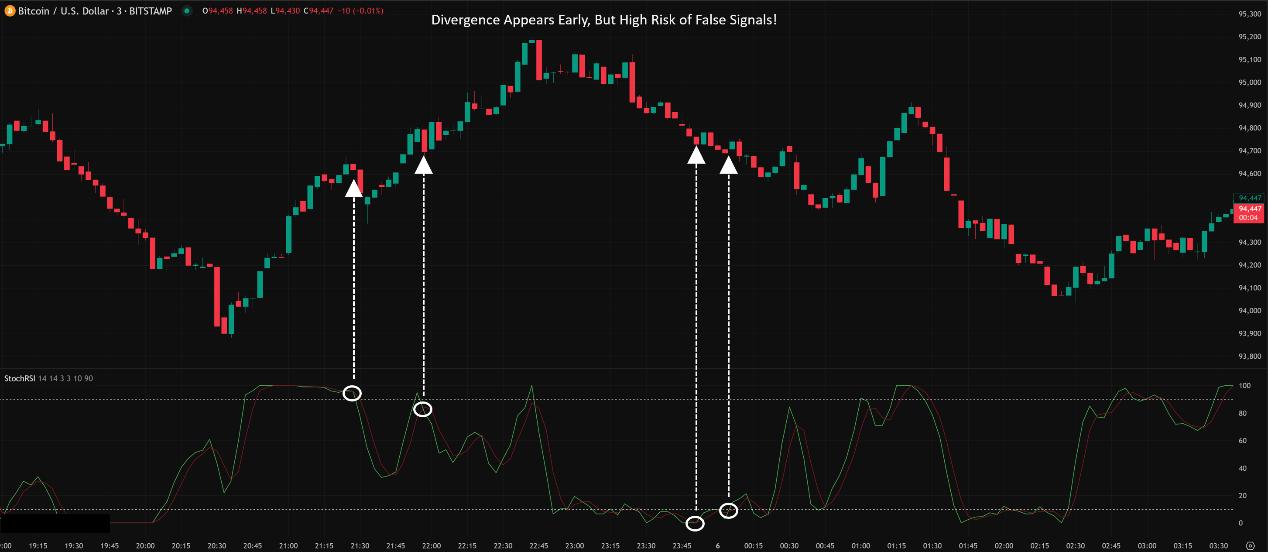
Divergence (Theoretically Possible, Practically Tricky):
Like RSI/Stoch, you can look for divergence on StochRSI.
Bullish Divergence: Price LL, StochRSI HL.
Bearish Divergence: Price HH, StochRSI LH.
Pros: Because StochRSI is fast, its divergence might appear earlier than RSI or Stoch divergence!
Cons: Also because it’s so fast, it’s more prone to false divergences! Minor price fluctuations can easily break a potential divergence pattern on StochRSI. Reliability is relatively lower; needs stronger price action confirmation.
「StochRSI Divergence: Early Warning vs. Head Fake? 」
As a Confirmation Tool (Possibly its Most Viable Use!):
This might be where StochRSI is most useful!
How to Use: When you get a trade signal based on other, more reliable analysis (e.g., price breaks key S/R, MA crossover, pattern completion, RSI divergence), you can use StochRSI for a final momentum confirmation or entry timing reference.
Example 1 (Buy Confirmation): Price breaks downtrend line + MACD bullish cross + wait for StochRSI to cross above 20 from oversold → Enter.
Example 2 (Sell Confirmation): Price breaks key support + RSI bearish divergence + wait for StochRSI to cross below 80 from overbought → Enter.
The Idea: Use StochRSI’s rapid reaction to catch a moment when short-term momentum aligns with your intended trade direction.
Trend Strength Reference? (Very Limited):
Some might try to use StochRSI consistently staying above/below 50 to gauge trend, but its high volatility usually makes this ineffective. RSI or ADX are much better suited for this.
Core Parameters (Usually 4, platform dependent):
RSI Length: Period used for the initial RSI calculation. Default = 14.
Stochastic Length: Lookback period for finding highest/lowest RSI values. Default = 14.
%K Smoothing: SMA period to smooth the raw StochRSI %K. Default = 3. (This is the first smoothing layer of Slow Stochastics).
%D Smoothing: SMA period to smooth the smoothed %K to get %D. Default = 3. (Second smoothing layer).
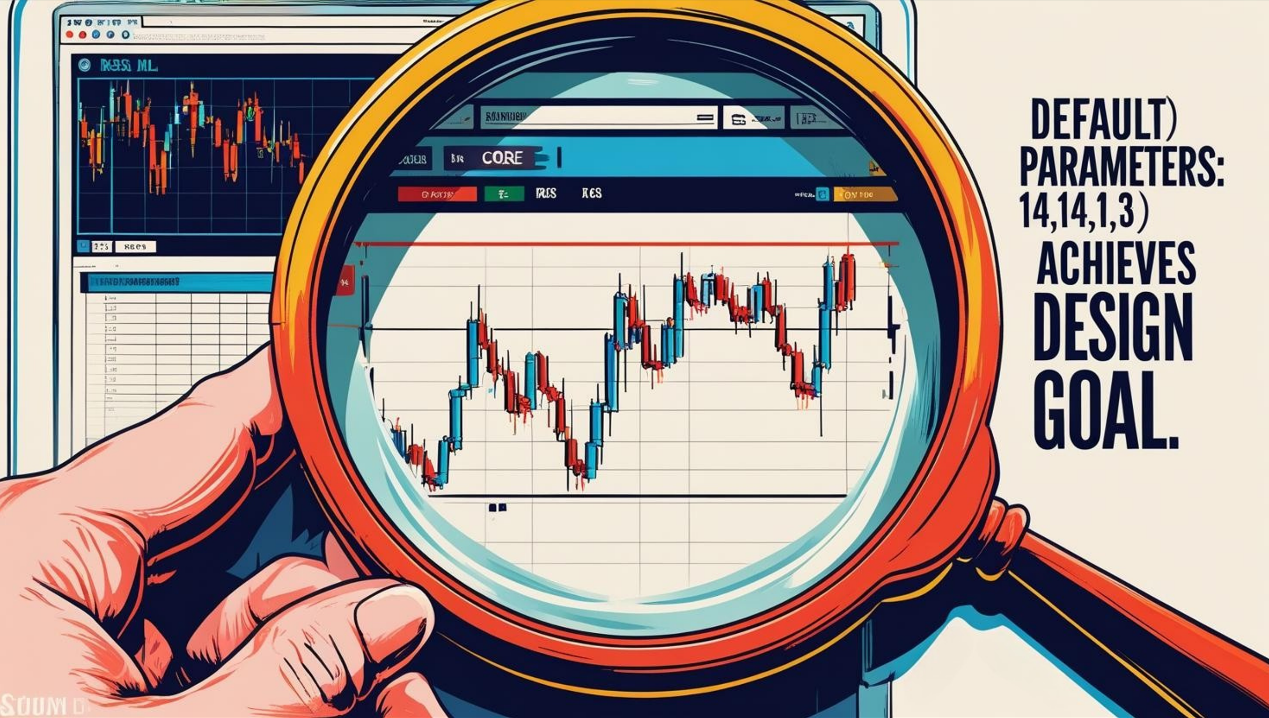
Standard Default: (14, 14, 3, 3).
Parameter Settings Analysis & “Hottest” Combo Discussion:
Is (14, 14, 3, 3) Gospel? It’s the most standard, commonly used setting, providing the kind of “RSI acceleration” effect the designers intended.
Impact of Changing Parameters?
Shortening RSI Length / Stochastic Length (e.g., 8, 8, 3, 3): Makes StochRSI even more hyper-sensitive! Lines will look like a chaotic seismograph. Almost unusable unless for extreme high-frequency trading.
Lengthening RSI Length / Stochastic Length (e.g., 21, 21, 3, 3): Makes StochRSI relatively smoother, fewer signals, but also defeats its original purpose of being “fast.” Might as well use standard RSI or Stoch.
Changing Smoothing Periods (e.g., 14, 14, 5, 5): Makes %K and %D lines smoother, fewer crosses, but adds lag.
Which “Unique” Combo is Hottest/Most Effective?
Similar to KDJ, StochRSI’s core identity is its speed and sensitivity. There’s little evidence that tweaking parameters leads to consistently better results.
Conclusion: For StochRSI, sticking with the default (14, 14, 3, 3) is the wisest approach. Your energy is better spent learning how to filter its signals and combine it with other tools, rather than getting lost in parameter optimization.
「StochRSI Parameters: Default is Core」
Timeframe Analysis:
Ultra Short-Term (M1, M5, M15):
Noise Hell! StochRSI generates an overwhelming amount of OB/OS and crossover signals here, mostly meaningless. Maybe extreme J-line readings offer a tiny hint? But extremely risky.
Intraday / Short Swing (H1, H4):
Starts becoming usable as a “Confirmation Tool.” On these timeframes, StochRSI’s fluctuations, while still fast, might be used to confirm a trade direction derived from other analyses (using exits from OB/OS or maybe a clearer divergence).
Example: Price forms a bullish Pin Bar at support on H4, and StochRSI simultaneously crosses above 20 – adds a bit of confluence.
Swing / Long-Term (Daily, Weekly):
Relatively more reliable, especially for Divergence! On longer timeframes, StochRSI’s volatility gets stretched out. While still faster than RSI/Stoch, divergences might be more meaningful (but still need confirmation). Frequent OB/OS signals likely reflect intermediate corrections rather than major tops/bottoms.
Usage: Primarily look for major divergences, or use exits from extreme zones as an auxiliary confirmation for pullback entries within a longer-term trend.
Parameters: Default (14, 14, 3, 3) is sufficient. Don’t overcomplicate it.
Timeframe: Daily / Weekly / H4 for divergence or confirmation might be better. H1 or lower primarily noise.
Hottest / Most Effective Usage = Position it as a “Confirmation Indicator,” NOT a Primary One:
Core Use: Confirm Other Signals! When your main strategy gives a signal, use StochRSI exiting OB/OS or crossing its signal line for final timing confirmation.
Divergence as Secondary Use: Can be watched, especially long-term, but always confirm with price action due to high false signal risk.
Don’t Trade OB/OS or Crossovers Alone! You will likely lose money.
Understand its Nature: It measures RSI’s momentum, not price’s!
StochRSI: RSI’s “Nitrous Boost” – Instant Burst, Burns Out Fast
StochRSI is like strapping a “Nitro Boost” onto the RSI, instantly jacking up its reaction speed. Pros:
Extremely Fast Reaction, captures minute shifts in RSI momentum.
Generates Lots of Signals (if that’s what you need…).
Divergence might appear earlier.
But the cons are a direct result of its speed:
Extremely Noisy, Tons of False Signals!
OB/OS Zones Have Little Predictive Power.
Harder to Master than RSI / Stoch.
Can easily lead to Over-trading for beginners.
「StochRSI: RSI’s Nitrous Boost (High Risk!)」

StochRSI is a very specific tool. It’s not for everyone, especially not beginners. It feels more like a scalpel in an expert’s toolkit, used for fine-tuning entry timing under specific conditions. If you haven’t mastered RSI and Stochastics individually, build that foundation first.
Next Steps:
Add StochRSI (using default 14, 14, 3, 3) to your charts.
Crucially, add standard RSI(14) and Stochastic(14, 3, 3) on the same chart for comparison! Notice how much faster StochRSI moves.
Observe StochRSI’s behavior in OB/OS zones – see how frequent it is.
Try spotting StochRSI divergence and compare if/when RSI/Stoch show corresponding divergence and how price reacts.
Practice using StochRSI as a “confirmation” step for your main strategy, not as the signal generator itself.
Backtest! Verify if it actually helps your trading system.
Hope you can harness this hyper-speed indicator wisely and seize those critical moments! ⚡️⏱️✨