Physical Address
304 North Cardinal St.
Dorchester Center, MA 02124
Physical Address
304 North Cardinal St.
Dorchester Center, MA 02124
Yo! What’s good, Chart Masters and future Trend Snipers! Our TA level-up journey hits another crucial stop! Today, we’re decoding something that’s arguably the most fundamental, intuitive, yet widely used and versatile tool in the TA world – yeah, I’m talking about Trendlines!
Don’t underestimate these simple lines YOU draw on the chart! They aren’t complex indicators, BUT! Master drawing and using them, and they become your super sidekick for judging trend direction, finding support and resistance, and even catching breakout opportunities! Think of them as the market’s “highway guardrails” or “river banks,” helping you see the main flow of price and its potential boundaries.
Wanna know how to draw a good trendline? How to use it to find entries and exits? Why trendlines sometimes break? How to spot real vs. fake breakouts? How to take this simple tool to the next level? Okay! Let’s start from the basics and fully master this fundamental yet timeless analysis technique! Let’s draw the line to profit!
Trendlines are practically as old as technical charting itself, one of the earliest forms of analysis.
Visual Embodiment of Dow Theory: Charles Dow’s core concepts of uptrends (Higher Highs, Higher Lows) and downtrends (Lower Highs, Lower Lows) – how do you see them most intuitively? By connecting the lows or highs with a trendline! Trendlines are the simplest way to visualize the core ideas of Dow Theory.
Early Chartists’ Staple: Before computers were widespread, analysts drawing charts on paper relied heavily on trendlines as a basic tool to determine direction and find S/R.
No Single Inventor: Unlike specific indicators, trendlines don’t have a single credited inventor. They’re more like a naturally evolved analysis method based on observing price behavior – a collective wisdom.
Purpose: Defining Trend Direction & Dynamic S/R: The core purposes of a trendline are twofold:
To visually define the current trend’s direction and slope.
To provide a dynamic support line (in an uptrend) or resistance line (in a downtrend).
So, trendlines are one of the most fundamental and core tools in technical analysis, the starting point for understanding market direction and structure.
The “design” of a trendline is manual drawing, but how do you draw one “correctly”?
Basic Drawing Method: Connecting Key Points
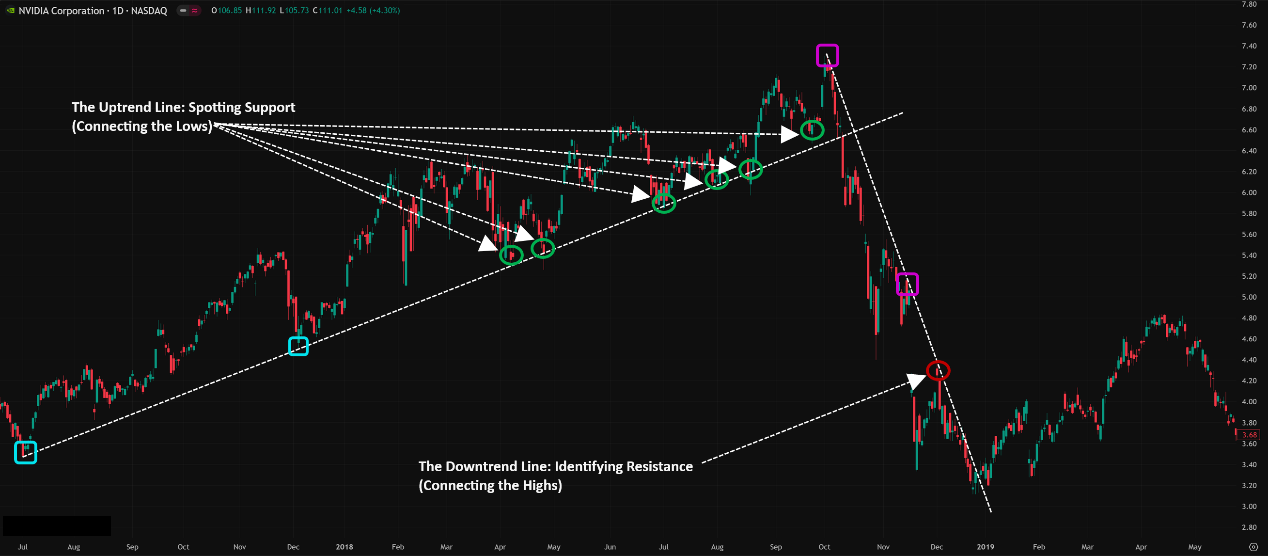
Uptrend Line:
Definition: In a clear uptrend, identify at least two significant pullback lows (Swing Lows / Higher Lows).
How to Draw: Start from the first low, draw a straight line connecting to the second or subsequent higher low, ensuring the line is not significantly breached by candle bodies in between. The line should run below the price action, acting as a rising support line.
Two points minimum, three or more are better! The more valid lows that touch the line, the more significant and reliable the trendline becomes.
Downtrend Line:
Definition: In a clear downtrend, identify at least two significant rally highs (Swing Highs / Lower Highs).
How to Draw: Start from the first high, draw a straight line connecting to the second or subsequent lower high, ensuring the line is not significantly breached by candle bodies in between. The line should run above the price action, acting as a falling resistance line.
Again, three or more touches confirm better!
Where to Draw? Wick or Body? (The Wick vs. Body Debate)
This is a common point of discussion!
Connecting Wick Tips:
Pros: Includes all price information, captures the absolute extremes tested.
Cons: Wicks can sometimes represent brief “fakeouts” or market noise; the resulting line might not fit the main price action area as closely.
Connecting Body Closes/Opens:
Pros: Ignores extreme volatility, better reflects where the bulk of trading occurred and where price settled. The line might feel more “solid.”
Cons: Might ignore significant tests indicated by long wicks.
No Absolute Answer! What to do?
Consistency is KEY! Decide whether you’ll primarily use wicks or bodies and stick to that method for consistency in your analysis. Don’t switch back and forth arbitrarily.
Best Fit Line Approach: Some draw a line that might slightly cut through wicks or bodies but generally has the most touches or best visual fit.
Context Matters: If wicks are exceptionally long, consider using bodies. If bodies are tiny and wicks look reasonable, maybe use wicks.
Beginner Advice: Starting by connecting the wick tips is often easier as it includes all data, but learn to discern which wick touches might just be noise.
Core Concept: A trendline represents the level where buyers consistently step in to provide support (uptrend line) or where sellers consistently apply pressure to provide resistance (downtrend line) within a given trend.
Think of a River Bank:
An uptrend line is like the left bank of a river flowing uphill. The water (price) tends to get pushed back (find support) when it hits that bank.
A downtrend line is like the right bank of a river flowing downhill. The water bouncing up hits the bank and tends to get pushed back down (find resistance).
「How to Draw Uptrend & Downtrend Lines」
Once the line is drawn, how do you make money with it?
Level 1: Basic Usage – Trend Following & Dynamic S/R
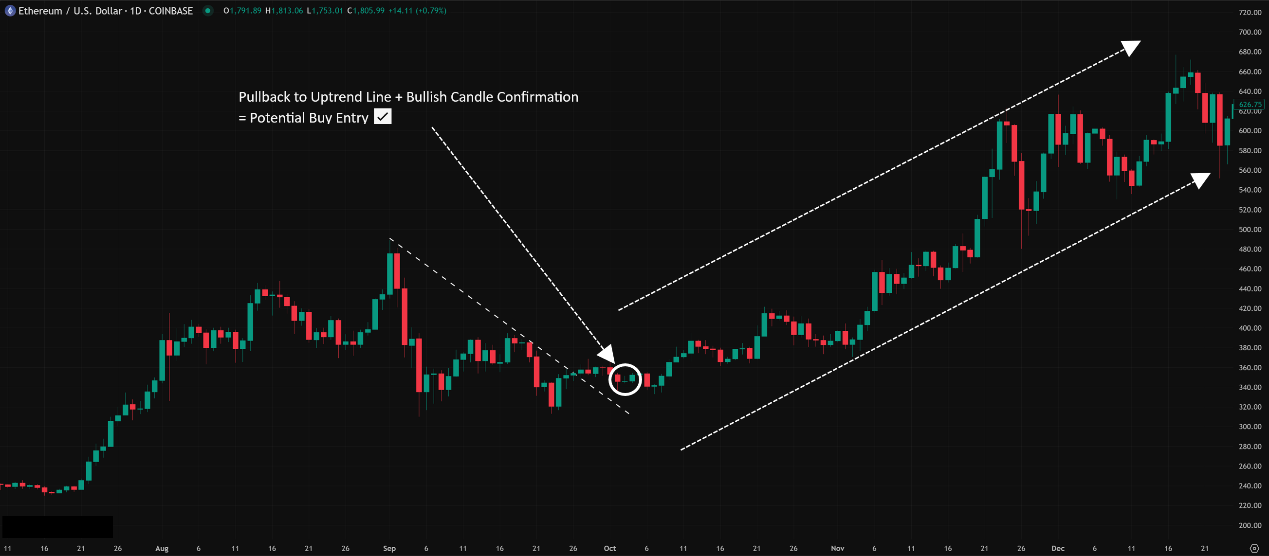
Entry Points with the Trend:
Uptrend: When price pulls back near the ascending trendline and shows a bullish reversal candlestick signal (e.g., Hammer, Bullish Engulfing), it’s a potential buy opportunity.
Downtrend: When price rallies near the descending trendline and shows a bearish reversal candlestick signal (e.g., Shooting Star, Bearish Engulfing), it’s a potential short sell opportunity.
Core Idea: Use the trendline as dynamic support/resistance to find entries in the direction of the prevailing trend.
Gauging Trend Sustainability:
As long as price continues to respect the trendline (stays above an uptrend line / below a downtrend line, reacts upon touching it), the original trend is considered valid.
The more times a trendline is tested and holds, the more significant and reliable it generally becomes.
「Buying on Uptrend Line Pullback」
Trendline Breakout: Major Potential Trend Change Signal!
The Core Signal: When price closes decisively beyond a well-established and confirmed trendline, it’s often a significant signal that the trend may be reversing or changing!
Breaking Below an Uptrend Line: ⚠️ Strong warning! The uptrend might be over; potential shift to sideways or downtrend.
Breaking Above a Downtrend Line: ✅ Strong signal! The downtrend might be over; potential shift to sideways or uptrend.
Confirmation! Confirmation! Confirmation!
Close is Key: Price piercing the line intraday doesn’t count. Look for a candle close on the other side.
Magnitude Matters: The further price closes beyond the line, the better. Some use ATR multiples or fixed percentages as filters.
Volume Confirmation: A breakout accompanied by a significant increase in volume is much more reliable!
Retest Confirmation (Golden Setup!): Just like with Pivot Highs/Lows, a retest of the broken trendline is a prime opportunity! Price breaks out, pulls back to test the old trendline (now acting as new S/R), and if it holds, it’s a high-probability entry point.
「Downtrend Line Breakout & Retest Confirmation」
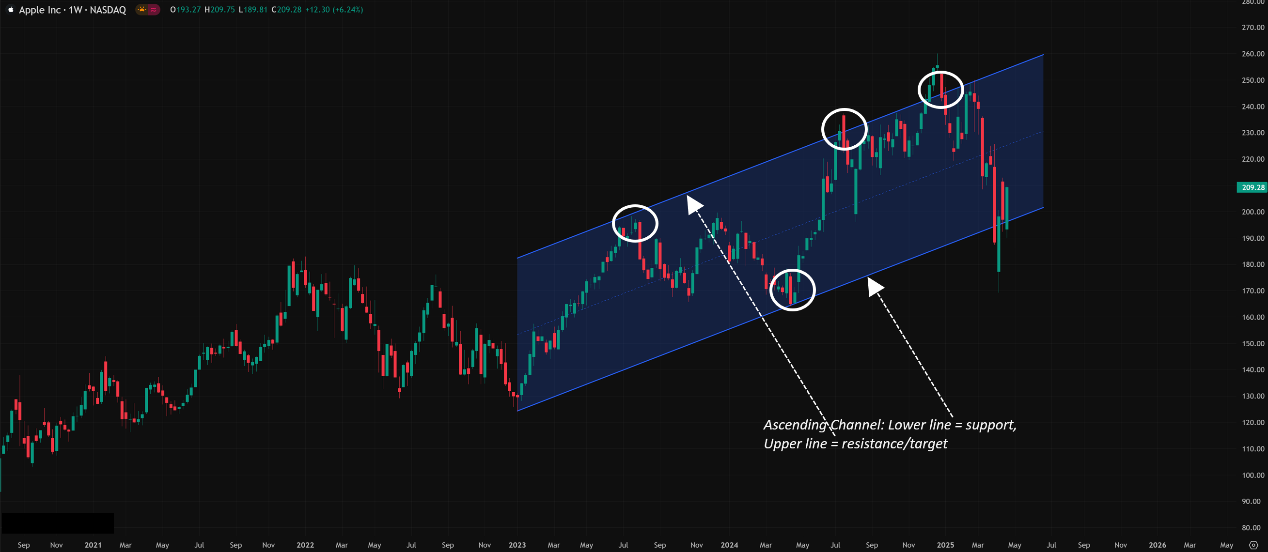
2. Channel Lines: Drawing Parallel Trajectories
How to Draw: Once you have a valid uptrend line (connecting lows), you can draw a parallel line starting from a significant Swing High within the trend, placing it above the price action. For a downtrend, draw the main line connecting highs, then draw the parallel line from a significant Swing Low below price.
How to Use:
These two parallel lines form a Trend Channel.
When price respects the channel, the lower line acts as support/buy zones, and the upper line acts as resistance/take-profit zones (in an uptrend).
Channel Breakouts: Price breaking above the upper channel line might signal trend acceleration or an exhaustion climax; breaking below the lower channel line signals trend weakness.
「Ascending Trend Channel」
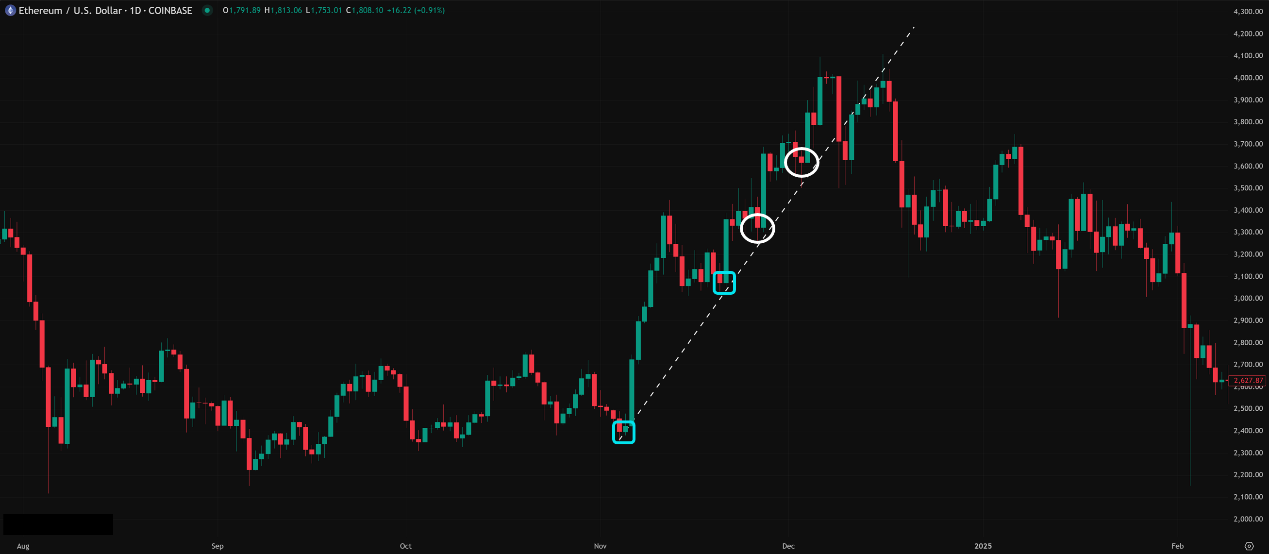
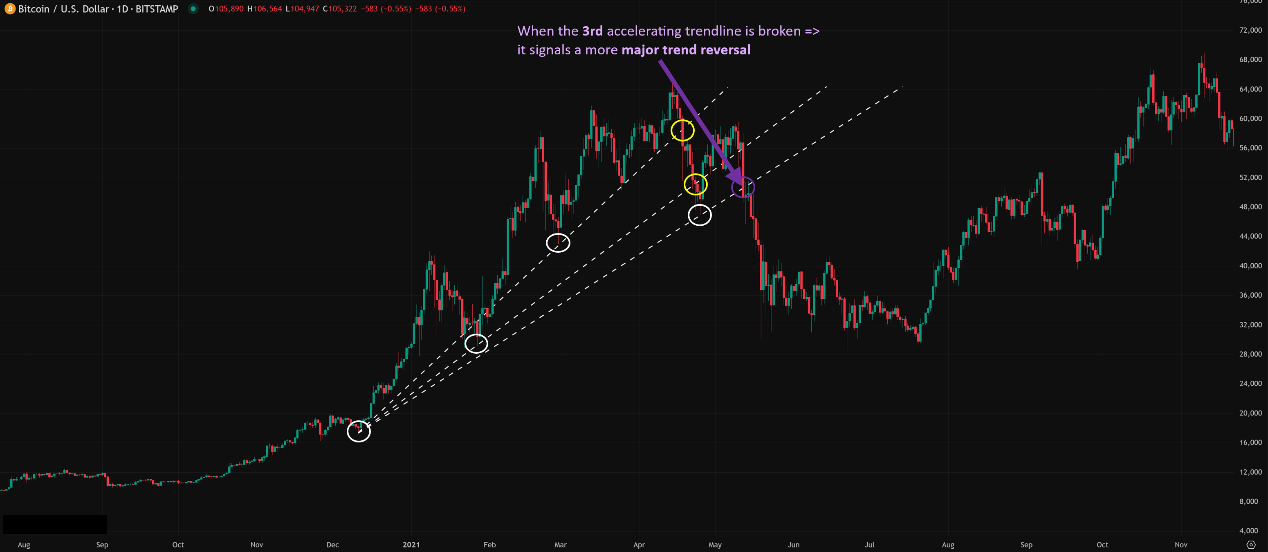
3. Trend Acceleration & Fan Principle:
Sometimes trends speed up (slope gets steeper), breaking the original trendline.
How to Use: When the first trendline breaks, you might draw a new, steeper trendline from a more recent low (uptrend) or high (downtrend). If this new line also breaks, you might draw a third…
Fan Principle: Often, when the third such accelerating trendline is broken, it signals a more major trend reversal.
Effectiveness: Helps identify trend acceleration phases and potential exhaustion points.
「Uptrend (Fan) Line Breakout」
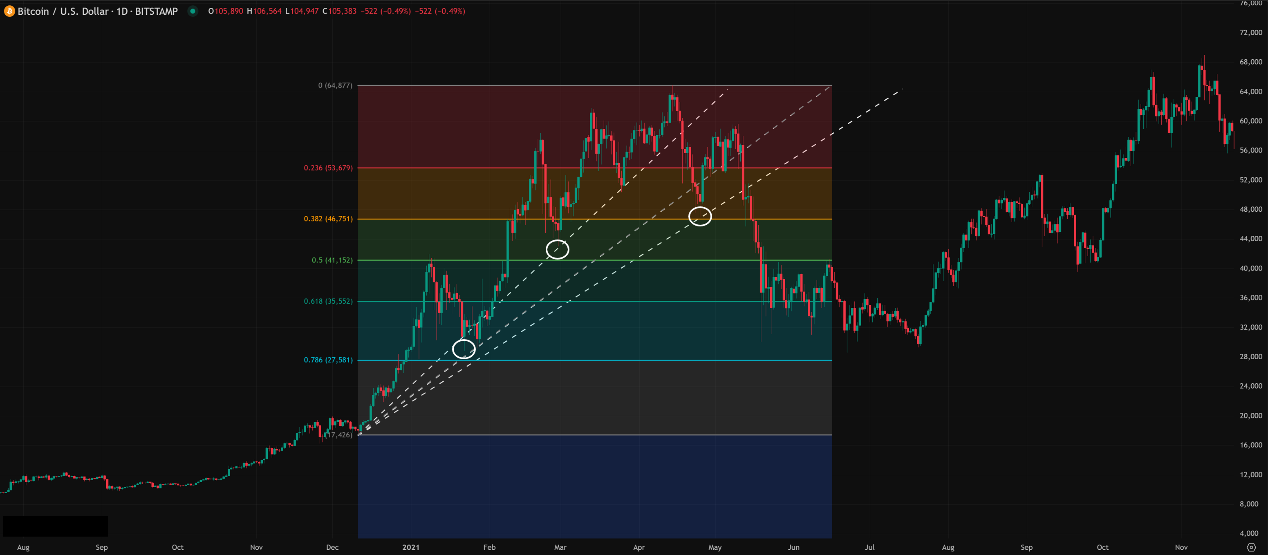
4. Power of Confluence:
Trendline + Other S/R = Golden Opportunity!
Look for Confluence:
Ascending trendline + Fibo support level?
Descending trendline + Pivot Point R1?
Trendline + Horizontal S/R zone?
Trendline + Key Moving Average?
Candlestick signals occurring at these zones where multiple forces align are the highest quality setups you should focus on!
「The Confluencing Power of the Uptrend Line and the Fibonacci Retracement」
Trendlines Have NO Parameters! They are manually drawn!
The Real “Parameters” are Your Drawing Skill & Criteria:
Which points do you connect? (The subjective part, like Fibo/Pitchfork)
Wicks or Bodies? (Be consistent!)
Minimum touches for confirmation? (At least 2, 3+ is better)
Angle/Slope? (Too steep might be unsustainable, too flat might be weak trend)
Duration & Number of Tests? (Longer-standing, more tested lines are more significant)
Timeframe:
Works on ALL timeframes.
Higher Timeframe (D1, W1, MN) trendlines are FAR more significant! They represent major trend structures, and breaks are major events!
Lower timeframe (M15, H1) trendlines offer short-term guidance but break more easily.
MTF Analysis: Using higher TF trendlines for direction and lower TF trendlines for entry/exit timing is standard practice.
Which Combos Are “Hot” & Effective? (Hottest & Effective Setups)
Trendline power comes from its fundamental nature and versatility. Effective use relies on good drawing skills and strategic integration.
Core Setup 1: Trendline Touch + Candle Confirmation + (Confluence Bonus)
Execution: Wait for price to pull back/rally to a well-validated (3+ touches) primary trendline, ideally where other S/R converges. Enter on a clear reversal candlestick pattern.
Effectiveness: One of the most classic and widely used trend-following entry methods.
Core Setup 2: Trendline Break + Retest Confirmation + Volume Confirmation
Execution: Wait for a decisive close beyond a significant trendline, preferably with increased volume. Then patiently wait for price to retest the broken trendline (as new S/R). Enter in the direction of the break after the retest holds.
Effectiveness: A relatively robust strategy for entering on trend reversals or continuation breakouts. Also, when you’re planning to trade a trendline breakout, you need to keep a close eye on the market’s Swing Lows and Lower Lows. Check if the line connecting these points is starting to flatten out or look more horizontal. If it is, that usually means the breakout is likely to be stronger and more significant.
Core Setup 3: Channel Trading
Execution: Draw the trend channel. Look for confirmed buys near the lower rail and sells/take-profits near the upper rail. Watch for channel breakouts.
Effectiveness: Works well in orderly, channeled market conditions.
Best Parameter Combos? (Optimal “Drawing” Practices)
NO Parameters!
Best “Drawing” Principles:
Connect at least two points, three or more is better.
Choose “significant” swing points, filter minor noise (Zig Zag can help ideation).
Be consistent with wick vs. body usage.
Line should ideally not be cut by candle bodies.
Higher timeframes are more significant.
Review and redraw regularly as trends evolve.
Conclusion: Drawing a good trendline is far more important than searching for secret parameters! Skill comes from practice and observation!
The Bottom Line: Trendlines – Your Steering Wheel & Guardrails

Trendlines are the most fundamental, yet indispensable, tools in the technical analysis toolbox. They are simple, intuitive, and incredibly versatile.
They help you:
Clearly define and visualize trend direction.
Provide dynamic support and resistance references.
Identify high-probability trend-following entry points.
Signal potential trend breakouts and reversals.
Construct channels to gauge price range.
Act as a crucial element in confluence analysis.
For all young traders wanting to get a sense of market direction and master the flow, regardless of the asset or timeframe, learning how to properly draw and interpret trendlines is a core survival skill you absolutely must master!
Remember:
Trendlines are manually drawn; practice makes perfect.
Three+ touches make them more reliable.
Be consistent in your drawing method.
Higher timeframes matter more.
Breakouts need confirmation! Retests are golden!
Confluence is power!
Trends change, be ready to adjust.
Alright! Hope this comprehensive guide to trendlines helps you appreciate the power of this simple line! Grab your “drawing tools” and start mapping out the trends on your charts! See ya next time! Follow the trend, respect the line! ✍️