Physical Address
304 North Cardinal St.
Dorchester Center, MA 02124
Physical Address
304 North Cardinal St.
Dorchester Center, MA 02124
Okay Okay! What’s up, Market Wizards and Crypto Jedis! Time for another upgrade to our technical analysis toolkit! After covering VPFR (where you pick the range) and VPSV (the daily automatic one), today we’re unlocking the member of the Volume Profile family that’s arguably the most instantaneous, the most “What You See Is What You Get” – say hello to Volume Profile Visible Range (VPVR)!
Ever find manually drawing ranges for VPFR a bit tedious? Or feel like VPSV updating only daily isn’t quite fast enough? VPVR is awesome! It automatically analyzes all the candles currently visible on your chart screen and instantly draws the volume profile! As soon as you Zoom In/Out or Scroll Left/Right, the profile updates immediately! It’s like having a portable market X-ray, always showing you the “hot spots” in the price action right in front of you!
Wanna know how to use VPVR to quickly spot the most relevant Support/Resistance right now? How to observe the shifting focus of the market in real-time? How to combine this dynamic indicator with other analysis for maximum impact? Alright! Pay attention, because we’re about to do a full deep dive into VPVR! Let’s see what’s visible!
VPVR’s emergence is a natural extension of Volume Profile technology, designed to meet the demand for real-time analysis.
Part of the Volume Profile Family: Like VPFR and VPSV, VPVR originates from the concepts of Market Profile® and the advancement of volume analysis. They all aim to shift volume analysis from the time axis to the price axis.
Solving a Pain Point: Immediacy and Convenience! VPFR requires manual selection, which takes effort; VPSV is automatic but segmented by fixed sessions (like daily), which might not reflect the specific range of candles you’re currently focused on. VPVR perfectly solves this: whatever price action you bring onto your screen, VPVR automatically calculates the profile for exactly that view!
Design Philosophy: “What You See Is What You Get” (WYSIWYG) – VPVR’s core is analyzing the current Visible Range. What’s displayed on your chart is what it analyzes. This immediate feedback loop is its defining characteristic.
Purpose: Providing a Snapshot of the Current View’s Volume Structure – VPVR gives traders a quick way to understand the volume distribution structure corresponding precisely to the price action currently on their screen, instantly identifying the most relevant POC, VA, HVNs, and LVNs for that specific view.
So, VPVR was designed to provide an extremely convenient, rapidly responsive tool, allowing traders to see the market’s volume focus and potential S/R levels instantly for whatever range they are currently looking at.
VPVR’s calculation logic is fundamentally the same as VPFR/VPSV’s – mapping volume to price levels – but its data source range is dynamic.
Step One: Automatically Identify the “Visible Range”
This is the biggest difference between VPVR and other VP indicators. You do not manually select the range.
The indicator automatically detects the first candle to the last candle currently displayed on your computer or phone screen. This visible span of candles becomes its data source.
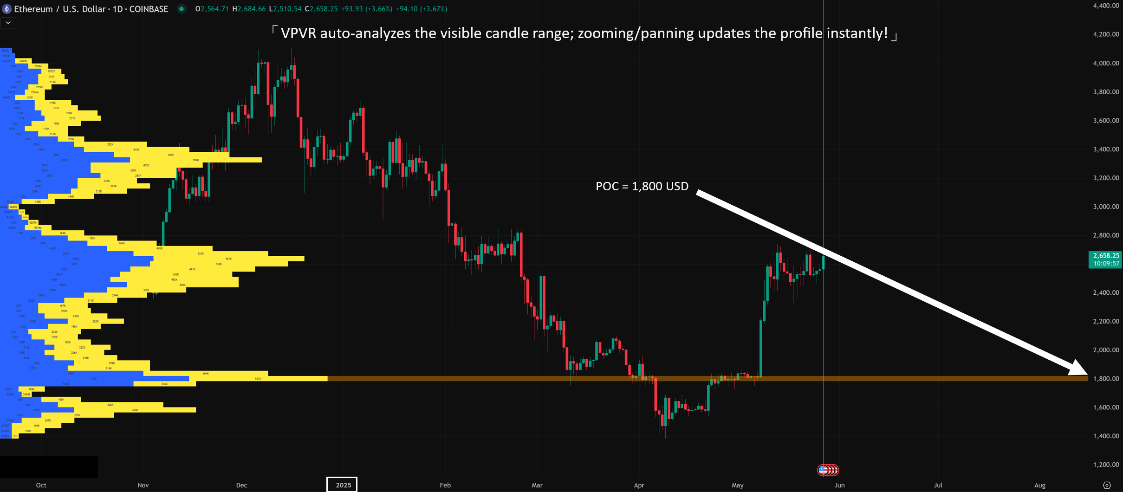
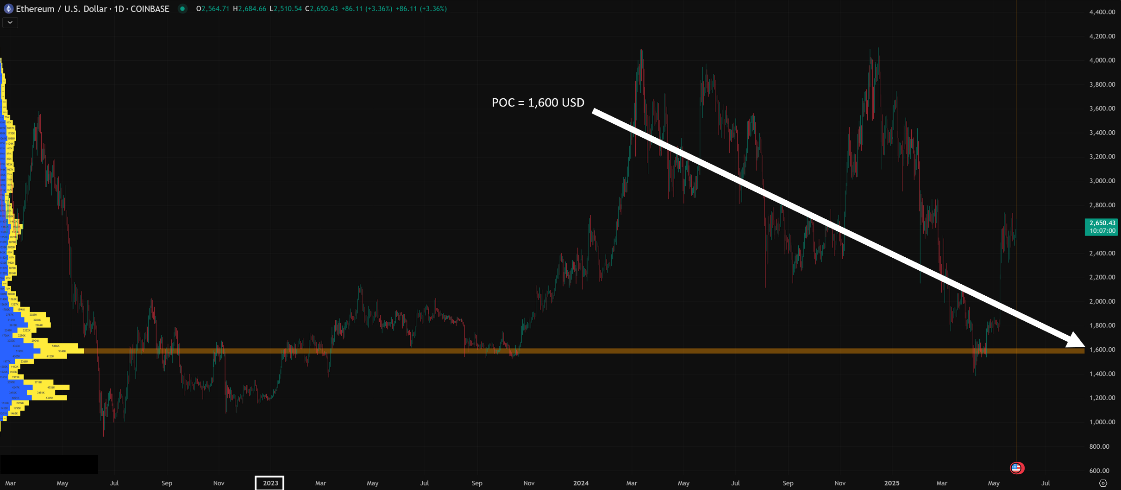
Crucially: When you zoom in/out or scroll left/right on your chart, changing the visible range of candles, VPVR automatically recalculates!
Steps Two through Five: Similar Calculation Process to VPFR/VPSV
The indicator takes all the candle data within the visible range.
Calculates the volume traded at different price levels within each of those candles.
Aggregates the total volume at each price level across the entire visible range.
Draws the horizontal volume histogram on the side of the chart, corresponding to the current visible range.
Calculates and displays the POC, VA (VAH/VAL), HVNs, and LVNs based on the current visible range.
The Final Result: You see a single Volume Profile histogram on the right (or left) of your chart, corresponding precisely to the candles currently visible on your screen. This profile dynamically updates as you navigate the chart.
Think of Google Maps’ “Nearby Places” Feature:
VPVR is like Google Maps. You zoom into a specific neighborhood (Zoom In), and it shows the restaurants and shops in that view (POC, HVNs).
You zoom out to the whole city (Zoom Out), and it shows major landmarks and highways (different POC, HVNs).
You pan the map (Scroll), and the “nearby places” displayed change accordingly. VPVR reflects the volume structure of “whatever chunk of the chart you’re looking at” in real-time.
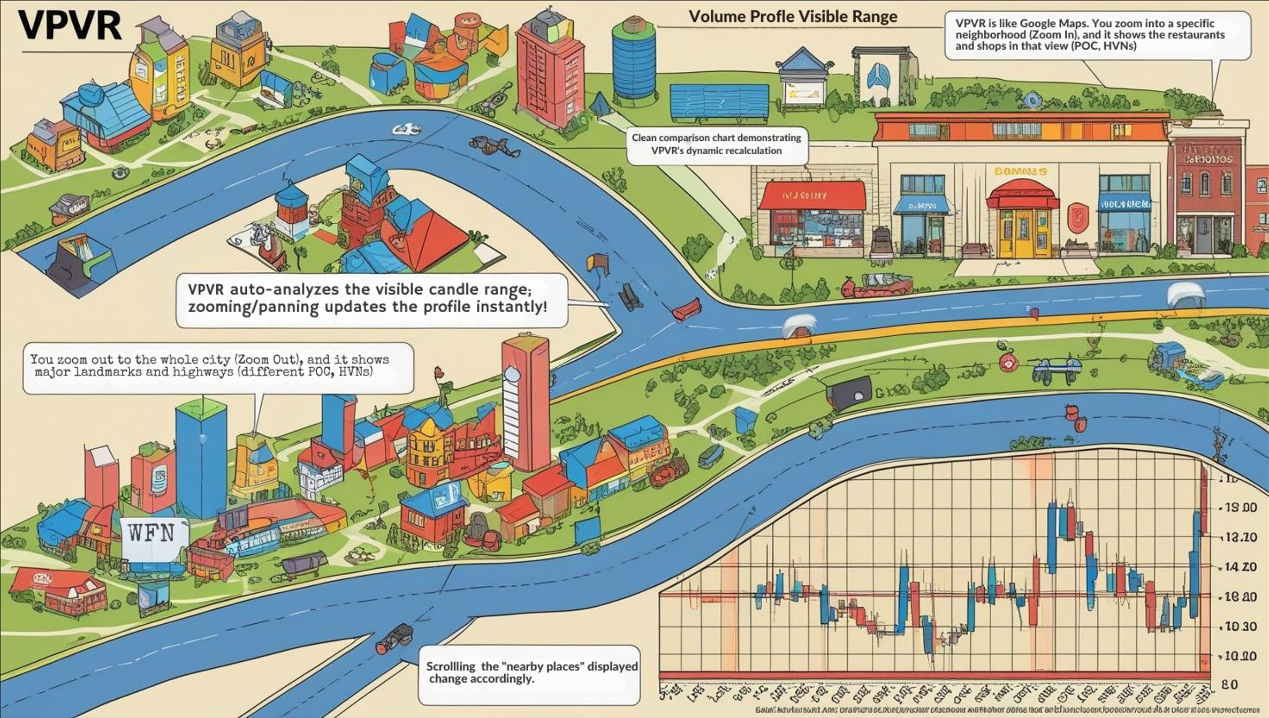
「VPVR Dynamic Update Illustrated」
Due to its dynamic nature, VPVR usage emphasizes immediacy and relativity.
Level 1: Basic Usage – Instant Key Level Snapshot
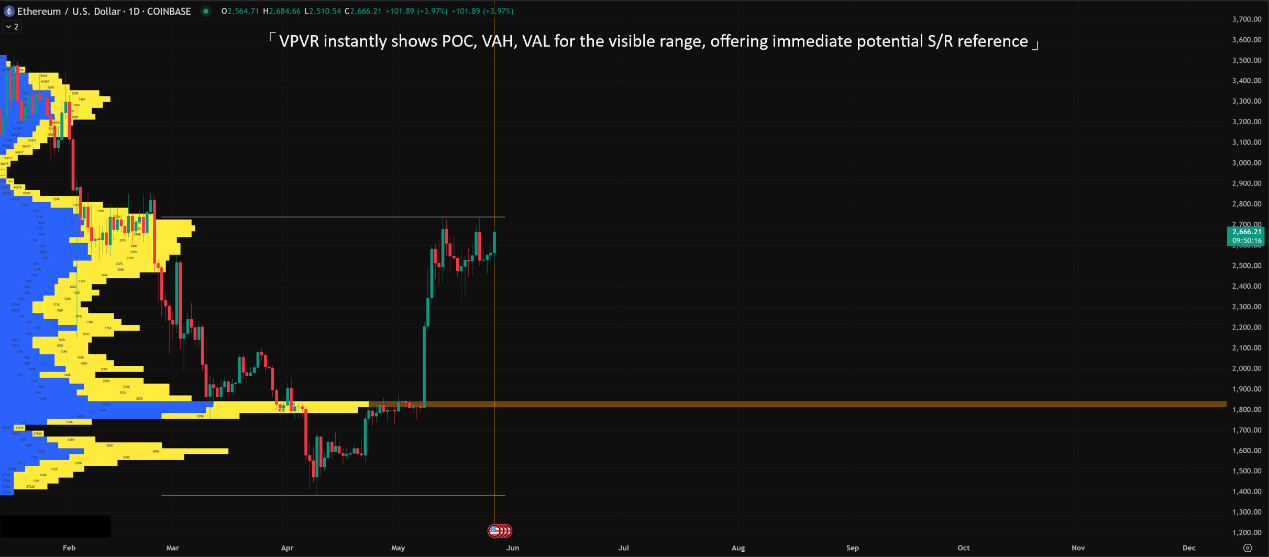
Quickly Identify Current S/R:
Open your chart, and VPVR immediately shows you where the most volume traded (POC) and the value area (VAH/VAL) are within the current screen view.
These levels can serve as important S/R references for immediate trading decisions. For instance, if you’re scalping, you can quickly see if the price is approaching the POC of the currently visible range.
How to Use: Similar to basic VPFR S/R usage, but remember these levels are based on the visible range and will change as you move the chart.
Understand Current Market Structure:
A quick glance at the VPVR shape (Is it a balanced D-shape? Or a skewed P/b-shape?) can give you an initial read on the market state reflected by the price action currently on screen.
For example, if you zoom into a recent small consolidation, VPVR should show a relatively clear D-shape for that zoomed-in view.
「Using VPVR for Quick Current S/R」
Level 2: Advanced Plays – Observing Dynamic Changes & Cross-Range Analysis
VPVR’s advanced usage lies in understanding its dynamic nature and how to combine information from different views.
A. Watching Real-time Migration of POC/VA:
The Play: Keep a relatively fixed zoom level on your chart. As time progresses, new candles enter the visible range, and old ones exit. Observe how the VPVR’s POC and VA shift in response.
Interpretation:
POC/VA Steadily Moving Up: Even with price fluctuations, if the focus of high volume activity consistently shifts higher as new data comes in, it confirms short-term buying pressure remains dominant.
POC/VA Steadily Moving Down: Confirms short-term selling pressure is dominant.
POC/VA Chopping Around within a Range: Indicates short-term balance or indecision.
Effectiveness: Compared to the daily updates of VPSV, VPVR provides near real-time feedback on shifting market focus, which is especially valuable for short-term traders.
B. Combining Different Zoom Levels (Multi-Timeframe Perspective):
The Play:
First, Zoom Out to a larger timeframe view (e.g., several months or a year) to observe the macro VPVR structure. Identify the long-term, significant HVNs and LVNs – these are the “major battlefields.”
Then, Zoom In to the most recent price action (e.g., the last few days or weeks) to observe the micro VPVR structure.
Compare: How do the short-term POC/VA relate to the long-term HVNs/LVNs? Is the short-term price consolidating within a long-term HVN? Is the short-term POC migrating towards a long-term LVN?
Effectiveness: Combines macro and micro volume distribution insights for more comprehensive decision-making. Long-term levels provide context; short-term levels provide timing.
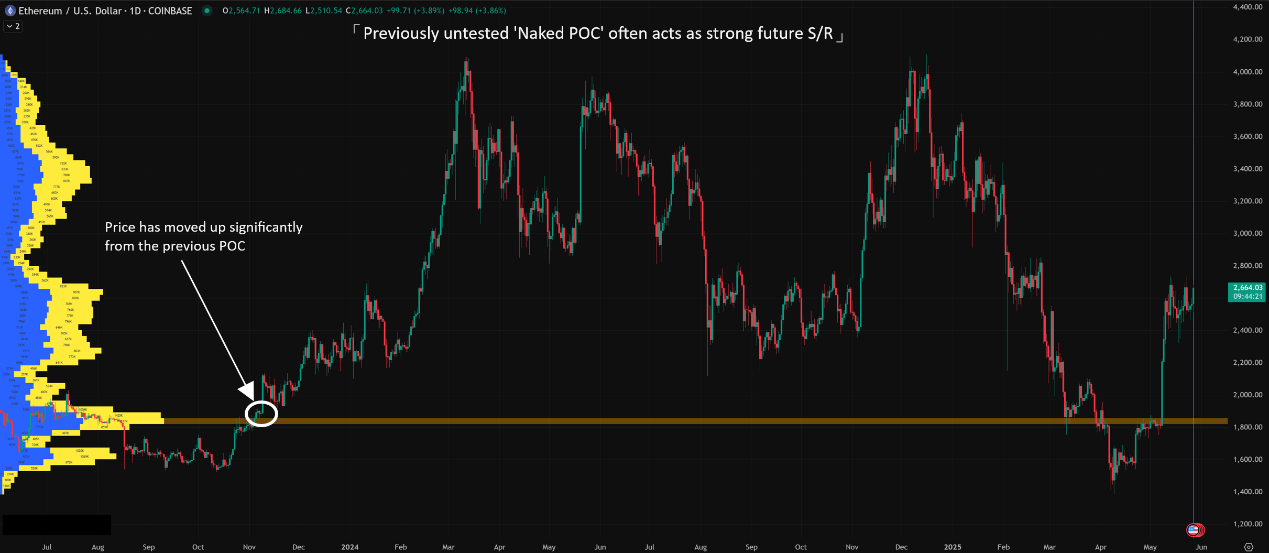
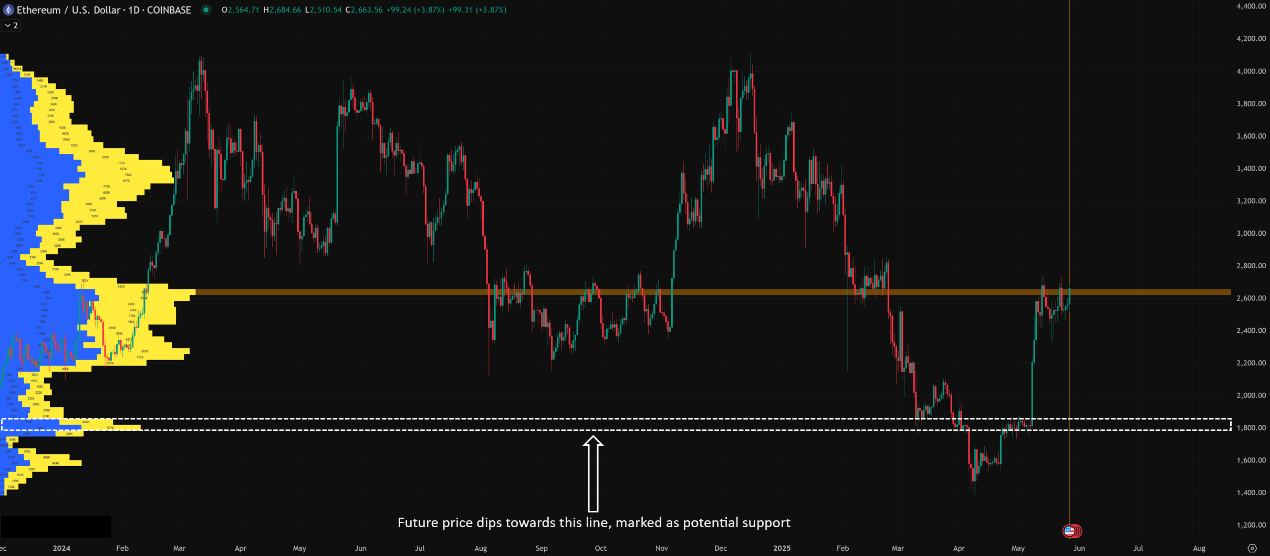
C. Identifying “Naked POC/VA” (Strong Magnet Zones):
Definition: When price moves decisively away from a previously formed significant POC or VA range, if these levels are not subsequently retested by price as you scroll forward, they become “Naked” levels.
Principle: Markets tend to revisit areas of prior high volume activity to “complete business” or confirm breakouts.
How to Use:
As you scroll through the chart history (causing old profiles to disappear from the VPVR view), mentally note or manually mark significant POCs or VAH/VALs that price left behind without retesting.
When price eventually approaches these “Naked” levels in the future, they often act as very strong magnetic zones and potential reversal points (S/R).
Effectiveness: This is a more advanced but highly effective technique using historical volume data to anticipate future key levels. Many professional traders monitor these levels.
「”Naked POC” Concept Explained」
D. Parameter Settings & Time Intervals (The Truth About VPVR Settings)
Core “Parameter”: The Visible Range! How you zoom and scroll the chart directly determines what VPVR analyzes. This is user interaction, not an indicator setting.
Internal Parameters (Same as VPFR/VPSV):
Number of Rows / Row Size: Affects visual resolution. Using the platform’s default or Auto setting is usually best. Not something beginners need to stress over.
Value Area Percent: 70% is standard; sticking to the default is recommended.
Chart Timeframe:
The timeframe of your chart affects the granularity of the underlying data used for VPVR calculation. VPVR on an M15 chart will be more detailed than VPVR on a D1 chart (viewing the same date range).
Which Timeframe? Depends on your trading style and goal:
Scalpers/Short-term Day Traders: Might watch VPVR on M1, M5, M15 for immediate S/R levels, observing rapid changes.
Day Traders/Short-term Swing Traders: Might use M30, H1, H4, combining real-time VPVR with Naked levels and different zoom perspectives.
Swing/Position Traders: Might use D1, W1. Zoom out for macro VPVR structure first, then zoom in on recent action with VPVR to find entries aligned with the big picture.
E. Which Combos Are “Hot” & Effective? (Effective VPVR Workflows)
VPVR’s effectiveness comes not from specific “parameter combos” but from your observation skills, analytical workflow, and how you combine it with other tools.
Hottest Workflow 1: Dynamic Intraday S/R Trading
Execution: Primarily on M15 or H1 charts. Continuously monitor the automatically updated POC, VAH, VAL from VPVR. When price tests these immediate levels, look for confirming candlestick patterns (Pin Bars, Engulfing) to take short-term counter-trend (fade) or pro-trend (break-retest) trades.
Effect: Provides extremely responsive short-term trading signals.
Hottest Workflow 2: Multi-Timeframe VP Analysis
Execution:
Start on D1 or W1, zoom out, use VPVR to identify the major long-term HVNs/LVNs (the “macro map”).
Switch to H1 or H4, zoom in on recent action, use VPVR to see the short-term POC/VA (the “tactical map”).
Combine: Look for high-probability setups where short-term price pulls back to a long-term HVN, and the short-term VPVR shows signs of support or a new POC forming there.
Effect: Integrates long-term context with short-term timing for higher probability trades.
Hottest Workflow 3: Naked Level Strategy
Execution:
Periodically scan chart history, marking significant but untested “Naked POCs/VAH/VALs.”
Set price alerts for when price approaches these levels.
When price nears a Naked Level, closely observe price action and candle patterns for potential reversal trades.
Effect: Leverages market “memory” to identify high-probability reversal zones.
F. Best Parameter Combos? (VPVR Parameter Takeaway)
Internal Parameters (Rows, VA%): Seriously, don’t sweat it. Use the defaults! Unless you’re an advanced user with a complete, tested system for why you’d change them.
Key Parameter: Your “Eyes” and “Hands”! How you control the chart’s Visible Range. That’s what determines what VPVR analyzes.
Conclusion: VPVR isn’t a ‘set and forget’ indicator. It’s a tool that requires active interaction, observation, and combining different perspectives!
Volume Profile Visible Range (VPVR) is the most flexible and responsive member of the Volume Profile family. It gives you a dynamic window to observe:
The most relevant trading levels (POC) and value areas (VA) for your current view.
Instantly updated potential support and resistance.
Real-time shifts in market focus as price evolves.
It helps you:
Quickly grasp the current market structure.
Reference immediate S/R levels for short-term trading.
Perform multi-timeframe analysis by combining different views.
Utilize “Naked Levels” to anticipate potential turning points.
For young traders who need rapid feedback or want a real-time understanding of the market’s volume structure, VPVR is an incredibly responsive and informative ally!
Remember:
VPVR analyzes the visible range; it’s dynamic.
POC, VA, HVN, LVN meanings are the same, but apply to the current view.
Zooming and panning are part of using VPVR effectively.
Use default internal parameters; focus on observation and interpretation.
Naked Levels are an advanced technique worth studying.
Combine with Price Action and broader market analysis!
Alright! Hope this ultimate guide to VPVR helps you master this dynamic tool! Load it up on your favorite charting platform (like TradingView) and start experiencing its real-time insights! See ya! Keep adapting, keep winning!