Alright, all you slick traders surfing the market waves, Crypto gold diggers, and young warriors seeking that trading Alpha! Today, we’re unlocking an indicator that’s critically important in the Day Trading world, especially in the eyes of institutional players – VWAP (Volume Weighted Average Price)! This isn’t your average moving average; it’s the boss-level average cost line that factors in the “power” (volume)! Wanna know where the “smart money” is playing? VWAP gives you clues!
What the heck is VWAP? Why do Day Traders and Big Players Care So Much?
VWAP’s name spills the beans: Volume Weighted. The biggest difference between it and SMA/EMA is:
- SMA/EMA: Only consider the average of price itself.
- VWAP: Calculates the price of each trade multiplied by its volume, then divides by the total volume for that period.
Simply put: Prices traded with higher volume have a bigger impact on the VWAP! It represents the “average cost” where market participants (including institutions) traded within a specific timeframe (usually one day), factoring in which price levels saw the most action and force!
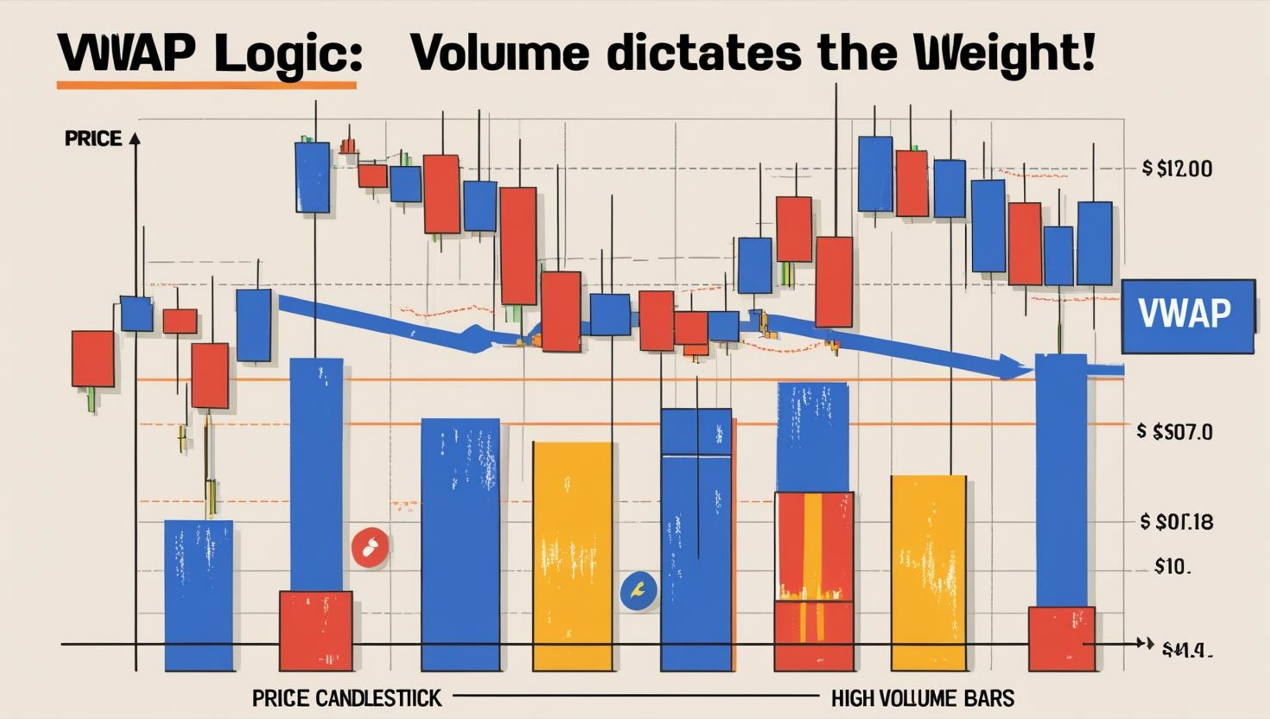
「VWAP Logic: Volume Dictates the Weight!」
Why is it a big deal?
- Institutional Benchmark: Many funds and large institutions use VWAP to evaluate their trade execution efficiency. Their goal is often to buy below VWAP and sell above VWAP. Therefore, the VWAP level frequently becomes a battleground for big money.
- True Average Price: Compared to price-only MAs, VWAP better reflects the “fair market value” or “center of gravity” for the day, incorporating trading volume.
- Intraday Focus: VWAP’s most crucial characteristic is that it typically resets daily! It starts calculating from zero at the market open, making it primarily an Intraday Trading indicator.
VWAP’s Origin Story & Design: Tracking the “Smart Money” Footprints
The concept of VWAP arose from the need for a fairer price benchmark that better reflected actual market activity, especially for institutions executing large orders. If their buy orders pushed the price up significantly, a price-only average would be distorted. By incorporating volume, VWAP provides a better picture of their “average entry/exit cost.”
- Design Goals:
- Measure Trade Execution Quality: Help institutions gauge if they got a “good price.”
- Provide Intraday Value Reference: See if the current price is expensive or cheap relative to the volume-weighted average.
- Identify Potential Support/Resistance: The VWAP line itself can act as dynamic intraday S/R.
- Calculation Core:
- VWAP = Sum (Typical Price * Volume) / Sum (Total Volume)
- “Typical Price” is often (High + Low + Close) / 3, though some platforms might use Close or (High + Low) / 2.
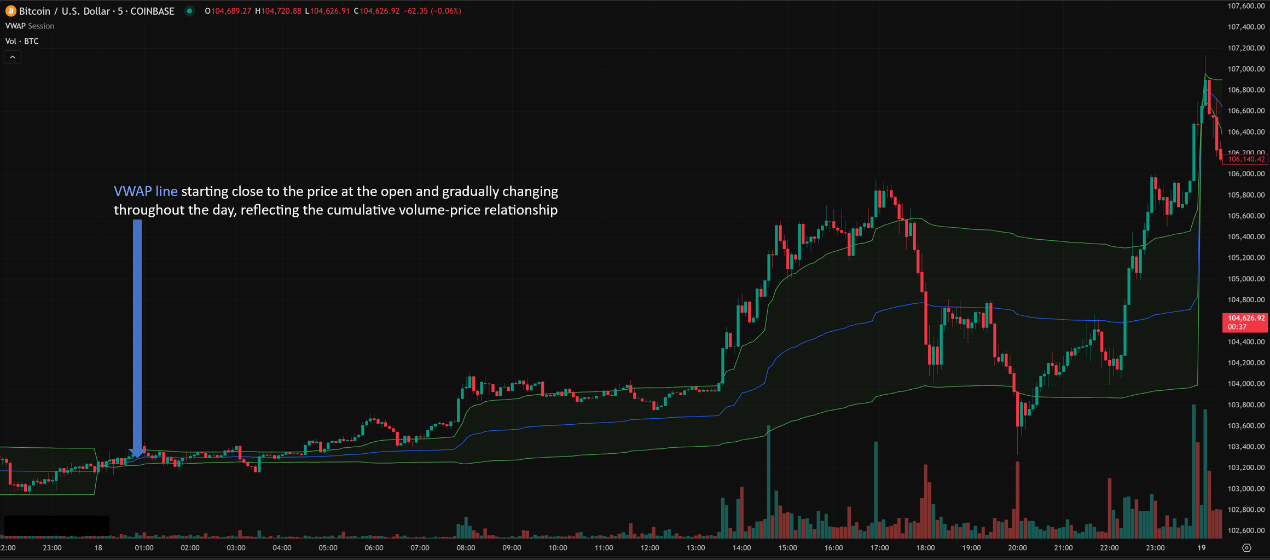
- Crucially, it’s cumulative: Starting from the first minute of the session, it sums up (Price * Volume) for each period (e.g., minute) and divides by the cumulative total volume. So the line evolves throughout the trading day.
- Daily Reset: At the start of the next trading day, everything resets to zero! This is the key difference from standard MAs.
「VWAP’s Cumulative Calculation & Daily Reset Feature」
VWAP Basic Plays (Day Trader Fundamentals):
VWAP is primarily used on intraday charts (e.g., 1-min, 5-min, 15-min, 30-min, 1-hour).
- Judging Intraday Trend Bias:
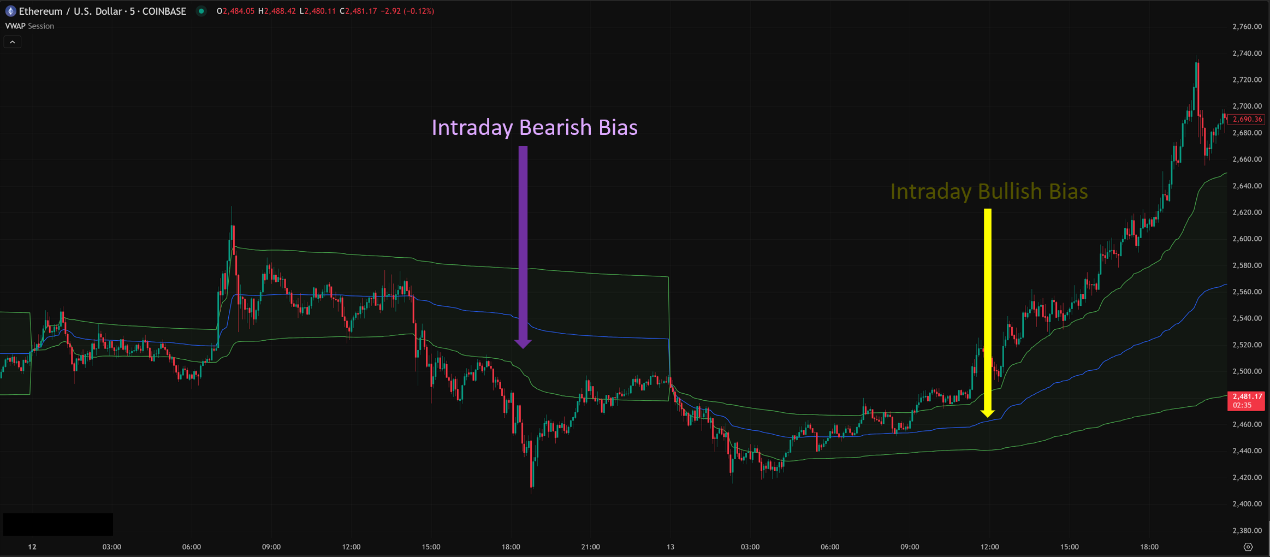
- Price consistently trading above the VWAP line → Intraday bullish bias, VWAP might act as support.
- Price consistently trading below the VWAP line → Intraday bearish bias, VWAP might act as resistance.
- Price chopping back and forth across VWAP → Intraday likely ranging/consolidating, direction unclear.
「VWAP & Price Location: Gauging Intraday Strength」
2. Dynamic Intraday Support & Resistance (S/R):
-
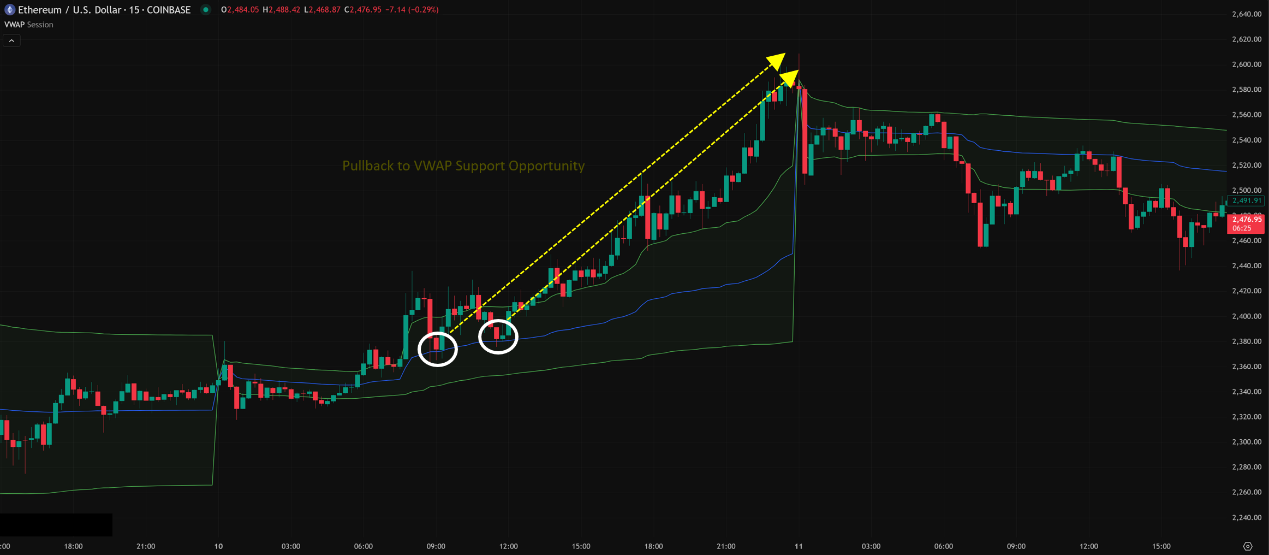
- In an uptrend: Price pulls back towards VWAP. If it finds support (e.g., bullish candle pattern, volume confirmation), it could be a Potential Long Entry Zone.
- In a downtrend: Price rallies towards VWAP. If it meets resistance (e.g., bearish candle pattern, volume confirmation), it could be a Potential Short Entry Zone.
- Magnet Effect: VWAP sometimes acts like a magnet, pulling price back towards it after significant deviations.
「VWAP as Dynamic Intraday Support/Resistance」
3. Assessing Trade Quality (“Fair Value”):
-
- If you’re buying, getting filled below VWAP is generally considered a “good price.”
- If you’re selling, getting filled above VWAP is generally considered a “good price.”
- This is how institutions often think. Retail traders can use it to judge if their entry is relatively advantageous.
VWAP Advanced Plays & Parameter/Timeframe Breakdown (Pro Insights):
Advanced VWAP play isn’t about changing its “period” (because standard VWAP is session-based), but about how you use it and its variations.
Parameter Settings: Standard VWAP Has No Period, But Anchors & Bands!
- Standard VWAP (Session VWAP):
- No Period Parameter! Its calculation period is the fixed trading session, most commonly Daily. Starts at the open, ends at the close (or resets at the next day’s open).
- Some platforms might offer:
- Weekly VWAP: Calculates from Monday open to Friday close.
- Monthly VWAP: Calculates from the start to the end of the month.
- N-Day VWAP (Rolling VWAP – Less Common): This acts more like an MA, calculating VWAP over the past N days. It loses the session-specific volume context and isn’t standard usage.
- VWAP Standard Deviation Bands:
- This is the most common advanced VWAP combo! Adds bands plotted 1, 2, or even 3 standard deviations above and below the VWAP line.
- Logic: Standard deviation measures price volatility relative to VWAP. Price hitting the bands means it has deviated significantly from the average.
- Parameter: You set the standard deviation multiplier (e.g., 1, 2, 3). Default is often 1 or 2.
- How to Use:
- Mean Reversion: Price hitting an upper band (e.g., +2 SD) might be overbought, potentially reverting to VWAP. Hitting a lower band (e.g., -2 SD) might be oversold, potentially bouncing back to VWAP. This strategy works better in ranging markets!
- Trend Breakout/Continuation: In strong trending markets, price might “ride the bands” (stay near the upper/lower band) or even break through them. A breakout and hold above an upper band (+1 or +2 SD) can signal strong bullish continuation; breaking and staying below a lower band (-1 or -2 SD) can signal strong bearish continuation.
- Anchored VWAP (AVWAP):
- This is a very popular VWAP variation popularized by technical analyst Brian Shannon.
- Logic: Instead of automatically resetting daily, you can manually select any candle on the chart (the Anchor Point) as the starting point for the VWAP calculation!
- Anchor Point Selection: Usually chosen based on significant events or price points:
- Major Swing Highs/Lows
- Earnings Dates
- Major News Event Dates
- Breakout/Breakdown Candles from key levels
- Parameter: Your choice of anchor point is the parameter!
- How to Use: See how the average volume-weighted price has evolved since that specific key moment. Anchored VWAP can provide significant dynamic S/R levels spanning multiple days. For example, drawing an AVWAP from a major bottom might show key support on subsequent pullbacks.
「Anchored VWAP: User-Defined Volume-Weighted Trendline」
Timeframe Analysis:
- Standard VWAP (Session VWAP):
- Main Playground: Intraday Charts (M1, M5, M15, H1). Shorter periods make VWAP react faster and hug price tighter. M1 is very sensitive, H1 relatively smoother.
- Daily Charts or Higher: Basically Meaningless! Because it resets daily, on a daily chart, you’d just see a line connecting the closing VWAP values for each day, losing all the intraday volume dynamics.
- VWAP Bands: Same as standard VWAP, primarily for intraday charts.
- Anchored VWAP (AVWAP):
- Extremely Flexible! Can be used on ANY timeframe!
- Short-Term Charts (e.g., M15, H1): Anchor from the day’s open, significant intraday high/low, or a volume breakout candle to see short-term S/R.
- Daily/Weekly Charts: Anchor from historical swing highs/lows, earnings dates, trend turning points to identify mid-to-long-term volume-weighted support/resistance. This is where AVWAP really shines!
Summary: Which Unique Parameter Combo/Timeframe is Hottest & Most Effective? How to Use It?
- Parameters:
- Standard VWAP → No parameters, understand its daily reset.
- VWAP Bands → StDev Multiplier (e.g., 1, 2) is the key. Use 1 or 2 depending if your strategy targets early or extreme deviations.
- Anchored VWAP → Your choice of anchor point is the “parameter”! Picking meaningful anchors is crucial.
- Timeframe:
- Standard VWAP/Bands → Intraday charts (M1-H1) rule.
- Anchored VWAP → All timeframes are applicable!
- Hottest / Most Effective Usage:
- Core Intraday Strategy (Standard VWAP + Bands):
-
- Time: M5 / M15 charts often provide a good balance.
- Strategy: Combine VWAP as trend bias/S&R reference + use +/- 1 or 2 SD Bands to find mean reversion opportunities (in ranges) or trend continuation/breakout setups (in trends). Market context is critical!
2. Event-Driven / Swing Analysis (Anchored VWAP):
-
- Time: H4 / Daily / Weekly charts.
- Strategy: Anchor AVWAP from key highs/lows, earnings, breakouts. Treat it as a dynamic trendline/S&R level with volume significance. Price testing the AVWAP (from above in uptrends, below in downtrends) is a key observation point.
- Example (Crypto): Anchor an AVWAP from Bitcoin’s last halving date and see how price interacts with that line over time.
- Combo: Plot multiple AVWAPs from different significant anchors to create a potential web of S/R zones.
VWAP: Not Magic, But a Window into Institutional Thinking
VWAP is a unique and powerful tool, especially for intraday trading and understanding the market’s “center of gravity.” Its strengths:
- Includes Volume Data, making it more “real” than price-only MAs.
- Widely Used by Institutions, providing potentially significant S/R levels.
- Anchored VWAP offers extreme flexibility.
But know its limitations:
- Primarily Intraday (Standard VWAP): Less directly useful for long-term swing traders (unless using AVWAP).
- Lagging: Still based on past data.
- Less Meaningful in Low Volume Markets/Periods: Like holidays or lunch hours.
- Not a Standalone System: Needs to be used with price action, patterns, other indicators.
「VWAP: Decoding Intraday Volume-Price Dynamics & Institutional Flow」
Mastering VWAP and its variations gives you “X-ray vision” into the story behind the volume. Adding it to your analysis framework, especially if you day trade or want to pinpoint key turning points, is definitely worth it!
Next Steps:
- Add the VWAP indicator to your platform; note if it’s the standard daily reset version.
- Try adding VWAP Standard Deviation Bands (1x and 2x).
- Dive deep into Anchored VWAP! Find significant dates/price points to anchor from and observe the results.
- Observe VWAP’s S/R behavior on different intraday timeframes (M5, M15, H1).
- Backtest! Especially strategies involving VWAP Bands and Anchored VWAP.
May you decipher the volume secrets and level up your trading game!📈🚀