Alright, all you Market Jedis, Crypto elites, and slick traders chasing that max tech level! After breaking down a bunch of heavy hitters, today we’re digging into a member of the Moving Average (MA) family that’s kinda low-key but marches to its own beat – the WMA (Weighted Moving Average)! It’s not as popular as the EMA, nor as chill as the SMA, so what’s its deal? Does it have any unique plays? Let’s deep dive right now!
What’s the WMA? How’s it related to SMA / EMA?
WMA is another type of moving average, aiming to smooth out price and help us spot trends. Think of its relationship with the big dogs like this:
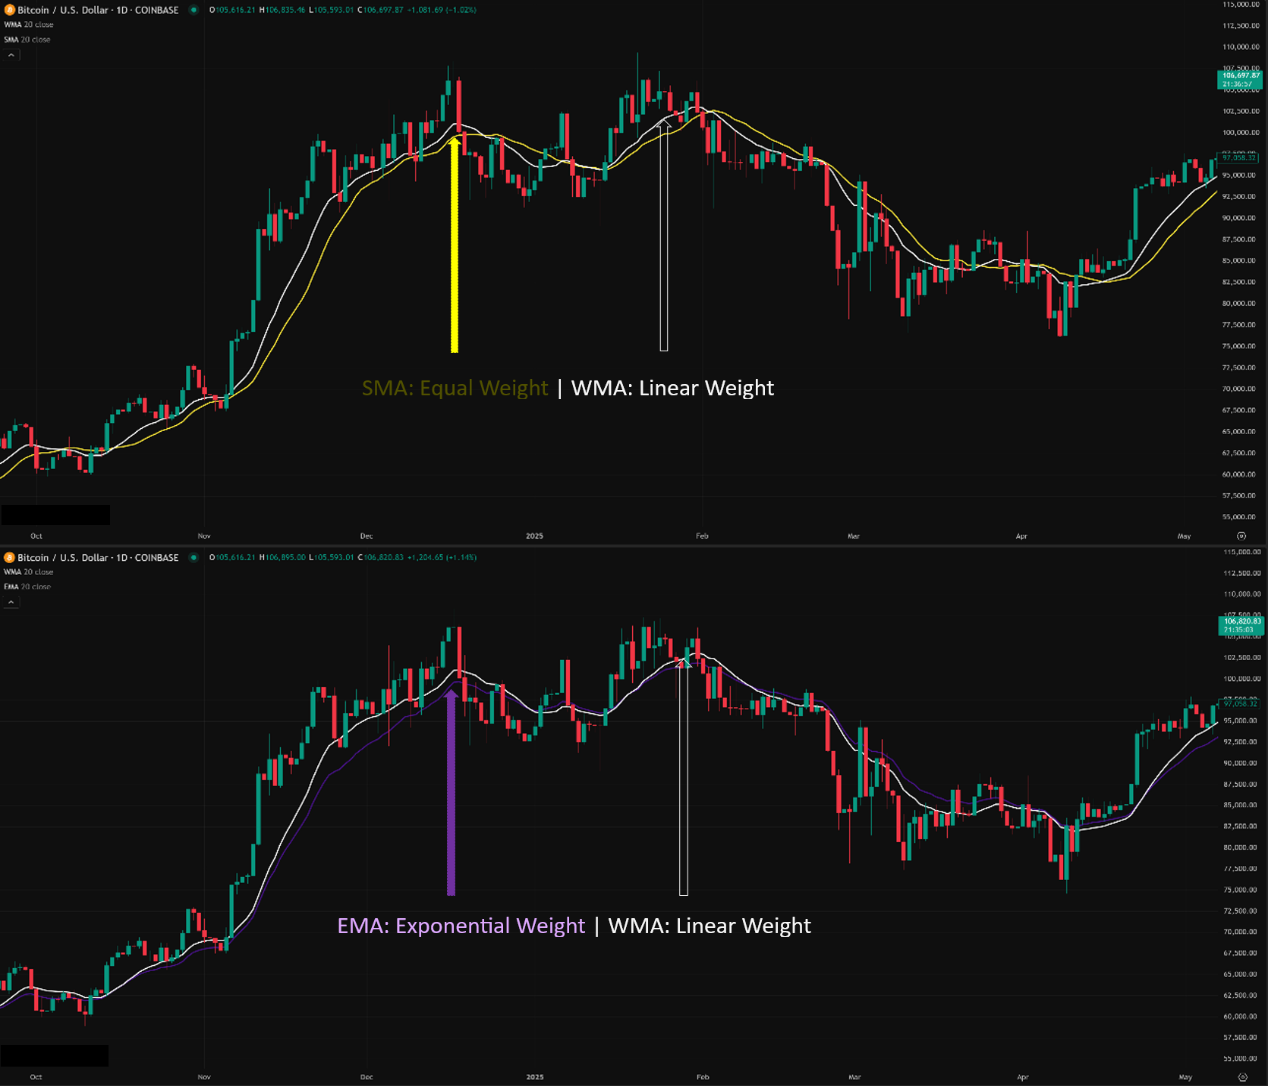
- SMA (Simple Moving Average): The old reliable, treats all data equally, fair and square, but slow to react.
- EMA (Exponential Moving Average): The cool kid, heavily favors recent data (weights decrease exponentially), reacts fast, the market favorite.
- WMA (Weighted Moving Average): The specialist, also favors recent data, but its weighting decreases linearly. Meaning, the newest data point gets the highest weight, the second newest gets the next highest, and so on, like a queue. The further back, the lower the weight.
「MA Family Showdown: WMA’s Position」
Why Does WMA Exist? What’s its Design Philosophy?
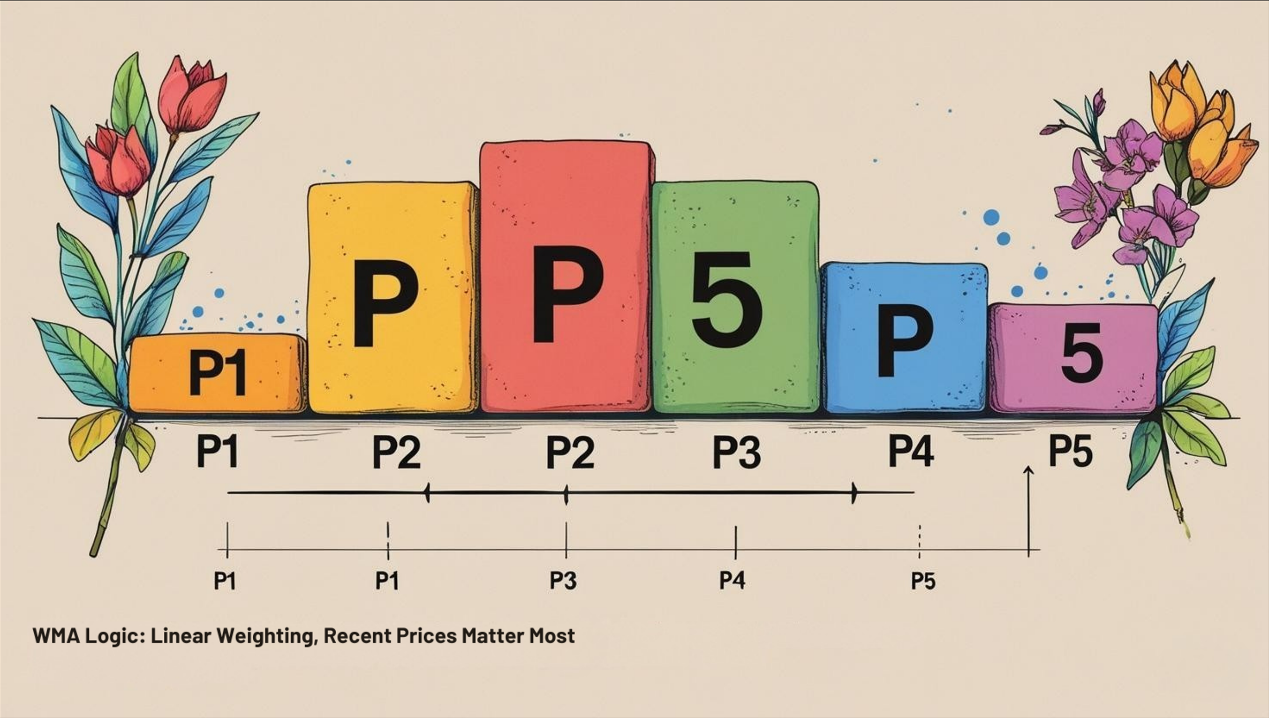
Like EMA, WMA emerged to tackle the SMA’s lag problem. Analysts thought, “Recent prices gotta matter more than prices from N days ago!” But EMA uses exponential weighting, which is slightly more complex conceptually (though instant for computers). WMA offered another weighting approach: linear weighting.
- Linear Weighting: Imagine calculating a 10-period WMA. The latest closing price gets a weight of 10, the second latest gets 9, down to the 10th price getting a weight of 1. You multiply each price by its weight, sum them up, then divide by the total weight (1+2+…+10 = 55).
- Design Goals:
- Prioritize Recent Data: Same goal as EMA, making the MA react faster to price changes.
- Relatively Simple Concept: Linear decrease is easier to grasp than exponential.
- Offer Another Perspective: Different weighting might perform differently in various market conditions.
「WMA Logic: Linear Weighting, Recent Prices Matter Most」
WMA Basic Plays (Beginner’s Course):
WMA’s basic uses are similar to other MAs, but remember it’s typically faster than SMA and close in speed to EMA (sometimes potentially faster, but maybe also spikier).
- Spotting Direction (Trend Direction):
- WMA sloping up, price above WMA → Bullish bias.
- WMA sloping down, price below WMA → Bearish bias.
- WMA flat → Ranging / Trend unclear.
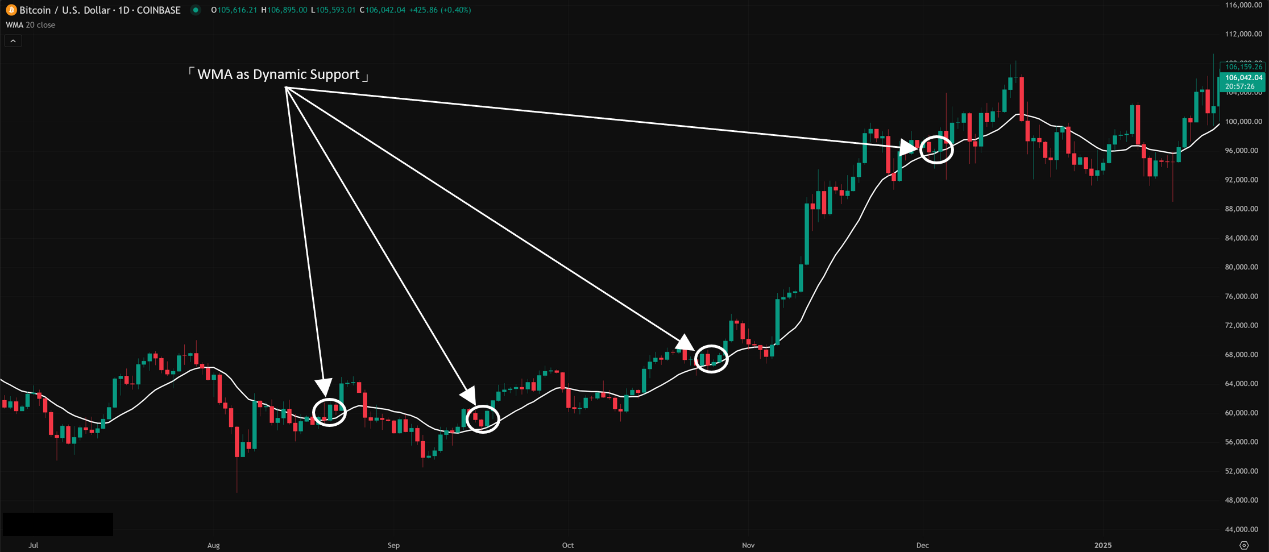
- Dynamic Support & Resistance (Dynamic S/R):
- In an uptrend, price pulling back near the WMA might find support.
- In a downtrend, price rallying near the WMA might face resistance.
- Note: Because WMA reacts quickly, the S/R it provides might be less solid than SMA’s and potentially easier to pierce than EMA’s.
「WMA’s Dynamic Support/Resistance Role」
3. Crossover Signals:
-
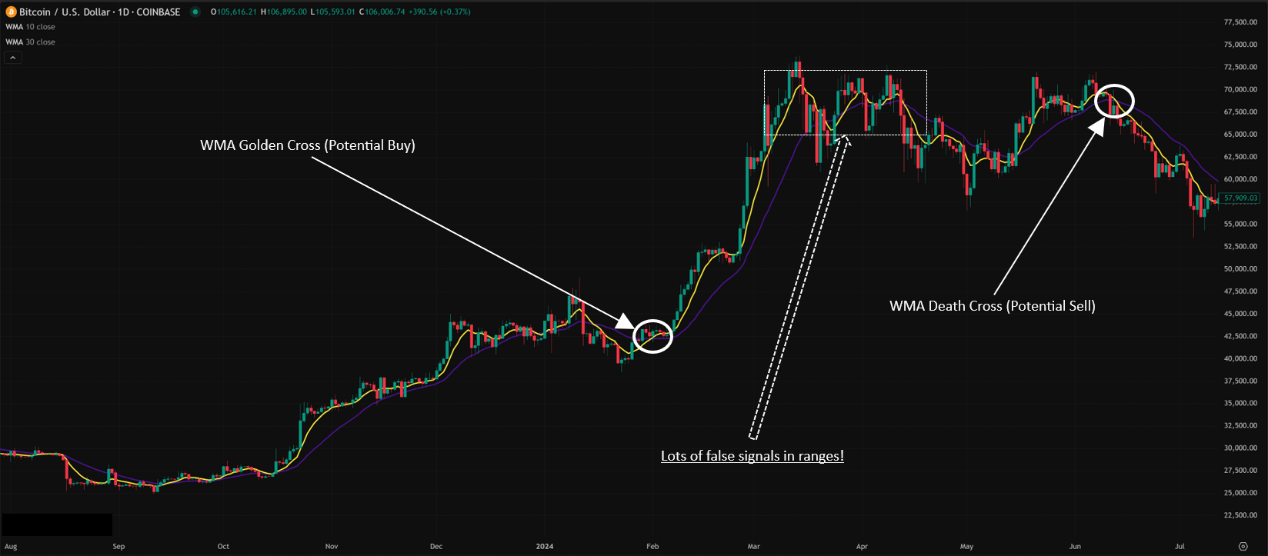
- Fast/Slow Line Cross: E.g., using a 10 WMA (fast) and 30 WMA (slow).
- Fast line crosses above slow line → Potential Buy signal (Golden Cross concept).
- Fast line crosses below slow line → Potential Sell signal (Death Cross concept).
- Price Crossing WMA:
- Price breaks above WMA from below → Short-term bullish.
- Price breaks below WMA from above → Short-term bearish.
- The Trap: WMA’s speed means it generates TONS of false crossover signals in ranging markets! Never trade crosses alone!
「WMA Crossover Signals (Needs Confirmation)」
WMA Advanced Plays & Parameter/Timeframe Breakdown (Pro Insights):
In advanced applications, WMA gets far less discussion than EMA or Ichimoku. There isn’t a widely known “unique” WMA parameter combo or strategy. Often, traders view WMA and EMA as interchangeable “fast MA” options, with the final choice boiling down to personal preference and backtesting results.
Core Parameter: Period / Length
- Like all MAs, the period (N) is WMA’s only standard parameter.
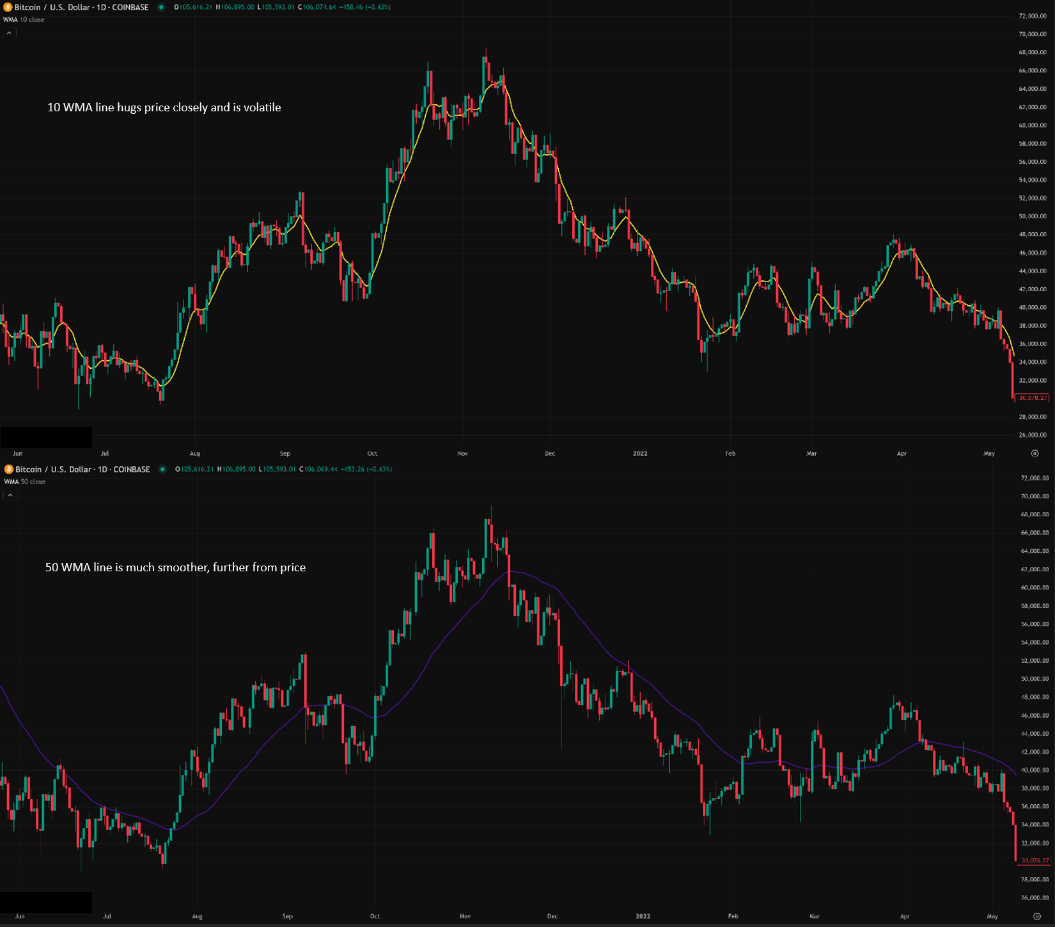
- Shorter Period (e.g., 5, 10, 20): WMA is faster, hugs price closer, more sensitive.
- Pros: Catches short-term turns quickly.
- Cons: Extremely noisy, frequent false signals, performs poorly in ranges.
- Longer Period (e.g., 50, 100, 200): WMA is slower, smoother.
- Pros: Filters more noise, better reflects mid-to-long-term trends.
- Cons: Increased lag, signals appear much later.
「WMA Period Impact: Short = Fast+Noisy vs. Long = Slow+Smooth」
Parameter Settings Analysis & “Hottest” Combo Discussion:
- There’s NO “Hottest” WMA Combo! Unlike Ichimoku (9,26,52) or Supertrend (10,3), WMA lacks a near “cult-status” default combo.
- Common Usage = Mimicking EMA/SMA Combos:
- Traders might use WMA periods similar to their favorite EMA/SMA setups, e.g.:
- Short-term Cross: 9 WMA vs. 21 WMA (like 9/21 EMA)
- Mid-term Trend/Cross: 20 WMA vs. 50 WMA (like 20/50 EMA/SMA)
- Long-term Trend: 50 WMA vs. 200 WMA (like 50/200 EMA/SMA)
- So Why Use WMA Instead of EMA/SMA Directly?
- Reason 1: Personal Preference / Test Results. A trader might find, after extensive backtesting on their specific market/timeframe, that WMA’s linear weighting performs slightly better than EMA’s exponential weighting (e.g., slightly fewer false breaks, or tracks trends tighter).
- Reason 2: Chasing Ultimate Speed (Theoretically). In some calculations, WMA might react a fraction faster to the very latest price than an EMA of the same period (though the real-world difference might be negligible).
- Reason 3: Platform Differences / Habit.
- “Unique” Usage? Possibly Fine-Tuning the Period:
- Instead of specific combos, focus might be on fine-tuning a single WMA’s period to get the desired reaction speed. E.g., if your 20 EMA feels a bit slow for pullback support, you might test an 18 WMA or 22 WMA. But this requires tons of testing.
Timeframe Analysis:
- Ultra Short-Term (M1, M5, M15):
- Like all MAs, WMA is extremely noisy on these timeframes! Linear weighting makes it react very fast to the latest price, resulting in a line that whipsaws violently, generating countless false signals.
- Conclusion: Highly discouraged for beginners on these timeframes. Even pros need robust filtering mechanisms.
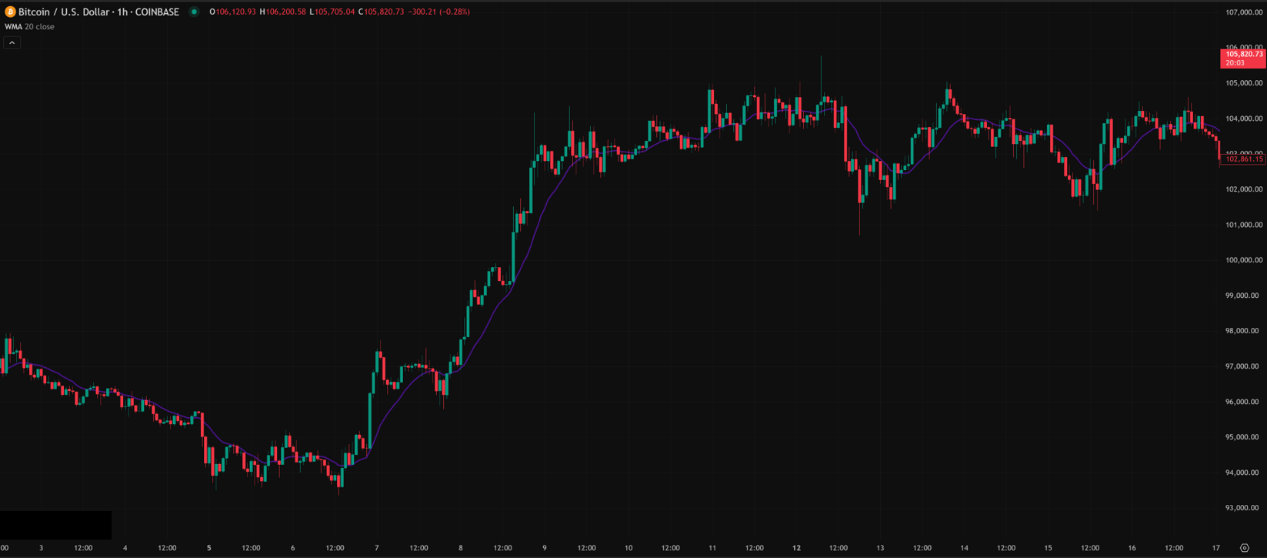
- Intraday / Short Swing (H1, H4):
- Starts having reference value, but be very careful! Especially in volatile crypto markets, WMAs (e.g., 20 WMA, 50 WMA) can help gauge short-term trend direction and potential S/R.
- How to Use:
- Judge price relative to WMA.
- Observe WMA slope.
- Use fast/slow WMA crosses as initial signals (need other confirmation).
- Key: Identifying ranging markets is crucial here! Signal value plummets in consolidation. Can combine with ADX (>25) to confirm trend strength.
「WMA on 1-Hour Chart: Useful in Trends, Whipsaws in Ranges」
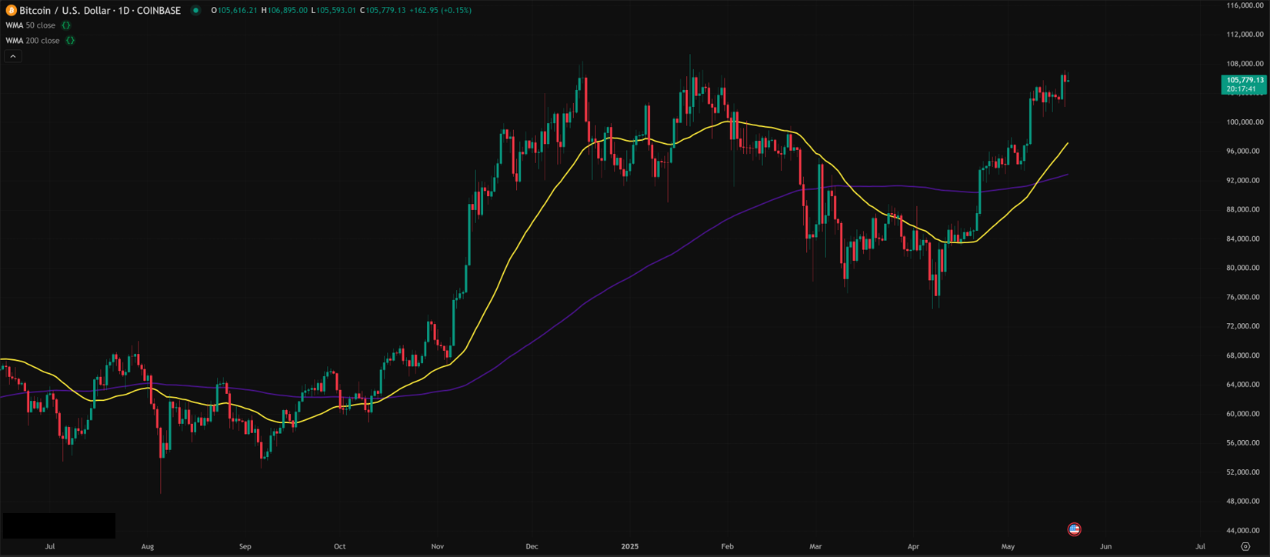
- Swing / Long-Term (Daily, Weekly):
- Relatively reliable. Similar to EMA/SMA, longer-period WMAs (e.g., 50, 100, 200 WMA) provide smoother trend guidance.
- How to Use:
- Gauge major trend (Price vs. Long-term WMA).
- Use 50/200 WMA crosses as reference for long-term shifts (lagging).
- Consider 50 WMA as dynamic mid-to-long-term S/R reference.
- Compared to EMA/SMA: On longer timeframes, the difference between WMA and EMA narrows, but WMA might still feel slightly “stiffer” (less smooth than EMA). Choosing depends more on visual preference and test results.
「Long-Term WMA (e.g., 50/200) for Major Trend Analysis」
Summary: Which Parameter Combo + Timeframe is Hottest & Most Effective? How to Use It?
- Parameters: No universally acclaimed “hottest” WMA combo. Most start with periods similar to common EMA/SMA usage (e.g., 9, 20, 50, 100, 200).
- Timeframe: Like other MAs, longer = more reliable. H4, Daily, Weekly perform relatively stable. H1 and below sees increased noise.
- Hottest / Most Effective Usage = Treat it as EMA’s “Sibling” / Alternative:
- Understand its Character: Faster than SMA, close to EMA speed but different weighting (Linear vs. Exponential).
- Apply Familiar MA Strategies: Trend following, S/R bounces, crossovers – test your existing EMA/SMA methods with WMA.
- Backtest Like Crazy! Since WMA lacks EMA’s “conventional wisdom,” testing becomes even more crucial! Compare WMA vs. EMA of the same period in your market. See which fits better.
- Always Combine with Other Tools: Volume, Price Action, RSI, MACD, S/R levels… WMA absolutely cannot be used alone!
- Beware of Ranging Markets! WMA might be even less resistant to chop than EMA.
WMA vs. EMA vs. SMA: How to Choose?
| Feature |
SMA (Simple) |
EMA (Exponential) |
WMA (Weighted) |
| Weighting |
Equal |
Exponential (Recent Bias) |
Linear (Recent Bias) |
| Speed |
Slow |
Medium/Fast |
Medium/Fast (Maybe faster/spikier) |
| Smoothness |
High |
Medium |
Medium/Low |
| Lag |
High |
Medium |
Medium |
| Popularity |
High (Long-term/Ref) |
Very High (All-rounder) |
Low |
| Pros |
Stable, Less Noise |
Balances Speed/Smoothness |
Conceptually Simple, Fast |
| Cons |
Lagging |
Potential False Signals |
More False Signals, Less Used |
Reasons to potentially choose WMA:
- Your testing shows linear weighting works slightly better for your specific situation.
- You want an MA conceptually simpler than EMA but faster than SMA.
- You simply prefer its visual representation.
Bottom Line: WMA is the “Fast Linear” Option in the MA Family, But Maybe Not the First Choice
WMA offers a way to prioritize recent data with linear weighting, offering speed comparable to EMA. It can be used with all standard MA strategies.
But the reality is, it’s far less popular than EMA. Reasons might include:
- EMA’s exponential weighting is often considered a better model of market “memory decay.”
- EMA has more widely accepted standard uses and parameter combinations.
- WMA might be more prone to spikes and less smooth than EMA.
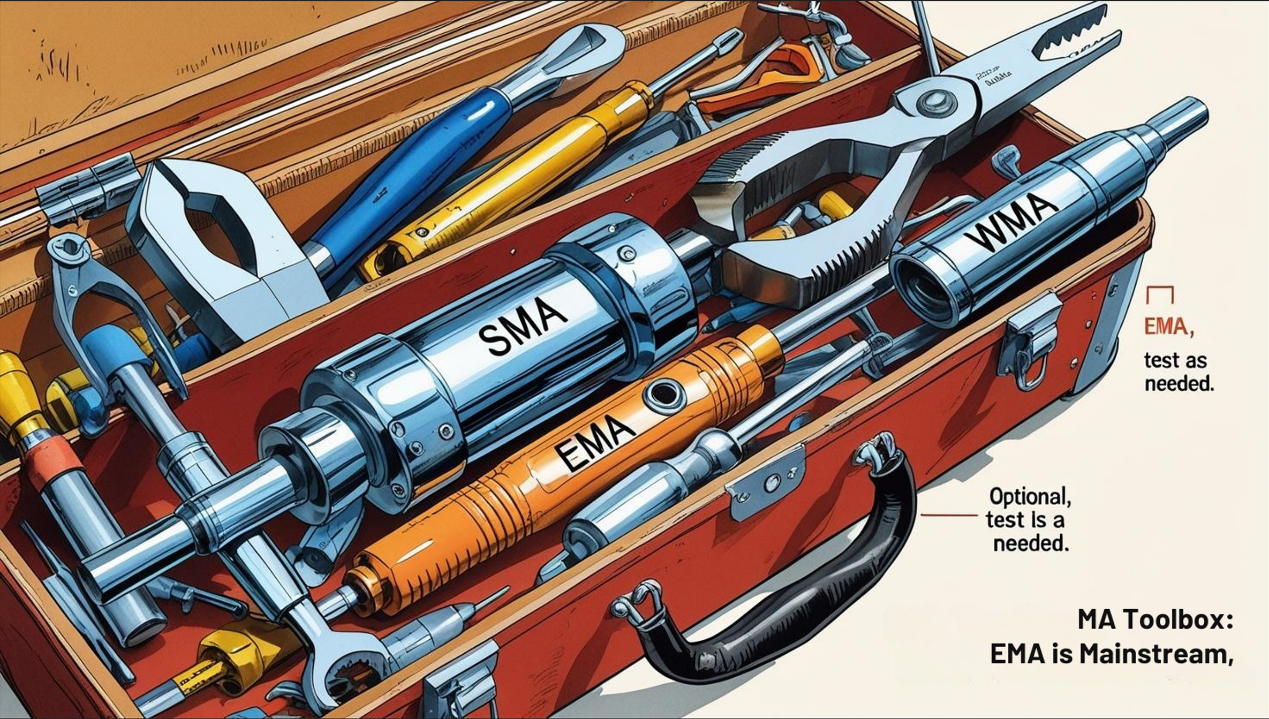
So, is learning WMA useful?
Yes! Understanding different MA types and weighting methods broadens your technical analysis knowledge. But does it need to be your primary weapon? Probably not. Keep it in your “lab” for occasional testing and comparison.
「MA Toolbox: Each Has Its Strengths, EMA is Mainstream」
Next Steps:
- Find the WMA indicator on your charting platform.
- Plot WMA alongside EMA and SMA of the same period to visually compare their lines.
- Backtest WMA (using common EMA/SMA periods) on the assets and timeframes you trade.
- Don’t expect WMA to be magic; treat it as another option to test.
Keep exploring, keep testing, keep learning! May your analysis journey continue to broaden! 💡👨💻