Physical Address
304 North Cardinal St.
Dorchester Center, MA 02124
Physical Address
304 North Cardinal St.
Dorchester Center, MA 02124
Yo! What’s good, Visual Traders and Chart Clarity Crew! Seeing spots before your eyes from all the chart noise? Constantly getting faked out by minor price wiggles? Wish you had a tool that could automatically filter out the noise and just focus on the major turning points? Today, we’re unlocking a “chart decluttering magic wand” designed exactly for that – let’s talk about the Zig Zag indicator! zigzag!〰️
That’s right, that jagged line connecting obvious highs and lows on your chart! It doesn’t predict the future, nor is it a traditional buy/sell signal indicator. BUT! It’s a super powerful visual aid that helps you:
See the main trend clearly: Filters out short-term chop, highlighting the major up and down waves.
Identify important swing points: Automatically marks key turning points for you.
Assist other analysis: Makes it easier to draw trendlines, spot patterns, or even apply Fibo or Elliott Wave analysis.
Wanna know how this “zig-zagging” line gets drawn? How to adjust its “sensitivity”? How to combine it with other tools for maximum effect? Okay! Let’s dive deep into how the Zig Zag indicator helps you “cut the crap” and see the market’s true “skeleton”! Let’s zig and zag!
Unlike many fundamental indicators with famous inventors, Zig Zag is more of a concept and tool developed over time by various traders and technical developers to solve the common problem of “chart clutter.”
Purpose: Filtering Market Noise – Price charts are full of minor, random fluctuations (“noise”) that often obscure our view of the main trend. The Zig Zag’s core purpose is to filter out these secondary wiggles and only display significant highs and lows after the price has reversed by a predetermined amount.
Conceptual Basis: Trend Definition – Its operational logic is similar to how Dow Theory defines trends, based on identifying sequences of highs and lows. Zig Zag attempts to algorithmize this identification process.
Visualization Tool: Its primary value lies in visually simplifying the chart, making the major price swings obvious at a glance. By connecting these pivots with straight lines, it helps clarify trend direction and potential patterns.
So, Zig Zag emerged to meet the trader’s need for quickly identifying major turning points and trend structure amidst complex price fluctuations. It’s a powerful chart “organizer.”
The core of Zig Zag is setting a “reversal criterion.” Only when the price retraces from a high or rallies from a low by at least this specified amount will it confirm a new Pivot High/Low and draw a straight line connecting the new pivot to the previous one.
Step One: Setting the Reversal Criteria
This is the most crucial part and where the main parameters lie. You need to define how much the price must move in the opposite direction to qualify as a “significant” turn.
There are usually two main parameter types:
Deviation / Depth (%): Set a percentage. For example, setting it to 5% means the price must fall at least 5% from a high, or rally at least 5% from a low, before a new pivot point is confirmed.
Points / Price: Set an absolute price point or amount. For example, setting it to 100 points means the price must reverse by at least 100 points to confirm a turn.
Some platforms might have a third parameter…
Step Two: Identifying Potential Pivots
The indicator continuously tracks price, identifying temporary peaks and troughs.
Step Three: Applying the Reversal Criteria
Let’s say the current trend is up, and the indicator identifies a potential peak. It then monitors how far the price falls from that peak.
IF the pullback distance reaches the Deviation (%) or Depth (Points) you set, the indicator confirms that previous peak as a valid Pivot High.
It then starts looking for the next potential low and applies the same criteria for a rally off that low to confirm a Pivot Low.
The process reverses for a downtrend.
Step Four: Drawing the Connecting Lines
Once a new Pivot High or Pivot Low is confirmed, the indicator draws a straight line connecting this new pivot point to the previous confirmed pivot point.
These connecting lines form the characteristic “zig-zag” pattern.
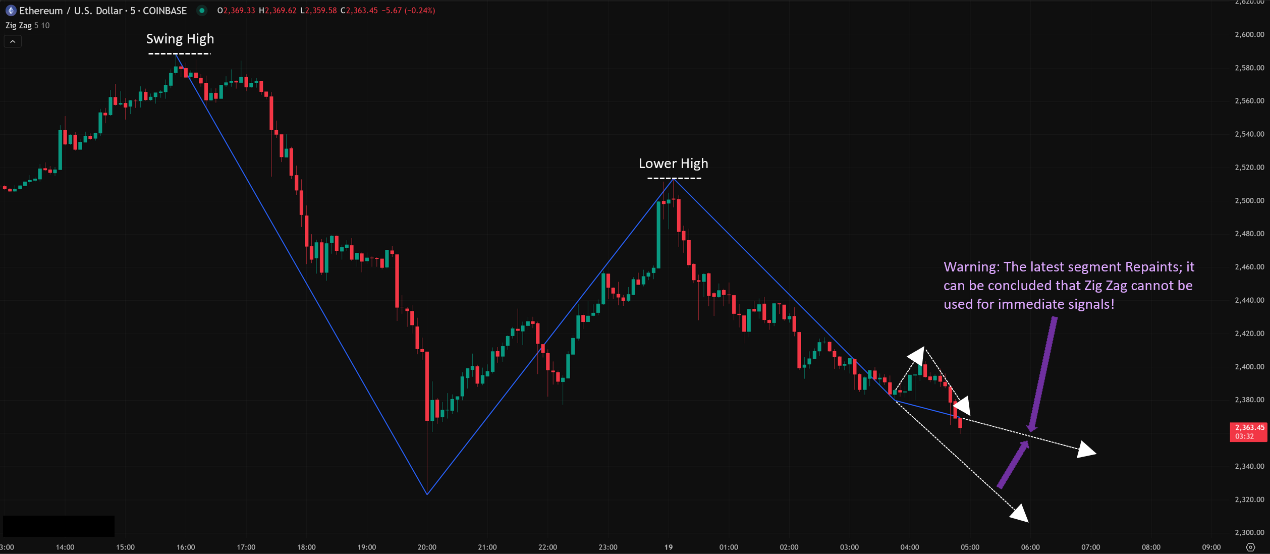
Core Point & Major Caveat: Zig Zag “Repaints”!
This is Zig Zag’s biggest characteristic and its biggest drawback!
Because the indicator needs price to reverse by a sufficient amount after a potential high/low is formed before it can confirm that point as a pivot.
Therefore, the most recent Zig Zag line segment is always “unconfirmed” or “hypothetical”! If the price continues making new highs/lows without meeting the reversal criteria, that last “potential” pivot point and the line leading to it will disappear, and the previous line segment will simply extend further!
Meaning: You CANNOT use the very latest, still-forming Zig Zag line segment for real-time trading decisions! It is lagging and subject to change!
Think of a “Connect the Dots” Game Where You Can Erase:
Zig Zag is like connecting dots, but the dots aren’t finalized immediately.
You have to wait for the pencil (price) to travel a certain distance, then turn around and go back far enough, before you can confirm the turning point (the dot) was real and draw the line permanently.
While the pencil is still moving, you might think the next dot is at point X, but if it keeps going, point X vanishes, and you have to wait until it actually turns before knowing the real dot’s location.
「Basic Zig Zag Appearance & “Repainting” Caveat」
Given its repainting nature, Zig Zag’s primary value isn’t generating immediate signals, but serving as an analytical framework and support tool.
Level 1: Basic Usage – Chart Simplification & Structure ID
Visualizing the Main Trend:
The most direct benefit: Zig Zag makes charts look much cleaner! It simplifies complex candle fluctuations into clear up and down legs, helping you see the primary direction at a glance.
Identifying Significant Highs/Lows:
The Pivot Highs and Lows it automatically marks are the more significant turning points in the market structure. They can be used as basic S/R references (keeping the lag in mind).
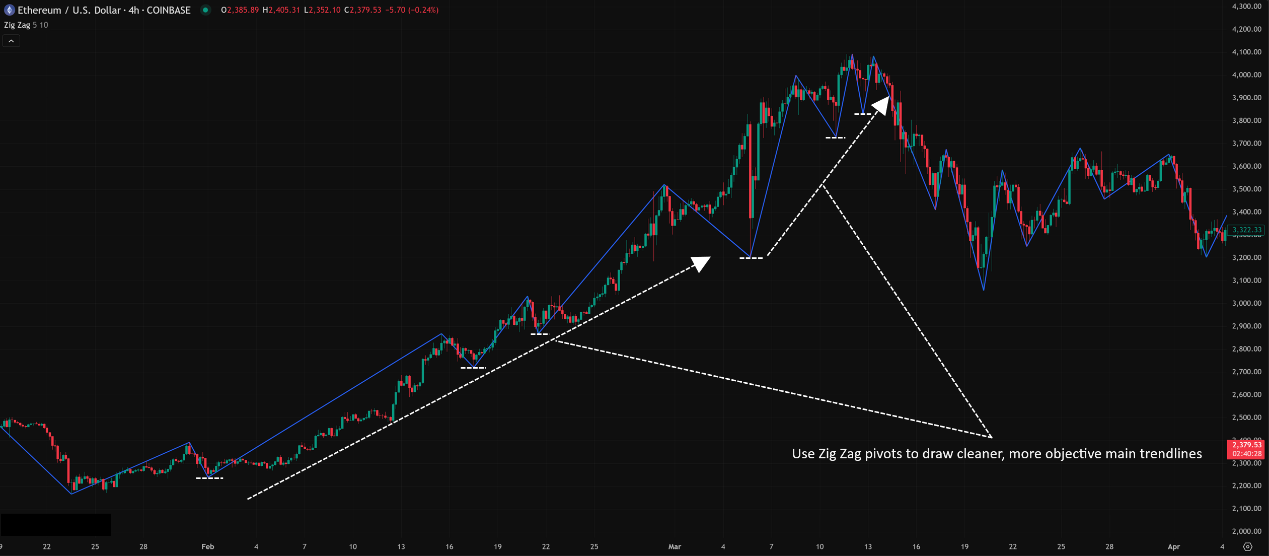
Assisting Trendline Drawing:
You can often draw more stable and representative trendlines by connecting the Pivot Lows identified by Zig Zag for an uptrend, or connecting the Pivot Highs for a downtrend. Since Zig Zag filters minor noise, the resulting trendlines might better capture the main thrust.
Assisting Pattern Recognition:
The simplified lines of the Zig Zag can make classic chart patterns (like Head & Shoulders, Double Tops/Bottoms, Triangles) much more obvious and easier to spot.
「Using Zig Zag to Assist Trendline Drawing」
Level 2: Advanced Plays – Parameter Tuning & Strategy Integration
How to use Zig Zag like a pro? Understanding its parameters and combining it with other tools is key.
A. Parameter Deep Dive:
Core Parameter: Deviation (%) / Depth (Points)
How to Choose?
Percentage (%) or Points?
Percentage (%): Adapts automatically to price levels. Better for assets with wide price ranges (like Crypto) or when comparing across different assets. However, 5% means very different things for a $10 stock vs. $50,000 Bitcoin.
Points: More fixed and direct. Might be suitable for assets with relatively stable volatility (like some FX pairs) or when you want to define an absolute reversal amount.
No absolute right/wrong, depends on the asset and goal. Many platforms default to percentage.
Value Size:
High Deviation/Depth (e.g., 10%, 200 points): Extremely strong filter, only shows major long-term pivots. Very smooth line, but lags significantly, misses many medium/short-term swings. Maybe useful for ultra-long-term analysis.
Medium Deviation/Depth (e.g., 5%, 100 points): Common settings. Filters most noise, shows clear intermediate swings. Most widely used range.
Low Deviation/Depth (e.g., 1%, 20 points): Very sensitive to price changes, shows many minor pivots. Line becomes very jagged, potentially defeating the purpose of noise filtering.
How Global Traders Play It?
No Universal Standard! Zig Zag parameter choice is highly subjective and depends heavily on the asset, timeframe, and trading strategy.
Crypto Traders: Might use Percentage (%) more often due to high volatility. Values from 5% to 15% are common, depending on the desired swing size.
Stock/FX Traders: Might use percentages (e.g., 3%-8%) or fixed points based on typical asset ranges.
Key: You need to experiment! Try different settings on your preferred assets and timeframes. See which setting draws Zig Zag lines that best match your definition of significant turning points.
Secondary Parameter: Backstep / Depth / ExtDeviation (Names Vary)
This parameter defines how many candles after a potential Pivot High/Low must stay within a certain range (or not make a new high/low) before that pivot is confirmed.
Default is often 3. Meaning, at least 3 bars are needed to confirm a turn.
Larger Value: Higher confirmation requirement, line lags more, but filters more potential false turns.
Smaller Value (e.g., 1 or 2): Lower confirmation requirement, reacts faster, but more susceptible to being faked out.
Recommendation: Sticking to the default of 3 is usually fine unless you have a specific strategy reason to adjust confirmation speed.
B. Timeframe Application Strategy:
Multi-Timeframe Analysis (MTF):
Use a larger Deviation/Depth setting on a higher timeframe (e.g., D1, W1) to identify the major trend and primary S/R zones.
Then use a smaller Deviation/Depth setting on a lower timeframe (e.g., H1, H4) to identify secondary trends and shorter-term pivots for more precise entries within the direction of the major trend.
Example: D1 Zig Zag shows a primary uptrend (HH/HL). Switch to H1, use a more sensitive Zig Zag setting, wait for price to pull back and form an HL on the H1 Zig Zag, then look for buy signals.
C. Which Combos Are “Hot” & Effective? (Hottest Combos & Effectiveness)
Zig Zag isn’t a signal generator; its power comes from combining it with other tools.
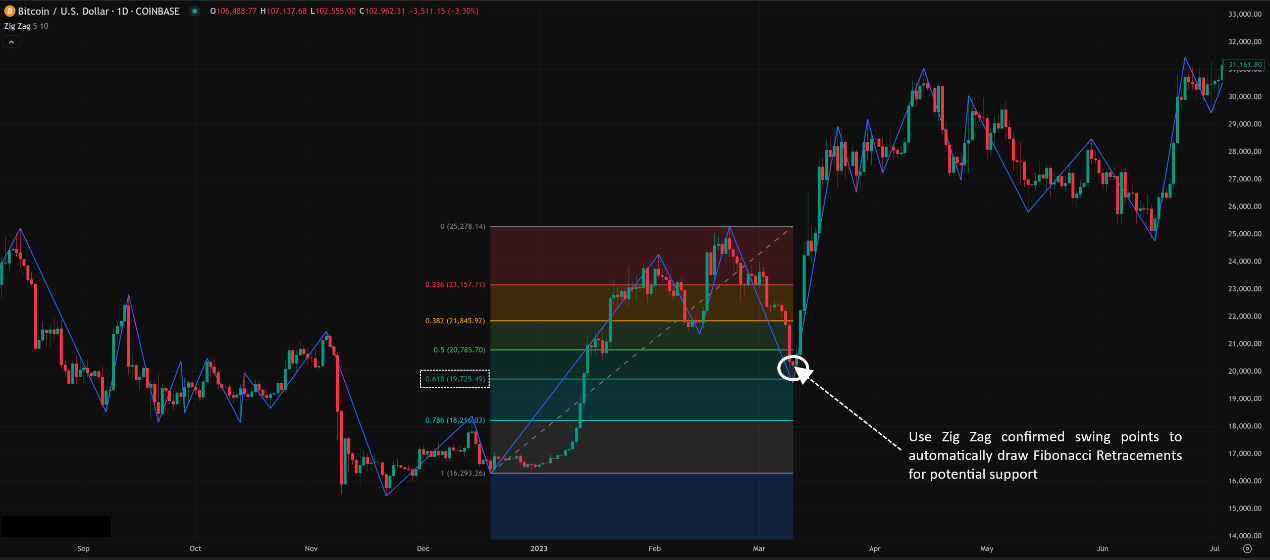
The Classic Combo: Zig Zag + Fibonacci (Retracements & Extensions)
Execution: Use the major swing points automatically identified by the Zig Zag as the anchor points for drawing Fibo Retracements and Extensions!
Advantage: Solves the subjective problem of “which high/low do I pick?” when drawing Fibos manually. Makes Fibo application more standardized and objective.
Effectiveness: Very popular! Especially helpful for beginners or those wanting quick Fibo application. The resulting Fibo levels can be used for pullback S/R or extension targets.
Pattern Recognition Combo: Zig Zag + Chart Patterns
Execution: Use the simplified lines of the Zig Zag to more easily spot classic chart patterns like:
Head & Shoulders: Zig Zag clearly outlines the Left Shoulder, Head, Right Shoulder pivots.
Double Tops/Bottoms (M/W): Zig Zag clearly shows the two nearby peaks or troughs.
1-2-3 Patterns: Zig Zag draws the 1-2-3 points of a potential trend reversal.
Effectiveness: Improves the speed and accuracy of pattern identification.
Elliott Wave Assist: Zig Zag + Elliott Wave
Execution: For those studying or using Elliott Wave Theory, Zig Zag can help visually identify potential wave structures (e.g., 1-5 impulse waves, A-B-C corrective waves) as a starting point.
Caution: Zig Zag won’t perfectly match EW rules; it’s just a visual aid. Wave counting still requires significant subjective judgment and experience.
Confirmation Combo: Zig Zag + RSI/MACD Divergence
Execution: Use Zig Zag to identify major price swing highs/lows (HH/LH or LL/HL). Then compare these price pivots to the corresponding peaks/troughs on RSI or MACD to look for divergence.
Effectiveness: When divergence occurs at a “significant” high/low confirmed by Zig Zag, the signal might carry more weight.
「Zig Zag + Fibonacci Retracement Combined Use」
D. Best Parameter Combos? (Optimal Settings Verdict – It Depends!)
This is the trickiest part of Zig Zag – there is NO universally accepted “best” parameter combo!
Why Not? Because what constitutes a “significant turn” is relative. A 1% pullback might be huge for a scalper but irrelevant noise for a long-term investor.
Parameter Selection is an “Optimization” Process: You need to adjust and test based on:
Asset: High-volatility Crypto might need a larger Deviation % than a stable FX pair.
Timeframe: 5% might work on a Daily chart but filter out everything on an M5 chart.
Strategy: Are you catching major trends or minor swings? How sensitive do you need it to be?
Common “Starting Points” (Not Optimal!):
Deviation (%): 5% (common default), 8%, 10%, 12% – Higher value = fewer lines, more lag.
Depth (Points): Needs estimation based on asset’s ATR or price level, e.g., setting it to a multiple of ATR (14).
Backstep: 3 (common default).
The “Hottest” Isn’t a Parameter, It’s the Use Case:
The more popular (“hot”) usage now isn’t chasing perfect parameters, but understanding Zig Zag’s lagging and repainting nature and using it primarily as:
A visual aid for chart clarity.
An objective way to define swings for drawing Fibos or identifying structure.
A complementary tool alongside forward-looking analysis.
Conclusion: Don’t waste time searching for the “magic parameter.” Start with defaults, tweak based on your needs, focus on understanding its role and limitations, and use it as part of your analysis process, not as a signal source.
The Zig Zag indicator, despite not generating direct buy/sell signals and having the repainting issue, remains a very valuable visualization and analytical support tool.
It helps you:
Filter out market noise and focus on the primary trend.
Objectively (based on parameters) identify significant swing highs and lows.
Make trendlines and chart patterns easier to spot.
Provide anchor points for Fibo, Elliott Wave, and other analyses.
For young traders looking to bring clarity to complex charts or seeking a more standardized way to identify major swings, learning how to set up and interpret the Zig Zag indicator can significantly improve your chart analysis efficiency.
Remember:
Zig Zag lags and repaints! Don’t rely on the latest segment for decisions.
It’s a visual aid and structure identifier, not a trade signal generator.
Parameter settings are crucial and need testing and adjustment based on asset, timeframe, and strategy.
Combining it with Fibonacci is one of its most common and practical uses.
Understand its limitations and use it alongside other tools.
Alright! Hope this deep dive into the Zig Zag indicator helps you out! Try experimenting with different parameters on your charts and see how it helps bring “order” to the market chaos! See ya! Keep it clean, keep it clear! ✨